%20ammap.com%20%7C%20SVG%20map%20of%20Egypt%20-%20High%20--%3E%0A%3Csvg%20xmlns%3D%22http%3A%2F%2Fwww.w3.org%2F2000%2Fsvg%22%20xmlns%3Aamcharts%3D%22http%3A%2F%2Famcharts.com%2Fammap%22%20xmlns%3Axlink%3D%22http%3A%2F%2Fwww.w3.org%2F1999%2Fxlink%22%20version%3D%221.1%22%20viewBox%3D%220%200%20820%201250%22%20width%3D%22100%25%22%20height%3D%22100%25%22%20preserveAspectRatio%3D%22xMidYMid%20slice%22%3E%0A%09%3Cdefs%3E%0A%09%09%0A%0A%09%09%3Camcharts%3Aammap%20projection%3D%22mercator%22%20leftLongitude%3D%2224.697924%22%20topLatitude%3D%2231.667680%22%20rightLongitude%3D%2236.894654%22%20bottomLatitude%3D%2221.724740%22%3E%3C%2Famcharts%3Aammap%3E%0A%0A%09%09%3C!--%20All%20areas%20are%20listed%20in%20the%20line%20below.%20You%20can%20use%20this%20list%20in%20your%20script.%20--%3E%0A%09%09%3C!--%7Bid%3A%22EG-ALX%22%7D%2C%7Bid%3A%22EG-ASN%22%7D%2C%7Bid%3A%22EG-AST%22%7D%2C%7Bid%3A%22EG-BA%22%7D%2C%7Bid%3A%22EG-BH%22%7D%2C%7Bid%3A%22EG-BNS%22%7D%2C%7Bid%3A%22EG-C%22%7D%2C%7Bid%3A%22EG-DK%22%7D%2C%7Bid%3A%22EG-DT%22%7D%2C%7Bid%3A%22EG-FYM%22%7D%2C%7Bid%3A%22EG-GH%22%7D%2C%7Bid%3A%22EG-GZ%22%7D%2C%7Bid%3A%22EG-IS%22%7D%2C%7Bid%3A%22EG-JS%22%7D%2C%7Bid%3A%22EG-KB%22%7D%2C%7Bid%3A%22EG-KFS%22%7D%2C%7Bid%3A%22EG-KN%22%7D%2C%7Bid%3A%22EG-LX%22%7D%2C%7Bid%3A%22EG-MN%22%7D%2C%7Bid%3A%22EG-MNF%22%7D%2C%7Bid%3A%22EG-MT%22%7D%2C%7Bid%3A%22EG-PTS%22%7D%2C%7Bid%3A%22EG-SHG%22%7D%2C%7Bid%3A%22EG-SHR%22%7D%2C%7Bid%3A%22EG-SIN%22%7D%2C%7Bid%3A%22EG-TER%22%7D%2C%7Bid%3A%22EG-HT%22%7D%2C%7Bid%3A%22EG-SUZ%22%7D%2C%7Bid%3A%22EG-WAD%22%7D--%3E%0A%0A%09%3C%2Fdefs%3E%0A%09%3Cg%3E%0A%09%09%3Cpath%20fill%3D%22white%22%20stroke%3D%22none%22%20id%3D%22EG-ALX%22%20title%3D%22Al%20Iskandar%C4%AByah%22%20%20d%3D%22M305.8%2C311.32v0.09l0.1%2C0.06l-0.02%2C0.07h-0.06l-0.04%2C-0.12h-0.08l-0.21%2C0.16l0.02%2C0.15l0.13%2C0.03l-0.1%2C0.17l0.11%2C0.06l-0.26%2C0.06l0.01%2C0.09l0.11%2C0.07l-0.09%2C0.28l0.21%2C0.29l-0.01%2C0.22l0.12%2C0.21l0.26%2C0.16l0.05%2C0.48l0.12%2C0.1l0%2C0l-0.02%2C2.23l-1.11%2C1.81l0%2C0l0%2C0l0%2C0l-1.19%2C3.14l-4.56%2C2.63l0%2C0l-3.2%2C2.64l2.3%2C2.03l-0.7%2C2.76l0%2C0l-1.17%2C2.09l2.28%2C3.74l5.62%2C6.44l-5.06%2C7.56l-4.91%2C2.33l-3.9%2C1.27l-1.79%2C0.26l-1.42%2C2.08l-1.43%2C4.22l0%2C0L285%2C330.61l0.02%2C-3.08l0%2C0l0.18%2C-0.12l0.1%2C-0.17l0.3%2C-0.07l0.11%2C-0.17l0.22%2C-0.09l0.8%2C-0.67l0.16%2C-0.04l0.37%2C-0.29l0.08%2C-0.25h0.06v0.06l0.11%2C-0.06l0.4%2C-0.39l0.39%2C-0.28l0.35%2C-0.42l0.67%2C-0.55l0.1%2C-0.01l0.06%2C-0.12l0.35%2C-0.12l0.54%2C-0.44l0.27%2C-0.1l0.15%2C-0.23l0.42%2C-0.28l0.05%2C-0.13l0.24%2C-0.07l0.03%2C-0.13l0.19%2C-0.1l0.57%2C-0.68l0.15%2C-0.36l-0.02%2C-0.26l0.17%2C-0.06l0.15%2C-0.16l0.21%2C-0.01l-0.11%2C0.16l-0.21%2C0.06l0.01%2C0.12h0.12l0.04%2C0.1l0.11%2C-0.06l0.1%2C-0.22l0.15%2C0.06l-0.02%2C0.15l-0.15%2C0.17l-0.05%2C0.26l0.09%2C-0.04l0.05%2C-0.19l0.19%2C-0.23l0.07%2C0.1l-0.04%2C0.31l0.25%2C0.03l0.06%2C-0.19l0.09%2C-0.04v0.36l0.26%2C-0.16l0.17%2C0.03l0.13%2C-0.15l0.14%2C-0.03l0.21%2C-0.17l0.14%2C-0.29l0.09%2C0.06l0.11%2C-0.06l0.21%2C-0.33l0.31%2C-0.17l0.17%2C-0.25l0.08%2C-0.45h0.11v0.13l0.07%2C-0.01l0.3%2C-0.28l-0.01%2C-0.09l0.06%2C-0.01l0.07%2C0.09l0.26%2C-0.39l-0.06%2C-0.15l-0.12%2C0.03l0.01%2C0.09l-0.07%2C0.03l-0.13%2C-0.17l0.21%2C-0.33l0.25%2C-0.17l-0.04%2C-0.06l-0.04%2C0.09l-0.05%2C-0.01l-0.09%2C-0.17h-0.15l-0.12%2C0.23l-0.09%2C0.04l-0.01%2C0.12l-0.2%2C-0.01l-0.05%2C0.22l-0.12%2C-0.1l0.06%2C0.2l-0.22%2C-0.15l0.47%2C-0.49l0.02%2C-0.12l-0.06%2C-0.06l0.26%2C-0.06l0.05%2C-0.12l0.39%2C-0.07v-0.17l-0.1%2C-0.15l0.11%2C-0.07l0.22%2C0.01l0.13%2C-0.12l0.05%2C0.07l-0.14%2C0.09l-0.02%2C0.19l0.17%2C0.26l0.2%2C0.12l0.37%2C-0.05l0.31%2C-0.39l-0.21%2C-0.26l0.16%2C0.01l0.24%2C0.22l0.35%2C-0.19l0.25%2C-0.26l0.41%2C-0.25l0.15%2C-0.22l0.22%2C-0.1l0.19%2C-0.28h0.15l0.05%2C-0.16l0.14%2C0.03l-0.02%2C-0.15l0.07%2C-0.09l0.24%2C0.01l0.11%2C-0.15l0.09%2C-0.01l0.05%2C-0.16l0.13%2C-0.03l0.05%2C-0.17l0.15%2C-0.17l0.21%2C-0.1l0.15%2C-0.23l0.26%2C-0.16l0.01%2C-0.13l-0.06%2C-0.09l0.06%2C-0.15l0.5%2C-0.03l0.19%2C-0.19l0.03%2C-0.2l0.26%2C-0.03l0.1%2C-0.22l-0.13%2C-0.16l0.06%2C-0.09l0.13%2C0.01l-0.01%2C-0.13l0.17%2C-0.03l0.21%2C0.17l0.04%2C-0.13l-0.12%2C0.03l-0.02%2C-0.06l0.1%2C-0.25l0.07%2C0.16l0.14%2C0.1l0.2%2C-0.01l0.32%2C-0.17l0.24%2C-0.31l0.01%2C-0.1l0.3%2C-0.32l-0.01%2C-0.13l-0.22%2C-0.16l0.19%2C-0.12l-0.03%2C-0.09l0.49%2C-0.13l0.27%2C-0.36l0.22%2C-0.09l0.02%2C-0.07l0.1%2C0.03L305.8%2C311.32z%22%2F%3E%0A%09%09%3Cpath%20fill%3D%22white%22%20stroke%3D%22none%22%20id%3D%22EG-ASN%22%20title%3D%22Asw%C4%81n%22%20%20d%3D%22M437.46%2C668.05L436.44%2C671.6L436.43%2C677.63L437.22%2C679.48L437.54%2C682.47L438.46%2C683.61L439.63%2C685.74L439.83%2C687.59L440.16%2C689.01L441.14%2C690.78L442.77%2C691.71L444.21%2C693.34L444.41%2C697.87L445.48%2C698.28L445.32%2C700.12L444.6%2C700.85L444.01%2C701.84L443.62%2C704.04L443.69%2C706.38L444.67%2C709.78L446.24%2C710.14L447.07%2C712.05L447.84%2C713.5L447.61%2C714.87L446.82%2C716L446.17%2C718.2L445.12%2C720.25L443.56%2C721.87L442.45%2C723.22L441.2%2C725.26L439.9%2C726.68L439.83%2C727.88L440.81%2C728.73L443.29%2C731.2L446.32%2C731.44L447.34%2C732.42L450.66%2C734.77L450.66%2C734.77L452.89%2C738.29L453.1%2C741.6L453.1%2C741.6L451.91%2C743.62L449.2%2C743.22L446.44%2C740.28L444.99%2C738.37L442.11%2C738.8L442.11%2C738.8L439.54%2C738.02L437.71%2C736.85L435.09%2C735.01L431.93%2C735.34L431.93%2C735.34L428.94%2C736.98L429.2%2C742.51L428.02%2C745.93L425.71%2C748.51L422.98%2C750.1L419.26%2C752.55L416.12%2C755.3L413.5%2C756.08L413.5%2C756.08L410.56%2C756.96L407.13%2C755.44L407.13%2C755.44L404.78%2C753.16L403.31%2C751.26L401.2%2C749.93L398.45%2C750.59L397.27%2C755.04L396.88%2C757.39L395.7%2C760.27L394.66%2C762.23L393.27%2C763.97L390.56%2C765.13L386.28%2C764.46L384.84%2C767.6L382.88%2C769.56L380.13%2C771L372.02%2C773.75L372.02%2C773.75L370.83%2C778.4L365.66%2C778.39L365.6%2C778.15L365.69%2C777.45L366.29%2C775.75L366.71%2C774.87L368.06%2C772.74L368.47%2C772.27L369.12%2C771.75L369.4%2C771.28L369.93%2C770.65L370.19%2C770.07L370.17%2C769.79L370%2C769.53L369.48%2C769.26L368.88%2C768.21L368.47%2C767.93L368.21%2C768.04L367.32%2C768.8L363.51%2C771.13L362.07%2C771L362.07%2C771L359.4%2C771.26L357.89%2C769.04L358.67%2C766.29L362.99%2C764.06L366%2C763.15L370%2C763.27L372.96%2C760.54L374.88%2C758.38L375.71%2C756.81L376.19%2C755.23L375.96%2C753.63L375.96%2C749.3L375.75%2C747.08L376.59%2C745.25L378.06%2C743.51L379.23%2C743.01L382%2C742.99L384.05%2C743.22L385.66%2C742.99L387.92%2C742.25L396.56%2C739.83L402.05%2C738.21L403.03%2C738.59L405.62%2C738.85L408.19%2C739.36L410.13%2C740.58L411.63%2C741.24L413.27%2C740.32L414.97%2C737L415.92%2C734.99L417.15%2C732.81L417.94%2C730.44L419.19%2C727.64L420.88%2C724.94L422.2%2C722.67L423.74%2C719.43L425.43%2C716.9L426.85%2C714.54L427.15%2C713.58L426.67%2C711.6L424.6%2C711.71L422.88%2C712.1L420.2%2C711.74L415.02%2C710.51L413.63%2C708.86L413.99%2C705.58L415.7%2C699.65L417.11%2C697.64L418.67%2C696.62L420.96%2C695.26L423.15%2C694.35L425.16%2C693.79L427.28%2C692.07L426.96%2C690.81L425.47%2C689.6L423.36%2C687.56L423.19%2C684.42L424.58%2C683.03L425.86%2C682.54L427.7%2C681.62L431.44%2C677.71L431.83%2C671.26L431.83%2C668.3L432.42%2C664.1L432.44%2C660.68L433.19%2C657.2L433.85%2C653.71L433.85%2C650.83L434.41%2C647.51L432.61%2C644.03L432.05%2C641.84L430.88%2C638.28L430.82%2C636.11L430.85%2C633.51L430.46%2C631.66L428.86%2C629.65L426.18%2C627.13L422.69%2C625.51L422.69%2C625.51L423.65%2C622L423.58%2C618.43L423.58%2C618.43L425.49%2C620.16L425.49%2C620.16L427.88%2C621.64L429.71%2C623.41L434.06%2C626.43L437.35%2C631.93L437.82%2C635.27L437.96%2C644.85L439.88%2C649.38L442.94%2C654.49L443.17%2C656.04L442.78%2C660.05L439.58%2C662.71L437.59%2C665.68L437.46%2C668.05L437.46%2C668.05z%22%2F%3E%0A%09%09%3Cpath%20fill%3D%22white%22%20stroke%3D%22none%22%20id%3D%22EG-AST%22%20title%3D%22Asy%C5%AB%C5%A3%22%20%20d%3D%22M375.17%2C541.63L372.95%2C541.61L372.1%2C539.76L371.06%2C538.78L370.17%2C536.8L369.31%2C535.65L367.53%2C535.46L366.96%2C536.55L365.81%2C538.21L364.95%2C538.85L363.23%2C539.81L362.04%2C540.79L361.39%2C540.99L361.39%2C540.99L359.15%2C537.28L357.31%2C532.99L355.51%2C529.28L353.8%2C526.47L351.11%2C524.92L349.46%2C524.53L347.3%2C524.29L346.31%2C523.76L344.2%2C521.88L340.26%2C518.03L338.87%2C517.25L337.74%2C515.6L337.22%2C513.46L335.83%2C511.61L334.88%2C509.57L334.43%2C507.02L333.4%2C506.55L333.23%2C504.61L332.45%2C503.83L332.54%2C501.59L333.58%2C501.49L333.58%2C501.49L336.61%2C501.49L338.44%2C501.98L340.87%2C502.37L342.43%2C501L345.21%2C501.19L345.21%2C501.19L344.54%2C504.59L345.12%2C509.3L345.73%2C510.85L347.2%2C512.61L348.14%2C513.07L351.54%2C514.26L352.93%2C515.33L356.82%2C516.85L357.97%2C516.95L360.07%2C518L361.41%2C518.75L362.78%2C523.17L365.62%2C525.35L365.62%2C525.35L368.18%2C527.53L369.46%2C528.43L369.46%2C528.43L370.86%2C531.51L373.16%2C535.29L374.65%2C539.13z%22%2F%3E%0A%09%09%3Cpath%20fill%3D%22white%22%20stroke%3D%22none%22%20id%3D%22EG-BA%22%20title%3D%22Al%20Ba%E1%B8%A9r%20al%20A%E1%B8%A9mar%22%20%20d%3D%22M563.28%2C688.79l0.08%2C0.65l0.11%2C0.33l-0.09%2C0.19l-0.19%2C0.03l-0.17%2C-0.07l-0.01%2C-0.11l0.04%2C-0.05l0.06%2C0.03l0.01%2C-0.1l0.2%2C-0.16l-0.04%2C-0.58l-0.06%2C-0.11L563.28%2C688.79zM480.67%2C544.25l0.16%2C0.14l0.04%2C0.17l0.2%2C0.07l0.04%2C0.15l0.5%2C-0.04l0.09%2C0.08l0.03%2C0.21l-0.14%2C0.83l0.09%2C0.24l0.17%2C0.15l0.12%2C0.33v0.15l-0.1%2C0.13l0.05%2C0.56l-0.07%2C0.07l0.05%2C0.07l-0.05%2C0.08l-0.09%2C-0.03l-0.35%2C-0.51l-0.13%2C-0.38l-0.13%2C-0.1l-0.07%2C0.01l-0.25%2C-0.38l0.09%2C-0.28l-0.05%2C-0.25l-0.24%2C-0.11l-0.14%2C-0.28l-0.12%2C-0.01v-0.18l-0.23%2C-0.24l0.01%2C-0.22l0.09%2C-0.11l0.19%2C-0.07l0.15%2C-0.26H480.67zM477.82%2C519.71l0.17%2C0.15l0.04%2C-0.11l0.2%2C0.07l0.29%2C0.35l0.13%2C0.28l0.11%2C0.07l0.06%2C0.39l-0.08%2C0.2l0.01%2C0.2l0.14%2C0.18l0.06%2C0.27l0.22%2C0.1l0.08%2C0.53l0.11%2C0.07l0.05%2C0.27l-0.06%2C0.11l-0.26%2C-0.07l-0.04%2C0.06l-0.23%2C0.03l-0.05%2C-0.1l-0.26%2C-0.14l-0.26%2C-0.6l-0.45%2C-0.38l-0.26%2C-0.03l0.05%2C-0.15l-0.08%2C-0.04l-0.02%2C-0.14l-0.22%2C-0.17l-0.13%2C-0.22l0.06%2C-0.17l0.35%2C0.15l0.2%2C-0.1l-0.01%2C-0.18l-0.19%2C-0.46l0.05%2C-0.18l0.09%2C-0.06l0.05%2C-0.15L477.82%2C519.71zM478.83%2C506.09l0.08%2C0.1l0.5%2C0.03l0.2%2C-0.06l0.64%2C0.07l0.11%2C0.24l0.3%2C0.11l0.4%2C0.49l0.54%2C0.25l0.16%2C0.01l0.4%2C0.28l0.05%2C0.15l0.46%2C0.01l0.13%2C0.06l0.25%2C0.38l0.01%2C0.2l0.25%2C0.53l0.04%2C0.34l0.19%2C0.2l0.21%2C0.78l-0.15%2C0.32l-0.31%2C0.07l-0.32%2C-0.01v-0.11l0.15%2C-0.03v-0.1l-0.42%2C-0.46l-0.15%2C-0.36l-0.25%2C-0.17l-0.36%2C0.03l-0.04%2C-0.25l-0.33%2C-0.36l-0.15%2C-0.08l-0.07%2C-0.14l-0.23%2C-0.1l-0.15%2C-0.21l-0.41%2C0.04l-0.16%2C-0.1l-0.24%2C0.01l-0.02%2C-0.1l-0.3%2C-0.29l-0.17%2C0.01l-0.22%2C-0.17l-0.22%2C0.11l-0.25%2C0.03l-0.15%2C-0.06l-0.57%2C-0.66l-0.09%2C-0.35l0.01%2C-0.08h0.14l0.11%2C0.13l0.09%2C-0.06l0.1%2C-0.48L478.83%2C506.09zM472.31%2C505.01l0.11%2C0.06l0.04%2C0.11l-0.11%2C0.18l0.04%2C0.35l-0.15%2C-0.07v-0.11l-0.13%2C-0.06l-0.1%2C-0.22l0.11%2C-0.2L472.31%2C505.01zM470.73%2C504.58l0.21%2C0.08l0.02%2C0.14l0.13%2C0.03l0.05%2C0.13l0.27%2C0.24l0.11%2C0.27l-0.07%2C0.03l-0.39%2C-0.31l-0.37%2C-0.53L470.73%2C504.58zM471.44%2C501.58l0.21%2C0.2l0.05%2C0.17l0.26%2C0.14l-0.09%2C0.66l-0.14%2C0.22l0.14%2C0.04v0.14l0.1%2C0.17l0.17%2C0.03l0.55%2C0.36l0.27%2C0.03l0.11%2C0.24l-0.14%2C0.34l-0.41%2C0.25l-0.08%2C0.17l-0.35%2C0.04l-0.21%2C0.11l0.04%2C0.5l0.21%2C0.28l-0.06%2C0.13l-0.12%2C-0.11l-0.26%2C-0.5l-0.01%2C0.24l-0.35%2C-0.53l0.07%2C-0.24l0.51%2C-0.01l0.04%2C-0.21l-0.13%2C-0.01l-0.24%2C-0.18l-0.22%2C0.01l-0.26%2C-0.08v-0.07l-0.13%2C-0.06l-0.08%2C-0.13l-0.46%2C-0.07l-0.13%2C-0.06l-0.05%2C-0.1l0.28%2C-0.49l0.09%2C-0.31l0.15%2C-0.14v-0.2l0.3%2C-0.84l0.05%2C-0.08L471.44%2C501.58zM472.12%2C501.29l0.06%2C0.03l0.08%2C0.35l0.14%2C0.11l0.01%2C0.21l-0.16%2C-0.07l-0.15%2C-0.27l-0.06%2C-0.31L472.12%2C501.29zM472.89%2C499.66l0.14%2C0.13l0.16%2C0.34l0.39%2C0.17l0.16%2C0.67l-0.03%2C0.36l-0.27%2C0.38l-0.08%2C0.31l-0.15%2C-0.03l-0.46%2C-0.41l-0.03%2C-0.15l-0.15%2C-0.13l-0.17%2C-0.62l-0.11%2C-0.07l-0.08%2C-0.2l-0.01%2C-0.13l0.14%2C-0.04l-0.06%2C-0.22l0.09%2C-0.15l0.23%2C-0.04l0.09%2C-0.11L472.89%2C499.66zM473.28%2C498.76l0.05%2C0.14l-0.06%2C0.06l-0.13%2C-0.04l-0.15%2C0.1l-0.19%2C0.31l-0.05%2C0.22l-0.21%2C-0.04l-0.24%2C0.07l-0.05%2C0.07v-0.08l-0.09%2C-0.06l0.06%2C-0.18l0.09%2C0.06l0.09%2C-0.15l0.19%2C-0.04l0.02%2C-0.31l0.29%2C0.03l0.14%2C-0.07l0.08%2C0.04L473.28%2C498.76zM464.35%2C494.4l0.03%2C0.07l-0.11%2C0.07l-0.03%2C-0.08L464.35%2C494.4zM463.82%2C493.54l0.26%2C0.1l0.17%2C0.17l0.01%2C0.1l-0.09%2C0.11l0.15%2C0.13l0.06%2C0.22l-0.15%2C-0.13l-0.1%2C0.24l0.08%2C0.03l0.05%2C0.13l0.04%2C0.48l-0.37%2C-0.13l-0.08%2C-0.28l-0.61%2C-0.48l0.24%2C-0.29l0.06%2C-0.24l0.16%2C-0.03l0.04%2C-0.13H463.82zM370.4%2C429.06l4.44%2C0.63l4.47%2C1.76l6.48%2C1.58h1.24l0%2C0l1.09%2C2.1l5.16%2C-0.98l6.63%2C-0.1l8.03%2C-4.94l4.28%2C-1.17l3.94%2C-2.34l5.38%2C-0.19l0%2C0l0.13%2C-0.01l0.09%2C0.24l-0.05%2C0.16l0.19%2C0.13l0.14%2C0.24l-0.04%2C0.36l0.09%2C0.2l-0.03%2C0.27l-0.24%2C0.58l0.03%2C0.07l-0.18%2C0.11l-0.15%2C0.26l-0.07%2C-0.04l-0.56%2C0.47v0.1l0.11%2C0.06l-0.01%2C0.11l-0.08%2C-0.1l-0.4%2C0.07l-0.35%2C0.43l-0.07%2C0.2v0.06l0.01%2C0.07l0.33%2C0.41l0.05%2C0.57l-0.28%2C0.37l-0.11%2C0.47l-0.1%2C1.14l0.05%2C0.36l0.51%2C0.82l0.29%2C0.28l0.42%2C0.57l0.37%2C0.31l0.28%2C0.34l0.17%2C0.55l0.24%2C0.35l0.13%2C0.68l0.17%2C0.48l0.13%2C0.07l-0.08%2C0.52l0.41%2C0.45l0.08%2C0.28l-0.06%2C0.1l0.51%2C0.38l0.25%2C0.38l0.14%2C0.01l0.06%2C0.1l0.27%2C0.1l0.36%2C0.28l0.36%2C0.75l0.14%2C0.57l0.34%2C0.42l0.2%2C0.08l0.05%2C0.16l0.13%2C0.03l0.2%2C0.21l0.77%2C0.07l0.54%2C0.18l0.22%2C0.14l0.46%2C0.4l0.25%2C0.54l0.12%2C0.13l0.33%2C0.78l0.08%2C0.44l0.17%2C0.42l0.1%2C0.21l0.14%2C0.04l0.19%2C0.23l-0.15%2C0.5l0.02%2C0.54l0.26%2C0.53l0.2%2C0.08l-0.03%2C0.27l0.29%2C0.71l-0.1%2C0.06l0.01%2C0.67l0.14%2C0.16l0.01%2C0.24l0.35%2C0.18v0.37l0.13%2C0.11l0.05%2C0.17l0.01%2C0.3l0.24%2C0.75l0.04%2C0.66l0.16%2C0.88l-0.01%2C0.37l-0.16%2C0.27l0.16%2C0.27l0.06%2C0.08l0.61%2C0.24l0.12%2C0.17h0.29l0.42%2C0.21l0.39%2C-0.03l0.14%2C0.1l0.5%2C0.1l0.17%2C0.14h0.1l0.03%2C0.11l0.13%2C0.1l-0.04%2C0.14l0.3%2C0.13l0.1%2C0.27l0.14%2C0.14v0.13l0.11%2C0.08l0.07%2C0.28l0.2%2C0.23l0.29%2C0.2l0.29%2C-0.01l0.03%2C-0.08l0.05%2C0.01v0.08l-0.13%2C0.1l-0.04%2C0.3l0.09%2C0.17l0.14%2C0.08l0.02%2C0.15l0.19%2C0.3l0.09%2C0.01l0.03%2C0.01l0.04%2C0.06l0.17%2C-0.03l0.06%2C0.11l0.42%2C-0.03l0.26%2C0.08l0.06%2C0.13l-0.06%2C0.07l0.03%2C0.32l0.14%2C0.2l0.97%2C0.66l0.25%2C0.83l0.49%2C0.75l0.14%2C0.45v0.23l0.29%2C0.61l0.09%2C0.07l-0.01%2C0.2l0.18%2C0.1l0.17%2C0.25l0.01%2C0.14h0.14l0.05%2C0.11l0.15%2C-0.04l0.1%2C0.45l0.44%2C0.64l0.27%2C0.18l0.31%2C0.01l0.36%2C0.2l0.35%2C0.1l0.14%2C0.18l0.09%2C0.21l-0.05%2C0.3l0.08%2C0.75l-0.01%2C0.2l0.02%2C0.52l0.28%2C0.2l0.26%2C0.32l0.04%2C0.49l-0.05%2C0.21l0.31%2C0.14l0.21%2C0.28l0.26%2C0.16l0.38%2C0.06l-0.01%2C0.24l0.34%2C0.24l0.04%2C0.44l0.13%2C0.25l0.05%2C0.45l0.14%2C0.07l0.21%2C0.39l0.21%2C0.1l0.3%2C0.28l0.16%2C0.61l0.36%2C0.1l0.1%2C0.14l0.29%2C0.14l0.26%2C0.23l0.41%2C0.69l0.45%2C0.3l0.36%2C0.56l0.29%2C0.24l0.1%2C0.24l-0.09%2C0.25l0.15%2C1l0.19%2C-0.02l0.27%2C0.16h0.34l0.15%2C-0.11h0.11l0.19%2C0.14l0.39%2C0.07l0.05%2C0.21l-0.06%2C0.25l0.52%2C0.48l0.2%2C0.35l0.11%2C0.16l0.31%2C0.31h0.1l0.21%2C0.17l0.06%2C0.2l0.31%2C0.03l0.03%2C0.1l0.24%2C0.08l0.35%2C0.37l0.01%2C0.1l-0.1%2C0.11l0.02%2C0.69l0.33%2C0.75l0.37%2C-0.01l0.11%2C0.18l0.1%2C-0.04l0.13%2C0.1l0.4%2C-0.03l0.11%2C0.46l0.1%2C-0.01l0.14%2C0.08l-0.06%2C0.16l0.24%2C0.22h0.32l0.99%2C-0.2l0.44%2C0.1l0.08%2C0.21l0.06%2C0.14l0.2%2C0.23h0.36l0.17%2C0.11l0.3%2C0.52l0.06%2C-0.01l0.51%2C0.46l0.44%2C0.08l0.46%2C0.25l0.13%2C0.14l0.22%2C0.07l0.37%2C0.49l0.15%2C0.39l0.12%2C0.1l0.29%2C0.56l0.56%2C0.7l0.15%2C0.07l0.16%2C0.53l0.13%2C0.04l0.2%2C0.35l0.14%2C0.1l0.02%2C0.27l0.24%2C0.45l0.07%2C0.18v0.15l0.08%2C0.01l0.14%2C0.2h0.08l0.01%2C-0.15l0.08%2C0.01l0.07%2C0.08l-0.06%2C0.17h0.2l0.11%2C0.1l0.11%2C0.28l-0.03%2C0.36l0.06%2C0.46l0.14%2C0.27l0.11%2C0.06l0.24%2C0.31l0.11%2C0.34l0.52%2C0.25l0.02%2C0.16h-0.06l-0.04%2C0.1l0.08%2C0.34h-0.16l-0.05%2C0.25l0.19%2C0.45l-0.16%2C0.49l0.09%2C0.13v0.35l0.25%2C0.35l-0.03%2C0.18l-0.04%2C0.03l-0.17%2C0.07l-0.2%2C-0.15l-0.16%2C0.15l-0.02%2C0.11l-0.11%2C0.01l-0.04%2C-0.41l-0.06%2C-0.13l-0.16%2C-0.11l0.04%2C-0.34l-0.05%2C-0.13l-0.17%2C-0.1l-0.17%2C-0.22l-0.19%2C0.01l-0.11%2C0.25l-0.46%2C-0.06l-0.47%2C-0.44l-0.09%2C-0.01l-0.14%2C-0.25l-0.45%2C-0.03l-0.17%2C-0.27l-0.65%2C-0.01l-0.25%2C-0.21l-0.29%2C-0.1l-0.2%2C0.17h-0.09l-0.2%2C0.6l-0.11%2C0.1l-0.11%2C0.39l0.01%2C0.25l0.42%2C0.42l0.45%2C0.04v0.13l0.14%2C0.22l0.17%2C0.08l0.05%2C0.17l0.17%2C0.2l0.05%2C0.66l0.26%2C0.17l0.14%2C-0.01l0.36%2C0.86l0.45%2C0.01l0.26%2C-0.15l0.1%2C0.01l0.74%2C-0.55l0.19%2C0.34l0.06%2C-0.01l0.01%2C0.11l-0.15%2C0.24l-0.01%2C0.22l-0.13%2C0.1l-0.03%2C0.21l-0.17%2C0.29l-0.01%2C0.13l0.08%2C0.11l-0.29%2C0.29l-0.1%2C0.39l-0.17%2C0.18v0.28l0.09%2C0.01l0.11%2C0.18l0.16%2C-0.07l0.09%2C0.03l0.01%2C0.07l-0.09%2C0.04l0.04%2C0.37l-0.09%2C0.13l0.2%2C0.34l1.2%2C0.13l0.06%2C0.15v0.52l0.15%2C0.03l0.06%2C0.2h0.16l-0.1%2C0.27l0.45%2C0.29l0.06%2C-0.01l0.02%2C0.11l-0.06%2C0.39l-0.1%2C0.1l-0.04%2C-0.06l-0.17%2C0.03l-0.11%2C-0.37l-0.24%2C-0.29l0.03%2C-0.29l-0.49%2C-0.53l-0.19%2C-0.08l-0.23%2C-0.24h-0.07l-0.08%2C0.14l-0.15%2C0.06l0.06%2C0.18l0.35%2C0.43l0.04%2C0.14h-0.09l-0.25%2C-0.32l-0.22%2C-0.06l-0.09%2C-0.17l-0.19%2C-0.04l-0.02%2C-0.25l-0.21%2C-0.18l0.02%2C-0.11l-0.37%2C-0.13l-0.85%2C0.63l-0.3%2C0.41l-0.19%2C0.13l-0.15%2C0.28l-0.03%2C0.25l-0.05%2C0.01l-0.04%2C-0.08l-0.15%2C0.07l0.05%2C0.36l0.34%2C0.04l0.15%2C0.11h0.13l0.05%2C0.11l0.22%2C-0.03l0.14%2C0.31l0.25%2C0.08l0.09%2C0.25l0.47%2C0.41l0.51%2C0.76l0.28%2C0.77l0.24%2C0.1l0.03%2C0.92l0.14%2C0.18l-0.03%2C0.48l-0.21%2C0.57l0.04%2C0.56l0.11%2C0.35l0.21%2C0.08l0.45%2C-0.08l0.67%2C0.22l0.07%2C-0.03l0.06%2C0.08l-0.02%2C0.2l0.31%2C0.31l0.24%2C0.49l0.09%2C0.06l0.49%2C-0.03l0.22%2C0.17l0.01%2C0.22l0.17%2C0.15l0.08%2C0.42l0.06%2C0.07l0.03%2C0.62l0.09%2C0.1l0.01%2C0.13l0.11%2C0.06l0.14%2C0.39l0.15%2C0.17h0.13l0.2%2C0.18l0.27%2C0.13l0.15%2C0.15l0.13%2C0.43l0.09%2C0.03l0.01%2C-0.11l0.11%2C-0.03l0.06%2C0.27l0.54%2C0.5l0.02%2C0.46l0.17%2C0.21l0.06%2C0.21l0.15%2C0.01l-0.04%2C0.15l0.14%2C0.39l-0.06%2C0.06l-0.01%2C0.28l-0.13%2C0.31l-0.11%2C-0.01l-0.05%2C0.17l-0.06%2C0.02l0.08%2C-0.38l0%2C-0.07l-0.06%2C-0.01l-0.03%2C0.18l-0.17%2C0.06l-0.02%2C0.25l0.1%2C0.11h0.1l0.2%2C-0.14l0.08%2C0.91l0.24%2C0.03l0.05%2C0.11l0.16%2C0.07l-0.05%2C0.43l-0.09%2C0.1l0.15%2C0.38l0.42%2C0.17l0.1%2C0.1l0.3%2C0.66l0.04%2C0.04l0.17%2C-0.04l0.15%2C0.08l0.04%2C0.27l1.35%2C0.31l0.07%2C0.14l0.03%2C0.31l0.15%2C0.06l0.13%2C-0.06l0.4%2C0.43h0.14l0.04%2C0.17l0.34%2C0.11l0.04%2C0.2l0.19%2C0.11l0.14%2C-0.01l0.07%2C0.08l0.44%2C0.07l0.09%2C0.14l0.16%2C0.03l0.06%2C0.22l0.46%2C0.01l0.16%2C-0.07l0.1%2C0.18l0.26%2C-0.04l0.15%2C0.06l0.4%2C0.61l0.19%2C0.04l0.16%2C0.15l-0.03%2C0.48l-0.05%2C0.1l-0.29%2C0.2l-0.06%2C0.18l0.11%2C0.22v0.33l0.29%2C0.33l0.13%2C0.33l-0.13%2C0.15l-0.14%2C-0.06v0.14l-0.13%2C-0.04l-0.15%2C0.07l-0.26%2C0.27l0.05%2C0.15l-0.07%2C0.1l-0.15%2C0.03l-0.16%2C0.2l0.1%2C0.14l-0.09%2C0.1l0.05%2C0.14l-0.1%2C0.29l0.11%2C0.1l0.14%2C0.07l0.04%2C0.47l-0.05%2C0.46l-0.03%2C0.17l0.06%2C0.96l-0.13%2C0.04l-0.06%2C0.11l0.04%2C0.45h0.09l0.1%2C0.11l-0.01%2C0.28l0.05%2C0.08l0.13%2C0.06l0.2%2C-0.03l0.14%2C0.03l-0.01%2C0.13l0.21%2C0.03l0.05%2C0.14l0.19%2C0.1l0.04%2C0.25l0.31%2C0.15h0.06l0.01%2C-0.07l0.24%2C0.01l0.05%2C0.11l0.12%2C0.08l0.11%2C0.06l0.16%2C-0.04l0.19%2C0.06l0.54%2C0.6l0.04%2C0.18l0.15%2C0.08l0.09%2C0.33l0.14%2C0.14l0.02%2C0.18l-0.09%2C0.14l0.07%2C0.13l-0.4%2C-0.18h-0.12l-0.31%2C0.28l-0.05%2C0.18l0.01%2C0.32l0.19%2C0.31l0.33%2C0.36l0.07%2C0.17l0.28%2C0.26l0.27%2C0.11l0.01%2C0.15l0.08%2C0.04l-0.08%2C0.26l-0.45%2C0.17l-0.07%2C0.13l0.31%2C0.26l0.29%2C0.08l0.09%2C-0.03l0.1%2C0.21l0.19%2C0.06l0.22%2C0.66l-0.22%2C0.08l0.04%2C0.03l0.22%2C0.03l0.55%2C1.67l0.23%2C0.06l0.39%2C0.58l0.26%2C0.14l0.33%2C0.82l-0.1%2C0.13l0.17%2C0.11l0.14%2C0.26l0.18%2C-0.1l-0.01%2C-0.14l0.11%2C-0.01l0.06%2C-0.15l0.26%2C-0.13l0.31%2C-0.08l0.29%2C0.07l-0.36%2C0.89l0.01%2C0.29l0.39%2C0.81l0.31%2C0.19l-0.01%2C0.33l-0.09%2C0.22l-0.19%2C0.13l-0.09%2C-0.06l-0.17%2C0.06l-0.17%2C-0.11l-0.1%2C0.03l-0.2%2C-0.29l-0.02%2C-0.17l-0.25%2C-0.08l-0.15%2C-0.28l-0.26%2C-0.04l-0.22%2C0.2l-0.35%2C0.83l-0.05%2C0.32l-0.29%2C0.14l-0.15%2C0.26l-0.02%2C0.17l0.09%2C0.4l0.05%2C0.1l0.13%2C0.04l0.06%2C0.28l-0.21%2C0.54l-0.34%2C0.22l-0.08%2C0.15l0.15%2C0.15l-0.04%2C0.38l0.22%2C0.64l0.2%2C0.1l0.13%2C0.21v0.07l-0.14%2C0.08l0.05%2C0.26l0.32%2C0.04l-0.3%2C0.32l-0.11%2C-0.03l-0.1%2C0.1l0.04%2C0.14l-0.04%2C0.15l-0.1%2C0.08v0.13l0.14%2C0.07l-0.07%2C0.15l-0.09%2C-0.13l-0.06%2C0.04l0.04%2C0.15l-0.16%2C0.28l0.07%2C0.49l-0.05%2C0.45l0.04%2C0.11l0.1%2C0.04l-0.04%2C0.24l-0.19%2C0.32l-0.01%2C0.29l-0.13%2C0.18l0.15%2C0.25l-0.03%2C0.28l0.17%2C0.21l0.15%2C0.07l0.06%2C0.31l0.06%2C0.13l0.07%2C0.1l0.49%2C0.15l0.22%2C0.17l0.39%2C0.08l-0.09%2C-0.19l0.05%2C-0.03l0.1%2C0.19l0.36%2C0.32l0.02%2C0.14l0.4%2C0.06l0.27%2C0.14v0.18l-0.01%2C0.13l0.2%2C0.15l0%2C0.14l0.15%2C0.1l0.4%2C0.08l0.04%2C0.14h0.1l0.13%2C0.17h0.09l-0.01%2C0.69l0.36%2C0.49l0.12%2C0.28l0.09%2C0.33l-0.11%2C0.15l0.22%2C0.01l0.09%2C0.11l-0.09%2C0.33l0.15%2C0.28l-0.11%2C0.06v0.07l0.19%2C-0.03l0.08%2C0.14l0.04%2C0.08l0.19%2C0.25l0.24%2C0.18l0.11%2C0.54l0.27%2C0.17l0.15%2C0.18l0.14%2C0.36l0.11%2C-0.01l0.02%2C0.13l0.07%2C0.07l-0.04%2C0.17l-0.2%2C0.07v0.07h0.2l0.07%2C0.07l-0.01%2C0.4l0.31%2C0.63l0.1%2C0.36l0.01%2C0.71l0.1%2C0.26l0.04%2C0.11l0.17%2C0.25l0.07%2C0.22l0.31%2C0.24l0.2%2C0.67l0.16%2C0.13l-0.08%2C0.15l0.16%2C0.3l0.09%2C0.49l0.74%2C0.46l0.02%2C0.11l0.11%2C0.04l0.01%2C0.08l-0.08%2C0.01l0.04%2C0.22l0.26%2C0.21l-0.01%2C0.24l0.06%2C0.15l0.55%2C0.6l0.06%2C0.29l0.26%2C0.17l0.03%2C0.28l0.22%2C0.29l0.34%2C0.11l0.26%2C0.41l0.14%2C0.07l0.16%2C0.4l0.16%2C0.14l0.05%2C0.37l0.17%2C0.37l-0.14%2C0.58l0.07%2C0.64l0.31%2C0.62l0.39%2C0.33l0.09%2C0.17l-0.02%2C0.08l0.09%2C0.14l-0.19%2C0.15l-0.03%2C0.11l0.27%2C0.17l0.01%2C0.11l0.09%2C0.01l0.11%2C0.25l0.2%2C1.41l0.77%2C1.29l0.21%2C0.18l0.15%2C0.65l0.06%2C0.07v0.23l0.42%2C0.29l0.17%2C0.29l0.29%2C0.15l0.13%2C0.24l0.09%2C0.61l0.19%2C0.28l0.36%2C0.3l0.2%2C0.04l0.11%2C0.11v0.13l0.09%2C0.1l-0.09%2C0.26l0.04%2C0.24l-0.08%2C-0.07l-0.1%2C0.01l-0.06%2C0.21l0.15%2C0.19l0.24%2C0.01l0.38%2C0.28l0.21%2C0.28l0.21%2C0.72l0.14%2C0.03l0.08%2C0.14l0.12%2C0.57l0.01%2C0.39l0.41%2C1.08l0.24%2C0.62l0.42%2C0.69l0.08%2C0.47l0.14%2C0.25l0.3%2C0.39l0.81%2C0.37l0.08%2C0.12l0.24%2C0.11l0.31%2C0.81l-0.26%2C0.12l0.19%2C0.1l0.05%2C0.18l0.36%2C-0.17l0.15%2C0.03l0.05%2C0.07l-0.05%2C0.1l0.09%2C0.07l-0.05%2C0.25l0.09%2C0.12l-0.03%2C0.08l0.2%2C-0.01l0.29%2C0.65l0.02%2C0.22l0.21%2C0.36l-0.06%2C0.43l0.09%2C0.63l0.15%2C0.1l0.08%2C0.21l0.2%2C0.21l-0.02%2C0.18l-0.24%2C-0.07l-0.11%2C0.1l0.03%2C0.13l0.19%2C-0.03l0.01%2C-0.05l0.09%2C0.03l0.27%2C0.87l0.11%2C0.14h0.16l0.1%2C0.22l-0.14%2C0.19h0.26l0.26%2C0.17l0.63%2C-0.03l0.49%2C0.34l0.25%2C0.51l0.03%2C0.23l0.27%2C0.58l0.16%2C0.21v0.25l0.15%2C0.23l-0.1%2C0.11l0.01%2C0.11l0.19%2C-0.15h0.11l0.44%2C0.55l0.35%2C0.06l0.11%2C0.14l0.17%2C0.08l0.33%2C0.55l0.36%2C0.32l0.19%2C0.03l0.15%2C0.14l0.06%2C0.12l-0.09%2C0.06l-0.01%2C0.14l0.25%2C0.23l-0.03%2C0.18l0.1%2C0.36l-0.24%2C0.26l-0.02%2C0.15l0.2%2C-0.1l0.14%2C0.04l0.29%2C0.77l0.47%2C0.14l0.05%2C0.21l-0.05%2C0.43l0.09%2C0.07l-0.19%2C0.28l-0.04%2C0.18l0.05%2C0.1l0.17%2C-0.01l0.01%2C0.32l0.19%2C0.15l0.46%2C0.17l0.06%2C0.08l-0.02%2C0.11l-0.11%2C0.08v0.18l0.04%2C0.21l0.15%2C0.25l0.07%2C0.54l0.16%2C0.15l-0.05%2C0.21l0.16%2C0.25h0.09l0.08%2C0.1l0.17%2C0.44l1.06%2C0.83l0.17%2C0.33l0.42%2C0.5l0.05%2C0.65l0.16%2C0.34l-0.01%2C0.45l-0.08%2C0.18l0.1%2C0.08l0.05%2C0.37l-0.09%2C0.15l0.01%2C0.05l0.1%2C0.1l0.13%2C0.43l0.27%2C0.3l-0.13%2C0.23l0.11%2C0.19l0.36%2C0.1l0.2%2C0.14l0.34%2C0.55l0.21%2C0.21l-0.04%2C0.34l0.14%2C0.3l-0.05%2C0.47l0.21%2C0.28l0.14%2C0.34l0.13%2C-0.03l0.1%2C0.07l0.06%2C0.29l-0.05%2C0.15l0.04%2C0.3l0.05%2C0.07h0.1l0.02%2C0.1l-0.02%2C0.07h-0.08l0.04%2C0.73l0.36%2C0.84l0.11%2C0.01l0.66%2C0.84l0.38%2C0.29l0.24%2C0.33l0.41%2C1.15l-0.06%2C0.01l-0.01%2C0.19l-0.13%2C0.21l0.21%2C0.03l0.09%2C0.4l0.12%2C0.03l-0.14%2C0.58l0.2%2C0.55l0.22%2C0.36l0.15%2C-0.01l0.11%2C0.07l0.79%2C0.93l0.66%2C1.04l0.04%2C0.32l0.21%2C0.21l-0.06%2C0.17l0.01%2C0.33l0.27%2C0.44l0.14%2C0.51l0.15%2C0.1l0.17%2C0.29l-0.01%2C0.11l-0.24%2C0.22l0.22%2C-0.11h0.15l0.17%2C0.23l0.11%2C0.33l0.3%2C0.21l0.21%2C0.29l0.15%2C0.05l0.36%2C0.34l0.02%2C0.16l0.2%2C0.22l0.25%2C0.59l-0.04%2C0.14l0.05%2C0.21l0.35%2C0.44l0.13%2C0.33l0.11%2C0.1l0.25%2C0.47l-0.01%2C0.42l0.34%2C0.67l-0.04%2C0.42l0.1%2C0.05l0.06%2C0.21l0.34%2C0.44l0.26%2C0.07l0.05%2C0.18l0.14%2C0.12l-0.05%2C0.11l0.14%2C0.19l0.01%2C0.29l0.51%2C0.86l0.06%2C0.59l0.4%2C0.34l0.1%2C0.36l0.2%2C0.27l0.57%2C0.45l0.01%2C0.42l0.12%2C0.42l-0.35%2C0.53l-0.17%2C0.47l0.02%2C0.23l0.15%2C0.11l-0.08%2C0.07v0.14l0.14%2C-0.04l0.06%2C0.29l0.09%2C0.01l0.04%2C0.12l0.06%2C0.01l0.08%2C0.16l0.22%2C0.15l0.32%2C0.3l0.1%2C0.21l0.14%2C-0.05l0.06%2C0.07l0.08%2C0.4l0.16%2C0.34l0.19%2C0.18l0.1%2C0.25l0.38%2C0.33l0.04%2C0.38l-0.11%2C0.22l0.11%2C0.44l-0.02%2C0.51l0.35%2C0.25l-0.08%2C0.97l0.1%2C0.71l0.21%2C0.14l0.1%2C0.27l0.17%2C0.12l0.01%2C0.08l0.41%2C0.45l0.5%2C0.3l0.11%2C0.16l0.36%2C0.27l0.27%2C0.4l0.1%2C0.41h0.19l0.11%2C0.1l0.46%2C0.6l0.06%2C0.18l0.06%2C0.05h0.22l0.17%2C0.42l0.2%2C0.23l0.02%2C0.31l0.42%2C1.03l-0.03%2C0.51l-0.1%2C0.3l-0.14%2C0.19l0.04%2C0.11l-0.13%2C0.44l0.09%2C0.05l-0.01%2C0.07l0.29%2C0.52l0.37%2C0.12l0.4%2C-0.03l0.11%2C0.11l-0.03%2C0.16l-0.22%2C0.12l-0.19%2C0.6l-0.01%2C0.26l0.05%2C0.31l0.3%2C0.11l0.04%2C0.15l0.51%2C0.52v0.12l-0.32%2C0.29l0.01%2C0.1l0.26%2C0.07l-0.08%2C-0.14l0.05%2C-0.1l0.59%2C0.02l0.2%2C0.23l0.11%2C0.71l0.32%2C0.64l0.16%2C0.07l0.17%2C0.22h0.13l0.14%2C0.14l0.24%2C0.08l0.15%2C0.16l0.02%2C0.3l-0.26%2C-0.05l-0.1%2C0.15l-0.33%2C0.08l-0.21%2C0.19l0.14%2C0.72l-0.19%2C0.3l-0.17%2C0.08l-0.21%2C0.22l-0.08%2C0.3l0.04%2C0.22l0.21%2C0.33l0.51%2C0.33l0.15%2C0.23l0.15%2C0.05l0.16%2C0.31l0.29%2C0.29l0.07%2C0.05l0.57%2C0.04l0.46%2C0.35l0.09%2C0.15v0.26l0.07%2C0.15l0.1%2C0.14l0.21%2C0.04l0.07%2C0.08v0.15l0.06%2C0.01l-0.17%2C0.27l-0.07%2C-0.01v0.07l0.29%2C0.22l0.06%2C0.27l0.21%2C0.18l0.24%2C0.46l0.11%2C0.46l0.46%2C0.65l0.59%2C0.44l0.64%2C0.14l0.05%2C0.41l0.17%2C0.27l0.41%2C0.22l0.13%2C0.14l0.5%2C0.16l0.09%2C0.16l0.3%2C0.18l0.25%2C-0.03l0.19%2C0.05l0.02%2C-0.08l-0.09%2C-0.01l0.02%2C-0.11l0.61%2C0.07l0.01%2C0.42l-0.05%2C0.01l0.19%2C0.26l0.11%2C0.49l0.16%2C0.04l0.06%2C0.16l0.16%2C0.03l0.35%2C0.48l0.15%2C0.09l0.06%2C0v-0.09l0.15%2C0.01l0.3%2C0.19l0.15%2C0.23l0.17%2C0.03l0.08%2C0.29l-0.11%2C0.04l0.29%2C0.53l0.72%2C0.79l0.15%2C0.26l0.11%2C0.04l0.57%2C0.78l0.5%2C0.84l0.08%2C0.73l0.3%2C0.1l0.05%2C0.16l0.11%2C0.11l-0.08%2C0.2l0.3%2C0.25v0.08l-0.19%2C0.12l-0.12%2C0.34l0.05%2C0.16l0.16%2C0.19l0.04%2C0.2l0.09%2C0.01l0.16%2C0.27l0.25%2C0.23l-0.01%2C0.08l0.24%2C0.45l0.25%2C0.14l0.11%2C0.2l0.17%2C0.04l0.08%2C0.23l0.25%2C0.19l0.04%2C0.11h0.14l0.13%2C0.11l0.04%2C0.15l0.3%2C0.14l0.19%2C0.12l0.03%2C0.14l0.15%2C0.03l0.24%2C0.18l0.02%2C0.07h-0.07l-0.11%2C0.16l0.13%2C0.27l-0.07%2C0.14l0.09%2C0.11v0.14l0.26%2C0.18l0.14%2C-0.04l0.25%2C0.04l0.22%2C-0.14l0.02%2C-0.22l-0.14%2C-0.12l-0.09%2C-0.42l-0.2%2C-0.11l-0.24%2C-0.25l-0.19%2C-0.11l-0.15%2C0.05l-0.13%2C-0.15l0.74%2C-0.14l0.26%2C0.37l0.14%2C0.07l0.04%2C0.18l0.16%2C0.05l0.26%2C0.31h0.11l0.15%2C0.18l0.69%2C0.01l0.31%2C0.3l0.19%2C-0.01l0.18%2C0.09l0.16%2C0.29l0.5%2C0.24l0.42%2C0.48l0.02%2C0.19l0.21%2C0.16l0.06%2C0.37l0.24%2C0.34l0.06%2C0.38l0.13%2C0.3l-0.03%2C0.48l0.1%2C0.27l-0.09%2C0.3l0.06%2C0.29l-0.13%2C0.14l0.01%2C0.2l0.11%2C0.07l0.5%2C0.07l0.46%2C0.31l0.15%2C0.01l0.16%2C0.2l0.19%2C-0.03l0.11%2C0.14l0.3%2C-0.01l0.41%2C-0.19l0.7%2C-0.03l0.39%2C0.22l0.39%2C-0.01l0.4%2C0.12l0.56%2C0.16l1.15%2C0.57l0.72%2C0.48l0.15%2C0.2l0.13%2C0.04l0.21%2C0.23l0.29%2C0.44l-0.06%2C0.15l0.21%2C0.25l0.06%2C0.23l-0.01%2C0.3l0.11%2C0.24l0.05%2C0.35l0.31%2C0.3l0.09%2C0.23l0.37%2C0.15l0.14%2C0.15v0.37l-0.1%2C0.3l-0.07%2C0.01l-0.15%2C-0.49l-0.21%2C-0.25l-0.19%2C-0.11l-0.49%2C-0.96l-0.3%2C-0.22l-0.47%2C-0.14l-0.29%2C-0.01l-0.11%2C0.14l-0.26%2C0.12l-0.05%2C0.09h-0.24l-0.22%2C-0.04l-0.27%2C0.22l-0.16%2C0.23l-0.55%2C0.23l-0.37%2C0.41l-0.16%2C0.03l-0.57%2C-0.1l-0.14%2C-0.22l-1.11%2C-0.43l-0.3%2C-0.29l-0.49%2C0.12l-0.99%2C0.08l-0.94%2C-0.27l-0.19%2C-0.16l-0.06%2C-0.18l-0.24%2C-0.07l0.01%2C-0.18l-0.18%2C-0.18l-0.07%2C-0.19l-0.17%2C-0.08l-0.04%2C-0.11l-0.16%2C-0.05l-0.6%2C0.11l-0.67%2C0.43l-0.5%2C0.22l-0.04%2C-0.05l0.06%2C-0.08l0.31%2C-0.16l0.15%2C-0.16l0.3%2C-0.08l0.44%2C-0.24l0.3%2C-0.04l0.09%2C-0.09l-0.09%2C-0.15l-0.22%2C-0.14l-0.19%2C-0.03l-0.21%2C-0.19l-0.44%2C-0.12l-0.16%2C0.01l-0.55%2C-0.27l-0.34%2C-0.04l-0.4%2C0.08l-0.23%2C0.18l0.05%2C0.2l-0.05%2C0.05l0.13%2C0.16l-0.09%2C0.11l0.01%2C0.14l-0.01%2C0.11l-0.03%2C0.14l0.19%2C0.04l0.03%2C0.26h-0.11l-0.21%2C-0.04l-0.07%2C0.3l0.04%2C0.05l-0.14%2C0.05l0.03%2C0.1l-0.09%2C0.18l-0.12%2C0.01l-0.03%2C0.15l-0.09%2C-0.04l-0.13%2C0.29l-0.13%2C-0.01l-0.13%2C-0.33l-0.13%2C0.11l0.09%2C0.11l-0.1%2C0.16l0.34%2C0.23l-0.04%2C0.18l-0.12%2C0.07l0.16%2C0.12l-0.04%2C0.16l0.14%2C-0.04l-0.01%2C0.11l-0.08%2C0.04l0.04%2C0.12v0.12l0.11%2C0.18l-0.13%2C0.18l0.06%2C0.38l-0.08%2C0.24l0.08%2C0.23l-0.08%2C0.04l-0.02%2C0.34l0.14%2C0.2l0.1%2C0.33l0.09%2C-0.01l0.01%2C-0.56l-0.1%2C-0.29l0.07%2C-0.05l0.08%2C0.07l0.04%2C0.23l0.03%2C0.52l-0.21%2C0.54l-0.06%2C0.03l-0.14%2C-0.12v0.3l-0.15%2C0.05v0.27l0.11%2C0.29v0.35l0.06%2C0.18l-0.05%2C0.14l0.05%2C0.11l-0.13%2C0.09l-0.03%2C0.12l-0.1%2C0.01l-0.13%2C0.37l-0.05%2C0.62l0.08%2C0.23l0.11%2C0.04l-0.11%2C0.27l0.25%2C0.15l0.08%2C0.19l-0.01%2C0.19l0.1%2C0.15l0.35%2C0.11l0.1%2C-0.1l-0.08%2C-0.16l0.08%2C-0.03l0.21%2C-0.56l0.22%2C-0.11l0.29%2C0.04l0.24%2C0.69l-0.1%2C0.34l0.02%2C0.41l-0.22%2C0.22l-0.13%2C0.01l-0.01%2C-0.28l0.09%2C-0.3l-0.11%2C-0.07l-0.24%2C0.03l-0.1%2C0.14l0.09%2C0.09l-0.51%2C-0.01l-0.11%2C0.12l0.01%2C0.12l0.15%2C0.22l0.25%2C0.08l0.01%2C0.12l0.34%2C0.16l-0.04%2C0.31l0.14%2C0.57l-0.03%2C0.16l0.16%2C0.37l-0.06%2C0.15l0.09%2C0.27l-0.06%2C0.35l0.03%2C0.6l0.14%2C-0.09l0.14%2C0.2l-0.22%2C0.76l-0.03%2C1.31l0.08%2C0.41l-0.32%2C0.01v-0.08l-0.19%2C-0.19l-0.16%2C-0.64l-0.2%2C0.07l-0.12%2C0.2l0.09%2C0.31l-0.11%2C0.18l0.08%2C0.04l0.04%2C0.14v0.33l0.11%2C0.09l0.09%2C-0.01l-0.01%2C-0.33l-0.06%2C-0.09l0.21%2C0.08l0.04%2C0.6l0.2%2C0.72l-0.06%2C0.26l0.09%2C0.1v0.2l0.29%2C0.2l0.01%2C0.13l-0.06%2C0.11l-0.15%2C1.18l-0.1%2C0.22v0.43l-0.16%2C0.3l0.04%2C0.11l0.11%2C-0.18l0.04%2C0.22l-0.5%2C0.91l0.01%2C0.26l-0.09%2C0.01v-0.24l-0.12%2C0.16l0.01%2C0.14l0.21%2C0.01l-0.08%2C0.26l-0.29%2C0.14l-0.09%2C-0.04l-0.01%2C0.07l0.16%2C0.41l0.08%2C-0.07l-0.06%2C-0.18l0.12%2C0.07l0.08%2C0.66l0.14%2C0.42l0.04%2C0.42l0.45%2C0.3l-0.05%2C0.08l0.22%2C0.16l-0.01%2C0.12l0.08%2C0.13l0.08%2C0.07l0.15%2C-0.01l0.17%2C0.37l0.34%2C0.43l0.29%2C0.24l0.05%2C0.28l0.33%2C0.79l-0.09%2C0.24l0.16%2C0.26l0.13%2C0.04l-0.08%2C0.24l0.09%2C0.19l0.03%2C0.34l0.1%2C0.03l-0.08%2C0.15l0.16%2C0.3l0.05%2C-0.2l0.11%2C0.16l0.06%2C0.37l-0.1%2C1.51l0.1%2C0.35l-0.11%2C0.08l-0.05%2C0.38l0.16%2C0.65l0.04%2C0.69l0.19%2C0.08l0.05%2C0.27l0.44%2C0.99l-0.15%2C0.69l0.01%2C0.24l0.14%2C0.34l-0.01%2C0.97l0.25%2C0.11l0.31%2C0.32l0.26%2C0.08l0.01%2C0.27l0.17%2C0.36l0.1%2C0.46l0.72%2C0.77l0.13%2C0.5l0.17%2C-0.01l-0.04%2C0.18l0.2%2C0.27l-16.2%2C15.3l0%2C0l-2.18%2C2.06l-10.54%2C-3.13l-1.18%2C-0.28l-11.66%2C27.08l-5.51%2C1.02l-1.01%2C0.11l-0.1%2C0.08l-1.37%2C0.25l-0.79%2C0.08l-0.33%2C0.11l-4.12%2C0.76l-0.97%2C0.12l-0.26%2C0.09l-9.41%2C1.76l-3.3%2C9.78l0%2C0l-41.37%2C-0.09l0%2C0l-28.08%2C0.09l-19.54%2C0.03l-0.9%2C-0.04l-2.85%2C0.07l-3.62%2C-0.17l-2.62%2C0.04l-0.51%2C-0.05l-15.54%2C-0.05l0.53%2C-2.3l0.65%2C-2.36l0%2C0l8.11%2C-2.75l2.75%2C-1.44l1.96%2C-1.96l1.44%2C-3.14l4.27%2C0.68l2.71%2C-1.17l1.39%2C-1.73l1.05%2C-1.96l1.18%2C-2.88l0.39%2C-2.36l1.18%2C-4.45l2.75%2C-0.65l2.11%2C1.33l1.46%2C1.9l2.35%2C2.28l0%2C0l3.44%2C1.52l2.94%2C-0.88l0%2C0l2.62%2C-0.79l3.14%2C-2.75l3.72%2C-2.45l2.73%2C-1.59l2.31%2C-2.58l1.18%2C-3.41l-0.26%2C-5.54l2.99%2C-1.64l0%2C0l3.16%2C-0.32l2.62%2C1.83l1.83%2C1.18l2.57%2C0.77l0%2C0l2.88%2C-0.43l1.46%2C1.92l2.76%2C2.94l2.71%2C0.4l1.19%2C-2.02l0%2C0l-0.21%2C-3.31l-2.23%2C-3.52l0%2C0l-3.32%2C-2.34l-1.02%2C-0.98l0%2C0l0%2C0l0%2C0l-3.02%2C-0.25l-2.48%2C-2.47l-0.98%2C-0.85l0.07%2C-1.2l1.31%2C-1.41l1.24%2C-2.05l1.11%2C-1.34l1.57%2C-1.63l1.05%2C-2.05l0.65%2C-2.19l0.78%2C-1.13l0.24%2C-1.37l-0.78%2C-1.46l-0.83%2C-1.91l0%2C0l0%2C0l0%2C0l-1.57%2C-0.36l-0.98%2C-3.4l-0.07%2C-2.34l0.39%2C-2.2l0.59%2C-0.99l0.72%2C-0.73l0%2C0l0%2C0l0%2C0l0.16%2C-1.84l0%2C0l0%2C0l0%2C0l-1.07%2C-0.41l-0.2%2C-4.53l-1.44%2C-1.63l-1.63%2C-0.92l-0.98%2C-1.78l-0.33%2C-1.42l-0.2%2C-1.85l-1.18%2C-2.13l-0.92%2C-1.14l-0.33%2C-2.99l-0.78%2C-1.85l0%2C-6.03l0%2C0l0%2C0l0%2C0l1.02%2C-3.55l0.13%2C-2.37l1.99%2C-2.97l3.19%2C-2.65l0.39%2C-4.01l-0.23%2C-1.56l-3.06%2C-5.11l-1.91%2C-4.52l-0.15%2C-9.58l0%2C0l0.09%2C0.21l-0.09%2C-0.21l0%2C0l-0.46%2C-3.34l-3.3%2C-5.5l0%2C0l0%2C0l0%2C0l-4.34%2C-3.02l-1.83%2C-1.77l-2.39%2C-1.49l0%2C0l-2.62%2C-2.38l0%2C0l-1.55%2C-2.46l-0.8%2C-2.53v-5.38l0.8%2C-1.83l1.72%2C-1.83l1.89%2C-3.1l5.77%2C-3.76l1.97%2C-3.15l1.74%2C-5.5l0%2C0l0.19%2C-1.09l-0.03%2C-3.62l0%2C0l-0.35%2C-3.43l0%2C0l0%2C0l0%2C0l-1.13%2C-2.48l-0.62%2C-2.18l-1.43%2C-2.29l-3.39%2C-2.29l-4.48%2C-0.96l-6.08%2C0.06l-2.47%2C0.83l-2.93%2C2.04l-2.07%2C1.53l-1.43%2C0.76l-1.69%2C0.12l0%2C0l-1.96%2C-0.88l0.19%2C-1.64l-0.34%2C-0.13l-2.05%2C-2.8l-1.04%2C-2.59l-1.81%2C-1.33l-4.03%2C-1.21l-2.73%2C-1.72l-0.81%2C-0.85l-1.16%2C-1.77l-1.21%2C-3.6l-0.43%2C-2.98l0%2C0l0%2C0l0%2C0l-1.64%2C-0.53l-0.98%2C-1.28l-0.46%2C-1.6l-2.01%2C-2.56l-5.82%2C-4.86l-2.58%2C-0.95l0%2C0l0%2C0l0%2C0l-0.5%2C-0.33l0%2C0l-0.52%2C-2.5l-1.49%2C-3.84l-2.3%2C-3.78l-1.4%2C-3.08l0%2C0l-1.29%2C-0.91l-2.56%2C-2.17l0%2C0l-2.84%2C-2.18l0%2C0l0%2C0l0%2C0l-1.37%2C-4.42l-1.34%2C-0.75l-2.09%2C-1.05l-1.15%2C-0.1l-3.89%2C-1.52l-1.39%2C-1.07l-3.4%2C-1.19l-0.94%2C-0.46l-1.48%2C-1.75l-0.61%2C-1.56l-0.58%2C-4.71l0.67%2C-3.39l0%2C0l0.37%2C-3.35l-0.25%2C-4.74l-1.12%2C-3.63l-0.5%2C-5.87l-3.35%2C-7.7l-0.62%2C-6.03l-0.12%2C-2.24l0.75%2C-2.81l1.24%2C-2.25l1.12%2C-1.83l1.17%2C-1.71l0.04%2C-2.48l0%2C0l0.07%2C-4.29l1.28%2C-3.71l0%2C0l0.46%2C-1.62l0%2C0l0%2C0l0%2C0l-3.73%2C-0.5l0%2C0l2.75%2C-0.89l0.62%2C-3.66l2.98%2C-5.08l2.11%2C-0.85l1.37%2C-2.12l0.87%2C-1.69l1.49%2C-2.12l2.23%2C-2.83l0.75%2C-0.71l0.12%2C-3.25l1.74%2C-1.42l0.12%2C-3.11l0.12%2C-1.42l0%2C0l2.7%2C2.52l2.04%2C2.11l3.12%2C4.75L370.4%2C429.06L370.4%2C429.06L370.4%2C429.06z%22%2F%3E%0A%09%09%3Cpath%20fill%3D%22white%22%20stroke%3D%22none%22%20id%3D%22EG-BH%22%20title%3D%22Al%20Bu%E1%B8%A9ayrah%22%20%20d%3D%22M319.82%2C303.34l0.1%2C0.17l-0.04%2C0.06l-0.3%2C-0.07l-0.13%2C0.09l-0.34%2C0.04l-0.08%2C0.07l-0.07%2C0.57l0.01%2C0.06l0.16%2C0.06l0.01%2C0.1h0.14l0.06%2C-0.09l-0.06%2C-0.1l0.16%2C-0.17l0.22%2C-0.03l0.41%2C0.23l0.06%2C0.1l0.16%2C0.01l0.01%2C-0.1l-0.13%2C-0.09l-0.05%2C-0.19l-0.16%2C-0.16l0.02%2C-0.06l0.45%2C0.51l0.39%2C0.1l0.04%2C-0.06l-0.11%2C-0.06l-0.01%2C-0.09l-0.25%2C-0.13l0.04%2C-0.13l-0.26%2C-0.22l-0.04%2C0.07l-0.06%2C-0.04l0.03%2C-0.09h0.06l0.32%2C0.07l0.03%2C0.12l0.5%2C-0.12l0.02%2C0.1l0.42%2C0.13l0.24%2C0.23l0.41%2C0.09l0.93%2C0.42l0.41%2C4.9l2.79%2C3.22l0%2C6.9l3.66%2C-0.35l5.37%2C5.06l0%2C0l-0.01%2C2.83l0.78%2C0.45l0.78%2C0.75l-0.13%2C2.63l0.84%2C0.3v2.63l-0.58%2C0.68l0.97%2C0.45l0.39%2C0.45l0.06%2C0.68l0.78%2C0.9l-0.52%2C0.9l-0.84%2C0.83v1.65l0.65%2C0.23l-0.13%2C1.65l-0.32%2C1.13l0.32%2C1.28l0.88%2C-0.11l0%2C0l-0.26%2C4.66l0.13%2C0.4l1.07%2C0.07l-0.46%2C1.82l1.18%2C0.88l-0.26%2C1.73l0.58%2C1.54l0.1%2C4.03l-0.08%2C1.85l0%2C0l0%2C0l0%2C0l-1.39%2C0.16l-0.14%2C1.82l0%2C0l-6.92%2C7.08l-2.66%2C0.35l-7.4%2C7.47l0%2C0l-4.74%2C6.53l-0.74%2C1.31l-0.75%2C0.45l-1.55%2C-3.11l0%2C0l-1.68%2C-1.06l-2.83%2C-0.55l-7.56%2C-5.6l-1.96%2C-0.96l-6.37%2C-5.04l-4.26%2C-0.14l0%2C0l-3.16%2C-1.54l-1.27%2C-2.03l0%2C0v-5.72l0%2C0l1.43%2C-4.22l1.42%2C-2.08l1.79%2C-0.26l0%2C0l0%2C0l0%2C0l3.9%2C-1.27l4.91%2C-2.33l5.06%2C-7.56l-5.62%2C-6.44l-2.28%2C-3.74l1.17%2C-2.09l0%2C0l0.7%2C-2.76l-2.3%2C-2.03l3.2%2C-2.64l0%2C0l4.56%2C-2.63l1.19%2C-3.14l1.11%2C-1.81l0.02%2C-2.23l0%2C0l0.41%2C0.16l1.09%2C0.17l0.09%2C0.17l0.82%2C-0.06l0.13%2C0.07l0.29%2C0.03l0.05%2C-0.13l0.15%2C-0.03l-0.08%2C0.09h0.14l0.07%2C0.12h0.1l0.06%2C-0.12l0.06%2C0.22l0.29%2C-0.13l0.33%2C-0.03l0.05%2C0.13l0.04%2C-0.2l0.7%2C-0.09l0.02%2C-0.07l1.1%2C-0.41l1.24%2C-0.67l0.21%2C-0.26l0.61%2C-0.41l1.04%2C-0.96l0.35%2C-0.41l0.06%2C-0.2l0.16%2C-0.06l0.04%2C-0.15l0.16%2C-0.13l0.04%2C-0.15l0.21%2C-0.22l0.29%2C-0.51l-0.01%2C-0.12l0.08%2C-0.03l0.08%2C-0.23l0.16%2C-0.2l0.11%2C-0.36l0.34%2C-0.64l0.05%2C-0.29l0.19%2C-0.32l0.27%2C-0.76v-0.15l0.1%2C-0.14l0.29%2C-1.09l0.14%2C-0.33l0.09%2C-0.07l-0.04%2C-0.09l0.1%2C-0.5l0.05%2C-0.16l0.14%2C-0.15l-0.03%2C-0.07l0.46%2C-0.48L319.82%2C303.34z%22%2F%3E%0A%09%09%3Cpath%20fill%3D%22white%22%20stroke%3D%22none%22%20id%3D%22EG-BNS%22%20title%3D%22Ban%C4%AB%20Suwayf%22%20%20d%3D%22M290.77%2C444.64L292.59%2C442.27L292.98%2C439.13L293.57%2C433.53L294.75%2C428.56L294.82%2C428.57L294.99%2C427.49L294.99%2C427.49L297.85%2C427.91L303.56%2C428.62L314.24%2C430.6L316.35%2C431.73L316.18%2C433.42L317.18%2C433.82L318.61%2C433.73L341.1%2C427.45L346.76%2C418.58L350.23%2C413.34L353.05%2C411.3L353.05%2C411.3L353.11%2C411.65L353.11%2C411.65L353.64%2C410.87L355.95%2C411.84L355.95%2C411.84L358.22%2C412.36L358.22%2C412.36L359.17%2C412.99L359.17%2C414.64L359.3%2C417.33L359.3%2C417.33L359.17%2C418.75L359.05%2C421.86L357.31%2C423.27L357.19%2C426.53L356.44%2C427.23L354.21%2C430.06L352.72%2C432.18L351.85%2C433.87L350.48%2C435.99L348.37%2C436.83L345.39%2C441.91L344.77%2C445.57L342.02%2C446.46L342.02%2C446.46L339.13%2C444.45L336.7%2C443.04L303.29%2C444.15L301.77%2C444.12L293.28%2C444.41z%22%2F%3E%0A%09%09%3Cpath%20fill%3D%22white%22%20stroke%3D%22none%22%20id%3D%22EG-C%22%20title%3D%22Al%20Q%C4%81hirah%22%20%20d%3D%22M386.73%2C367.68L386.88%2C371.24L386.88%2C371.24L388.11%2C375.5L388.76%2C380.38L390.04%2C388.97L390%2C393.32L387.81%2C418.79L387.03%2C433.03L387.03%2C433.03L385.8%2C433.03L379.32%2C431.45L374.84%2C429.69L370.4%2C429.06L367.16%2C426.72L364.04%2C421.96L362%2C419.85L359.3%2C417.33L359.3%2C417.33L359.17%2C414.64L359.17%2C412.99L358.22%2C412.36L358.22%2C412.36L357.69%2C412.24L357.69%2C412.24L357.48%2C410.72L357.66%2C409.24L357.96%2C408.49L358.72%2C407.95L359.02%2C407.28L359.08%2C405.66L359.37%2C405.05L359.9%2C404.24L359.9%2C402.42L360.02%2C400.39L360.2%2C399.25L360.97%2C398.64L361.08%2C397.69L361.08%2C396.68L360.02%2C395.73L359.9%2C393.77L359.96%2C393.02L361.18%2C392.88L361.22%2C392.12L361.32%2C384.44L358.67%2C383.53L358.5%2C381.71L357.57%2C380.07L358.48%2C379.36L358.32%2C373.61L358.32%2C373.61L360.25%2C373.81L360.25%2C373.81L362.11%2C372.12L366.51%2C370.35L371.02%2C370.05L371.02%2C370.05L375.61%2C370.05L378.76%2C368.15L385.05%2C363.75L385.05%2C363.75L385.06%2C364.04L385.34%2C364.14z%22%2F%3E%0A%09%09%3Cpath%20fill%3D%22white%22%20stroke%3D%22none%22%20id%3D%22EG-DK%22%20title%3D%22Ad%20Daqahl%C4%AByah%22%20%20d%3D%22M363.19%2C301.07L363.44%2C301.17L363.5%2C301.27L363.8%2C301.4L363.84%2C301.48L364.69%2C301.81L365.23%2C302.25L366.32%2C302.82L367.31%2C303.47L368.45%2C304L369.18%2C304.46L369.43%2C304.49L369.59%2C304.62L369.76%2C304.59L370.06%2C304.8L370.57%2C304.97L371.07%2C305.25L371.5%2C305.35L371.67%2C305.31L371.85%2C305.41L372.14%2C305.36L372.26%2C305.38L372.43%2C305.48L372.64%2C305.39L372.64%2C305.39L372.64%2C307.2L371.08%2C308.02L369.52%2C308.65L369.52%2C310.2L371.95%2C310.16L373.73%2C309.92L373.83%2C311.94L374.82%2C312.14L376.02%2C312.77L376.98%2C313.69L376.64%2C316.17L375.88%2C320.07L379.98%2C318.07L383.11%2C316.33L383.11%2C316.33L384.83%2C315.94L386.68%2C316.21L387.18%2C315.95L387.39%2C315.47L387.48%2C314.84L387.9%2C314.81L387.87%2C315.08L387.57%2C315.77L387.54%2C316.24L390.32%2C316.19L390.53%2C315.77L390.86%2C316.13L391.57%2C316.54L392.95%2C316.81L393.39%2C317.53L393.57%2C318.3L393.21%2C319.44L393.75%2C319.95L394.14%2C320.75L394.63%2C321.19L394.38%2C321.5L394.2%2C321.98L394.26%2C322.72L394.65%2C322.93L394.47%2C322.99L394.47%2C322.99L391.12%2C324.28L386.96%2C324.84L386.03%2C325.03L382.44%2C324.96L381.35%2C326.77L381.2%2C328.75L378.32%2C331.73L378.18%2C334.62L375.91%2C334.8L375.75%2C336.43L374.43%2C337.15L374.22%2C338.62L365.4%2C338.86L364.08%2C340.03L364.08%2C346.52L364.92%2C347.29L364%2C349.66L361.98%2C351.65L361.98%2C351.65L360.81%2C351.58L359.74%2C349.79L358.83%2C349.2L358.83%2C349.2L358.84%2C349.08L358.84%2C349.08L360.08%2C347.81L359.95%2C344.36L359.28%2C344.08L359.37%2C343.07L358.39%2C342.02L358.08%2C338.68L358.32%2C336.16L358.94%2C333.45L359.25%2C331.19L360.26%2C330.02L361.04%2C329.57L362.01%2C327.21L359.83%2C327.49L357.92%2C327.62L357.69%2C327.51L358.01%2C325.98L358.64%2C324.91L358.64%2C324.91L358.54%2C321.93L358.54%2C321.93L360.18%2C322.24L360.88%2C321.7L360.64%2C320L360.57%2C309.38L360.11%2C308.38L360.03%2C305.48L358.94%2C305.57L358.86%2C303.48L359.87%2C302.57L359.87%2C302.57L361.1%2C302.67L361.08%2C299.97L361.62%2C300.16L362.09%2C300.5L362.73%2C300.78z%22%2F%3E%0A%09%09%3Cpath%20fill%3D%22white%22%20stroke%3D%22none%22%20id%3D%22EG-DT%22%20title%3D%22Dumy%C4%81%C5%A3%22%20%20d%3D%22M391.52%2C305.92l0.29%2C0.26l0.04%2C0.22l0.51%2C0.89l0.54%2C0.39l0.36%2C0.42l0.09%2C0.01l0.21%2C0.25l0.4%2C0.26l0.21%2C0.26l0.3%2C0.16l0.24%2C0.29l0.36%2C0.2l0.21%2C0.22l0.31%2C0.15l0.06%2C0.1l0.38%2C0.17l0.21%2C0.2l0.13%2C-0.01l0.57%2C0.25l0.32%2C0.26l0.08%2C-0.01l0.31%2C0.23l0.16%2C0.03l0.44%2C0.32h0.13l0.15%2C0.19l0.47%2C0.28l0.05%2C0.13l0.29%2C0.13l0.04%2C0.09h0.09l0.2%2C0.22l0.11%2C0.06l0.1%2C-0.06l0.16%2C0.04l0.29%2C0.48l-0.66%2C0.11l-2.21%2C-1.4l-1.34%2C-0.66l-0.72%2C-0.54l-0.96%2C-0.9l-0.78%2C-0.63l-0.9%2C-0.42l-0.87%2C-0.24l-0.63%2C0.12l0.15%2C0.33l0.81%2C0.36l0.09%2C0.27l-0.48%2C-0.03l-0.57%2C-0.24l-0.48%2C-0.6l0.81%2C-0.72l0.09%2C-1.13l-0.54%2C0.03l0.09%2C-0.51L391.52%2C305.92zM387.33%2C303.15l0.15%2C0.75l-0.16%2C-0.09l-0.1%2C-0.23l-0.01%2C-0.34L387.33%2C303.15zM387.14%2C302.15l-0.1%2C0.1l-0.33%2C-0.31l-0.07%2C-0.15l0.08%2C-0.09l0.39%2C0.3L387.14%2C302.15zM388.38%2C302.21l0.12%2C0.44l0.21%2C0.29l-0.29%2C0.46l-0.36%2C-0.11l-0.09%2C-0.39l-0.27%2C-0.6l-0.49%2C-0.39l-0.09%2C-0.17l0.03%2C-0.17l0.22%2C-0.07l0.47%2C0.86l0.25%2C0.25l0.07%2C-0.07l-0.25%2C-0.44l-0.13%2C-0.68l0.05%2C-0.14l0.23%2C0.11l0.08%2C0.49L388.38%2C302.21zM388.62%2C301.15l0.29%2C0.1l0.05%2C0.09l0.14%2C0.01l0.08%2C0.1l0.29%2C0.15l0.04%2C0.08l0.17%2C0.06l0.74%2C0.89l0.41%2C0.36l0.67%2C0.41l0.16%2C0.25l0.15%2C0.33l0.1%2C0.64l-0.17%2C0.29l-0.16%2C0.06l0.16%2C-0.29l-0.02%2C-0.09h-0.1l0.11%2C-0.09l0.04%2C-0.22h-0.05l-0.05%2C0.16l-0.09%2C-0.01l0.09%2C-0.31l-0.19%2C-0.28h-0.08l-0.06%2C-0.33l-0.1%2C0.06l-0.05%2C-0.23l-0.08%2C-0.04l0.09%2C0.63l-0.06%2C0.58l0.01%2C-0.67l-0.17%2C-0.63l-0.04%2C0.06l0.11%2C0.32v0.2l-0.09%2C-0.01v-0.29l-0.16%2C-0.41l-0.16%2C-0.16l-0.2%2C-0.06l-0.21%2C-0.32l-0.16%2C0.06l0.04%2C0.25h0.05l0.04%2C0.19l0.08%2C0.07l0.1%2C0.45l0.14%2C0.28l0.08%2C0.44l0.17%2C0.22l0.06%2C0.2l0.13%2C0.09l0.06%2C0.31l0.13%2C-0.52l-0.05%2C0.54l0.11%2C0.32l0.22%2C0.32l-0.05%2C0.06l-0.4%2C-0.65l-0.25%2C-0.21l-0.16%2C-0.39l-0.25%2C-0.17l-0.31%2C-0.83l-0.4%2C-0.17l-0.15%2C-0.32l-0.03%2C-0.28l0.06%2C-0.13l-0.74%2C-0.77l-0.21%2C-0.1l-0.21%2C-0.43l-0.18%2C-0.18L388.62%2C301.15zM386.18%2C312.31l-0.46%2C0.49l0.13%2C-0.05L386.18%2C312.31l0.16%2C0.08l-0.46%2C0.6l-0.24%2C0.62l-0.14%2C0.05l-0.46%2C-0.17l-0.16%2C0.35l0.11%2C0.43l-0.08%2C0.31l-0.13%2C0.05l-0.41%2C-0.34l0%2C0.31l0.35%2C0.4l0.46%2C0.01l0.06%2C0.15l-0.14%2C0.1l-0.49%2C0.03l-0.06%2C0.25l0.05%2C0.2l0.29%2C0.17l-1.78%2C0.4l0%2C0l-3.13%2C1.74l-4.1%2C2.01l0.76%2C-3.91l0.34%2C-2.48l-0.96%2C-0.91l-1.2%2C-0.63l-0.99%2C-0.2l-0.1%2C-2.02l-1.78%2C0.24l-2.42%2C0.03v-1.54l1.56%2C-0.64l1.56%2C-0.82v-1.81l0%2C0l0.48%2C0.03l0.2%2C-0.07l0.15%2C0.04l1.95%2C-0.44l0.3%2C-0.01l0.15%2C-0.1l0.08%2C0.03l2.12%2C-0.61l0.46%2C-0.07l0.6%2C-0.23l0.41%2C-0.06l0.21%2C-0.12l0.34%2C-0.06l0.13%2C-0.1l0.6%2C-0.2l0.05%2C-0.07l0.09%2C0.01l0.16%2C-0.51l-0.1%2C0.92l-0.17%2C0.58l0.14%2C0.1l0.16%2C-0.09l0.52%2C0.6l0.15%2C0.04l0.01%2C-0.13l-0.26%2C-0.23l0.11%2C-0.41l-0.26%2C-0.07l-0.04%2C-0.1l-0.09%2C-0.03l-0.1%2C-0.32l0.13%2C-0.23l0.19%2C-0.07l-0.09%2C-0.33l0.05%2C0.1l0.3%2C-0.03l0.71%2C-0.41l0.86%2C-0.38l0.66%2C-0.52l0.74%2C-0.44l0.35%2C-0.35l0.09%2C0.03l0.05%2C0.14l0.13%2C0.03l0.54%2C0.09l0.24%2C-0.09l0.25%2C0.06l-0.42%2C0.13l-0.49%2C0.48l-0.2%2C0.72l0.25%2C0.04l0.29%2C-0.21l0.01%2C0.24l-0.34%2C0.62l0.34%2C0.4l0.04%2C0.32l0.46%2C0.5l-0.02%2C1.06l0.23%2C0.37l0.03%2C0.34l-0.17%2C-0.04l-0.24%2C-0.57l-0.85%2C-1l-0.33%2C0.06l-0.03%2C-0.44l0.07%2C-0.17l-0.08%2C-0.12l-0.26%2C0.16l-0.36%2C0.47l-0.08%2C0.86l0.05%2C0.17l0.87%2C-0.52l0.1%2C0.06l0.03%2C0.12l-0.1%2C0.16l0.41%2C0.05l0.13%2C0.32l-0.22%2C0.4l0.26%2C0.28l0.17%2C0.44l0.24%2C0l0.13%2C-0.08l0.52%2C0.07l-0.56%2C0.5l-0.41%2C-0.02l-0.71%2C-0.22l-0.23%2C0.4l0.18%2C0.42l-0.12%2C0.36l0.16%2C0.03l0.22%2C-0.15l0.09%2C0.19l-0.2%2C0.25l-0.71%2C0.1l-0.21%2C0.15l0.56%2C0.3l0.38%2C-0.07l0.1%2C0.43l0.55%2C0.18l0.22%2C0.16l0.34%2C0.09l0.29%2C-0.22l0.17%2C0.29l-0.17%2C0.19L386.18%2C312.31z%22%2F%3E%0A%09%09%3Cpath%20fill%3D%22white%22%20stroke%3D%22none%22%20id%3D%22EG-FYM%22%20title%3D%22Al%20Fayy%C5%ABm%22%20%20d%3D%22M294.99%2C427.49L301.33%2C420.28L303.44%2C419.28L310.39%2C411.07L311.88%2C410.93L318.08%2C403.83L321.81%2C402.84L325.78%2C400.28L329.75%2C397.58L331.37%2C397.3L333.88%2C395.79L335.33%2C394.55L335.46%2C393.46L349.46%2C393.33L349.28%2C394.73L349.18%2C397.51L349.95%2C398.47L351.28%2C401.27L352.05%2C406.3L352.81%2C409.73L352.81%2C409.73L353.05%2C411.3L353.05%2C411.3L350.23%2C413.34L346.76%2C418.58L341.1%2C427.45L318.61%2C433.73L317.18%2C433.82L316.18%2C433.42L316.35%2C431.73L314.24%2C430.6L303.56%2C428.62L297.85%2C427.91z%22%2F%3E%0A%09%09%3Cpath%20fill%3D%22white%22%20stroke%3D%22none%22%20id%3D%22EG-GH%22%20title%3D%22Al%20Gharb%C4%AByah%22%20%20d%3D%22M351.91%2C346.29L351.44%2C345.08L347.01%2C345.13L346.63%2C344.32L345.47%2C344.27L345.4%2C343.37L342.98%2C343.37L342.83%2C344.36L339.31%2C344.8L339.31%2C344.8L338.43%2C344.91L338.1%2C343.64L338.43%2C342.51L338.55%2C340.86L337.91%2C340.63L337.91%2C338.98L338.75%2C338.15L339.27%2C337.25L338.49%2C336.35L338.43%2C335.67L338.04%2C335.22L337.06%2C334.77L337.65%2C334.09L337.65%2C331.46L336.8%2C331.16L336.93%2C328.53L336.16%2C327.77L335.38%2C327.32L335.39%2C324.5L335.39%2C324.5L335.95%2C325.02L337.87%2C328.51L339.1%2C328.52L339.1%2C328.52L339.4%2C329.57L344.07%2C329.57L344.23%2C328.56L344.46%2C327.67L349.68%2C327.76L349.68%2C322.15L350.63%2C322.22L355.83%2C321.79L355.83%2C321.79L357.33%2C321.86L358.54%2C321.83L358.64%2C324.91L358.64%2C324.91L358.01%2C325.98L357.69%2C327.51L357.92%2C327.62L359.83%2C327.49L362.01%2C327.21L361.04%2C329.57L360.26%2C330.02L359.25%2C331.19L358.94%2C333.45L358.32%2C336.16L358.08%2C338.68L358.39%2C342.02L359.37%2C343.07L359.28%2C344.08L359.95%2C344.36L360.08%2C347.81L358.84%2C349.08L358.84%2C349.08L355.06%2C347.34L355.06%2C347.34L351.97%2C347.32L351.91%2C346.29L351.91%2C346.29z%22%2F%3E%0A%09%09%3Cpath%20fill%3D%22white%22%20stroke%3D%22none%22%20id%3D%22EG-GZ%22%20title%3D%22Al%20J%C4%ABzah%22%20%20d%3D%22M358.32%2C373.61L358.48%2C379.36L357.57%2C380.07L358.5%2C381.71L358.67%2C383.53L361.32%2C384.44L361.22%2C392.12L361.18%2C392.88L359.96%2C393.02L359.9%2C393.77L360.02%2C395.73L361.08%2C396.68L361.08%2C397.69L360.97%2C398.64L360.2%2C399.25L360.02%2C400.39L359.9%2C402.42L359.9%2C404.24L359.37%2C405.05L359.08%2C405.66L359.02%2C407.28L358.72%2C407.95L357.96%2C408.49L357.66%2C409.24L357.48%2C410.72L357.69%2C412.24L357.69%2C412.24L355.95%2C411.84L355.95%2C411.84L353.64%2C410.87L353.11%2C411.65L353.11%2C411.65L352.81%2C409.73L352.81%2C409.73L352.05%2C406.3L351.28%2C401.27L349.95%2C398.47L349.18%2C397.51L349.28%2C394.73L349.46%2C393.33L335.46%2C393.46L335.33%2C394.55L333.88%2C395.79L331.37%2C397.3L329.75%2C397.58L325.78%2C400.28L321.81%2C402.84L318.08%2C403.83L311.88%2C410.93L310.39%2C411.07L303.44%2C419.28L301.33%2C420.28L294.99%2C427.49L294.99%2C427.49L294.82%2C428.57L294.75%2C428.56L293.57%2C433.53L292.98%2C439.13L292.59%2C442.27L290.77%2C444.64L290.77%2C444.64L289.63%2C448.98L288.05%2C451.88L286.87%2C455.23L285.29%2C460.59L284.11%2C466.16L281.74%2C468.39L279.18%2C470.4L274.45%2C473.51L270.7%2C476.85L268.14%2C477.52L265.57%2C479.52L261.83%2C480.85L257.69%2C483.96L254.53%2C485.51L249.21%2C486.63L247.63%2C487.51L246.05%2C488.62L245.27%2C490.4L244.87%2C492.62L244.28%2C494.39L243.29%2C496.6L241.91%2C499.36L241.91%2C499.36L185.13%2C499.5L185.13%2C499.5L184.45%2C499.5L184.45%2C499.5L183.17%2C499.5L183.17%2C499.5L203.56%2C454.07L245.45%2C444.01L277.73%2C412.26L284.19%2C403.97L290.81%2C402.34L313.49%2C387.34L316.56%2C386.94L316.56%2C386.94L317.32%2C386.49L318.05%2C385.18L322.79%2C378.66L323.68%2C378.7L322.79%2C378.66L322.79%2C378.66L330.19%2C371.19L332.85%2C370.84L339.77%2C363.76L339.77%2C363.76L341.21%2C363.64L341.89%2C363.06L343.98%2C363.2L344.07%2C366.38L345.49%2C366.31L346.4%2C367.2L346.47%2C369L347.37%2C369.89L349%2C370.19L349.8%2C369.29L350.69%2C369.81L350.69%2C369.81L351.45%2C370L353.4%2C369.34L353.4%2C369.26L353.4%2C369.26L355.05%2C372.04L357.46%2C373.52L357.46%2C373.52z%22%2F%3E%0A%09%09%3Cpath%20fill%3D%22white%22%20stroke%3D%22none%22%20id%3D%22EG-IS%22%20title%3D%22Al%20Ism%C4%81%D9%B0%C4%ABl%C4%AByah%22%20%20d%3D%22M401.37%2C322.91l0.06%2C0.2l2.68%2C-0.49l0.72%2C-0.76l0.99%2C0.19l0.56%2C1.61l2.2%2C0.17l1.94%2C0.97l3.19%2C1.16l0%2C0l3%2C1.94l3.08%2C0.81l0%2C0l0.24%2C6.82l1.05%2C17.58l3.21%2C5.05l1.67%2C2.97l1.41%2C3.85l0.77%2C2.79l0%2C0l-5.74%2C-0.27l0%2C0l-4.61%2C0.52l-1.73%2C1.41l-6.14%2C-0.43l-2.64%2C-0.81l-18.62%2C0.11l-1.91%2C0.18l0%2C0l-0.03%2C-0.79l0%2C0l-1.38%2C-3.54l-0.28%2C-0.1l-0.02%2C-0.29l0%2C0l-1%2C-4.9l-0.42%2C-4.56l-1.68%2C-0.87l-0.17%2C-1.65l2.27%2C0.1l0.42%2C0.87l3.78%2C0.19l0.59%2C-0.87l5.04%2C-0.29l0.26%2C-0.94l4.74%2C-6.74l-0.08%2C-2.71l-0.91%2C-3.85l1.81%2C-4.11l0.23%2C-1.84l1.7%2C-0.05l-0.2%2C-5.64l-1.96%2C-0.09l-0.67%2C-1.21l0%2C0l-0.67%2C-0.86l-0.04%2C-0.29l0.29%2C-0.3l0.77%2C-0.4l-0.03%2C-0.31l-0.23%2C-0.25l0.03%2C-0.5l1.28%2C-0.01l-0.01%2C-1.85l0.4%2C-0.5l0.48%2C-0.04l0.23%2C0.39l0.03%2C0.68l0.14%2C0.43l-0.28%2C0.44l0.05%2C0.2l0.4%2C0.05l0.16%2C0.19l-0.08%2C0.6L401.37%2C322.91zM403.36%2C316.23l0.38%2C0.49l0.57%2C-0.33l-0.03%2C0.3l0.18%2C0.26l0.32%2C1.14l-0.14%2C0.37l-0.31%2C-0.18l-0.44%2C-0.06l-0.53%2C-0.38l-0.26%2C-0.06l-0.16%2C0.42l-0.42%2C0.28l-0.37%2C-0.44l-0.47%2C0.08l-0.52%2C-0.23l-0.56%2C0.27l-0.68%2C0.06l-0.31%2C-0.23l-0.13%2C-0.37l-0.53%2C-0.49l0.08%2C-0.35l0.48%2C0.08l0.02%2C-0.44l0.4%2C-0.15l1.93%2C0.05l0.39%2C0.3l0.43%2C-0.26L403.36%2C316.23zM401.91%2C313.58l0.06%2C0.09l0.15%2C0.04l0.56%2C0.09l0.36%2C0.13l0.37%2C0.03l0.27%2C0.16l0.64%2C0.01l0.4%2C0.17l0%2C0l-0.32%2C0.37l0%2C0l-0.53%2C-0.22l-1.01%2C-0.22l-1.1%2C-0.62L401.91%2C313.58z%22%2F%3E%0A%09%09%3Cpath%20fill%3D%22white%22%20stroke%3D%22none%22%20id%3D%22EG-JS%22%20title%3D%22Jan%C5%ABb%20S%C4%ABn%C4%81'%22%20%20d%3D%22M520.63%2C408.1l0.02%2C0.11l-0.08%2C0.06l-0.04%2C-0.14L520.63%2C408.1zM430.72%2C385.01l1.87%2C0.07l0.24%2C-0.28l0.02%2C0.12l6.61%2C-0.43l9.77%2C0.29l8.36%2C1.18l1.02%2C0.29l4.26%2C-0.07l8.2%2C1.92l1.77%2C0.86l0.05%2C0.11l7.97%2C5.01l3.34%2C2.21l3.6%2C1.18l3.86%2C0.88l6.04%2C3.68l0.08%2C-0.03l0.91%2C0.28l2.63%2C0.88l2.62%2C1.07l1.43%2C-0.12l0.31%2C0.27l3.86%2C0.59l3.47%2C0.29l3.73%2C0.73l3.74%2C-0.15l2.39%2C0.58l0%2C0l-0.31%2C0.33l-0.2%2C0.1l-0.2%2C-0.07h-0.3l-0.45%2C0.26l-0.39%2C0.13l-0.16%2C0.4l-0.33%2C0.16l-0.06%2C0.38l-0.11%2C0.17l0.06%2C0.37l-0.16%2C0.47l-0.5%2C0.63l-0.25%2C0.03l-0.09%2C0.16l-0.26%2C-0.14l0.2%2C0.27l0.02%2C0.18l-0.15%2C0.11l-0.25%2C0.07l-0.15%2C0.13v0.07l-0.09%2C0.01l-0.01%2C0.16h-0.09l-0.04%2C0.3l0.09%2C0.3l-0.14%2C-0.01l-0.08%2C-0.08l-0.2%2C0.06l0.1%2C0.54l-0.06%2C0.31l-0.21%2C0.23l-0.09%2C0.21l-0.12%2C0.04l-0.3%2C-0.04l-0.2%2C0.07l-0.12%2C0.2l-0.08%2C0.17v0.31l-0.1%2C0.13l0.03%2C0.43l-0.15%2C0.34l-0.17%2C0.11l0.01%2C0.04l0.15%2C-0.03l-0.1%2C0.08l-0.2%2C-0.03l-0.39%2C0.1l-0.19%2C0.3l-0.04%2C0.18l-0.22%2C0.14l-0.06%2C0.44l-0.42%2C0.19l-0.06%2C0.1l0.01%2C0.41l0.19%2C0.37l-0.01%2C0.23l-0.21%2C0.43l0.08%2C0.85l-0.11%2C0.26l-0.3%2C0.28l-0.03%2C0.13l0.1%2C0.21l0.08%2C0.65l0.09%2C0.09l0.09%2C0.34l-0.05%2C0.17l0.06%2C0.26l-0.09%2C0.07l-0.04%2C0.27l0.06%2C0.13l-0.06%2C0.11l-0.1%2C0.03l-0.1%2C0.5l-0.17%2C0.28l-0.38%2C0.27l-0.16%2C0.77l-0.76%2C0.13l-0.24%2C0.13l-0.17%2C0.21l-0.09%2C0.4l0.1%2C0.18l0.01%2C0.2l-0.13%2C0.23l0.04%2C0.18l-0.15%2C0.24l0%2C0.21l-0.11%2C0.1l0.1%2C0.24l-0.17%2C0.11l-0.17%2C0.64l-0.17%2C0.16l0.25%2C0.41v0.1l-0.06%2C0.27l-0.17%2C0.16l-0.02%2C0.13l-0.09%2C0.07v0.18l-0.1%2C0.11l0.04%2C0.26l-0.08%2C0.06v0.1l0.14%2C0.28l0.02%2C0.36l-0.14%2C0.28l-0.27%2C0.28l-0.04%2C0.2l0.05%2C0.06l-0.08%2C0.01l0.04%2C0.07l0.09%2C-0.06L512%2C430l0.13%2C0.06l0.01%2C0.08l0.07%2C-0.01l-0.02%2C0.16l0.1%2C0.04l0.01%2C0.13l-0.05%2C0.27l0.46%2C0.47l0.04%2C0.41l0.05%2C0.06l-0.09%2C0.2l0.09%2C0.95l-0.2%2C0.23l-0.61%2C0.17v0.16l-0.24%2C-0.07l-0.44%2C0.13l-0.19%2C0.36l-0.35%2C0.2l0.03%2C0.17l-0.13%2C0.31l0.05%2C0.5l0.35%2C0.4l0.01%2C0.31l-0.25%2C0.26l0.09%2C0.43l0.13%2C0.24l-0.05%2C0.26l0.14%2C0.4l-0.1%2C0.2l0.02%2C0.31l-0.16%2C0.27l0.1%2C0.16l-0.07%2C0.23l0.14%2C0.35l0.01%2C0.27l-0.14%2C0.26l-0.6%2C0.14l-0.16%2C0.27l-0.27%2C0.24l-0.05%2C0.18l-0.03%2C0.48l0.16%2C0.34l-0.13%2C0.33l0.21%2C0.23l-0.08%2C0.35l0.05%2C0.18l-0.05%2C0.45l0.06%2C0.07l-0.06%2C0.3l0.05%2C0.13l-0.08%2C0.31l0.16%2C0.38l0.01%2C0.2l-0.07%2C0.2l-0.09%2C0.04l-0.03%2C0.23l-0.12%2C0.11l0.02%2C0.4l-0.05%2C0.11l0.24%2C0.41l0.08%2C0.28l-0.2%2C0.21l-0.25%2C0.68l-0.17%2C0.18v0.14l-0.21%2C0.3l-0.07%2C0.33l-0.27%2C0.27l-0.08%2C0.25l-0.27%2C0.23l-0.11%2C0.27l-0.28%2C0.2l0.11%2C0.33l-0.04%2C0.21l-0.14%2C0.14l-0.28%2C0.11l-0.09%2C0.13l-0.03%2C0.24l0.24%2C0.27l0.01%2C0.18l-0.11%2C-0.03l-0.15%2C0.3l-0.01%2C0.2l0.09%2C0.28l-0.24%2C0.07l-0.17%2C0.21h-0.14l-0.13%2C0.08l-0.09%2C0.24l-0.28%2C0.06l-0.22%2C0.67l-0.06%2C0.04l-0.05%2C0.88l-0.22%2C0.31l-0.17%2C0.08l-0.04%2C0.14l-0.16%2C0.1l-0.27%2C0.44l-0.31%2C0.3l-0.05%2C0.31l-0.09%2C0.11l-0.02%2C0.69l-0.13%2C0.72l0.32%2C0.47l0.08%2C0.41l-0.17%2C0.1l0.01%2C0.23l-0.19%2C0.69l-0.25%2C0.45l-0.41%2C-0.14l0.29%2C-0.03l0.05%2C-0.06l-0.04%2C-0.16l-0.2%2C0.06l-0.14%2C-0.13h-0.2l-0.38%2C0.13l-0.07%2C0.34l-0.22%2C0.13l-0.05%2C0.24l-0.1%2C0.03l-0.15%2C0.28l-0.01%2C0.48l-0.09%2C0.24l-0.25%2C0.21l-0.22%2C0.03l-0.13%2C0.16l-0.04%2C0.42l0.11%2C0.2v0.17l-0.27%2C0.54l-0.06%2C0.48l-0.17%2C0.23v0.47l0.09%2C0.13l0.01%2C0.17l-0.06%2C0.2l-0.21%2C0.25l-0.08%2C0.39l0.03%2C0.21l-0.21%2C0.2l-0.29%2C0.13l-0.11%2C0.27l-0.19%2C0.08l-0.09%2C0.11l-0.1%2C0.52l-0.31%2C0.38l-0.13%2C0.28l0.11%2C0.28l-0.13%2C0.14l-0.04%2C0.41l0.07%2C0.11l-0.15%2C0.41l0.08%2C0.18v0.97l0.07%2C0.18v0.32l0.14%2C0.18l0.14%2C0.44l-0.05%2C0.3l-0.17%2C0.24l0.01%2C0.39l0.13%2C0.42l0.27%2C0.45l-0.1%2C0.2l0.14%2C0.1l0.04%2C-0.1l0.1%2C-0.01l0.21%2C0.18l-0.19%2C0.07l-0.06%2C0.27l0.31%2C0.11l0.17%2C0.21l0.03%2C-0.24l0.39%2C0.45l-0.06%2C0.16h0.2l0.16%2C0.59l-0.03%2C0.66l-0.06%2C0.17l0.05%2C0.31l-0.06%2C0.13l-0.21%2C0.11l-0.01%2C0.16l-0.14%2C0.18v0.2l0.09%2C0.21l-0.02%2C0.27l0.1%2C0.11l-0.09%2C0.31l0.06%2C0.13l-0.09%2C0.16l-0.14%2C0.06l-0.04%2C0.25l0.01%2C0.2l-0.05%2C0.13l-0.04%2C0.37l-0.19%2C0.17l-0.01%2C0.13l-0.16%2C0.16l0.06%2C0.56l0.09%2C0.1v0.11l0.22%2C0.11l0.19%2C0.24l0.01%2C0.27l-0.11%2C0.31l-0.04%2C0.59l0.22%2C0.31l0.04%2C0.2l-0.46%2C2.12l-0.32%2C0.14l-0.09%2C0.28l0.16%2C0.2l-0.07%2C0.14l-0.14%2C0.03l-0.01%2C0.1l-0.24%2C0.27l-0.19%2C-0.01l-0.19%2C0.13h-0.39l-0.09%2C0.14l0.01%2C0.11l-0.14%2C0.08l-0.06%2C0.14l-0.39%2C0.04l-0.01%2C0.27l0.09%2C0.34l-0.14%2C0.07l-0.06%2C0.16l-0.14%2C0.08l-0.17%2C0.07l-0.22%2C-0.01l-0.08%2C0.07l-0.09%2C0.14l0.1%2C0.21l-0.01%2C0.22l-0.13%2C0.21l-0.23%2C0.07l-0.17%2C-0.13h-0.11l-0.26%2C0.15l-0.03%2C0.17l-0.07%2C0.07l-0.19%2C-0.04l-0.19%2C-0.15l-0.23%2C-0.04l-0.24%2C0.11l-0.02%2C0.11l0.17%2C0.16l-0.2%2C0.63l0.03%2C0.22l0.11%2C0.2l-0.39%2C0.21l-0.05%2C0.22l0.14%2C0.2l0.06%2C0.28l-0.22%2C0.23l-0.15%2C0.79l-0.28%2C-0.11h-0.09l-0.1%2C0.13l-0.14%2C-0.01l-0.17%2C-0.21l-0.13%2C-0.52l-0.19%2C-0.07l-0.14%2C0.1l0.03%2C0.14h0.16l0.05%2C0.08l-0.16%2C0.14l-0.1%2C0.27l-0.12%2C-0.07l0.06%2C-0.28l-0.09%2C-0.08l-0.11%2C0.13l-0.44%2C0.07l0.06%2C0.27l0.1%2C0.04l0.02%2C0.44l-0.24%2C0.36l-0.08%2C0.28l-0.31%2C0.07l0.01%2C0.11l0.13%2C-0.01l0.09%2C0.1l0.03%2C0.24l-0.2%2C0.2l-0.09%2C0.6l-0.19%2C0.46l-0.17%2C0.04l-0.26%2C0.01l-0.37%2C0.18l-0.24%2C-0.41l-0.09%2C-0.01l-0.24%2C0.24l-0.16%2C0.07l-0.29%2C-0.14l-0.17%2C-0.21l-0.06%2C0.04l0.01%2C0.18l-0.16%2C0.06l-0.15%2C-0.03l-0.03%2C0.28l0.1%2C0.27l0.33%2C0.32l0.06%2C0.24l0.22%2C0.18l0.11%2C0.01l0.1%2C-0.1l0.61%2C0.1l0.27%2C-0.15l0.46%2C0.07l-0.06%2C0.18l-0.12%2C0.1l0.07%2C0.21l-0.06%2C0.11l0.15%2C0.27l0.06%2C0.52l0.2%2C0.37l-0.05%2C0.07l-0.08%2C0.13l-0.17%2C-0.01l-0.31%2C-0.44l-0.03%2C0.21l0.2%2C0.11l0.06%2C0.2l-0.13%2C0.14h-0.14l-0.24%2C-0.15l0.05%2C-0.32l-0.1%2C-0.15l0.01%2C-0.11l-0.19%2C-0.06l-0.36%2C-0.31l-0.27%2C-0.32l-0.21%2C-0.45l-0.19%2C-0.15l-0.06%2C-0.24l-0.31%2C-0.27l-0.08%2C-0.21l-0.14%2C-0.1h-0.2l-0.11%2C-0.17l-1.14%2C-0.32l-0.25%2C0.13l-0.03%2C0.13l-0.61%2C-0.32l-0.21%2C-0.01l-0.25%2C-0.21l-0.35%2C0.03l-0.6%2C-0.11l-0.63%2C0.07l-0.47%2C0.34l-0.13%2C-0.38l-0.49%2C-0.16l-0.14%2C-0.14l-0.26%2C-0.01l-0.71%2C-0.42l-0.05%2C-0.1l-0.29%2C-0.15l-0.16%2C-0.42l-0.16%2C-0.2l-0.4%2C-0.27l-0.21%2C-0.42l-0.22%2C-0.1l-0.07%2C-0.14l-0.16%2C-0.03l-0.26%2C-0.22l-0.01%2C-0.14l-0.31%2C-0.48l-0.17%2C-0.08l-0.17%2C-0.22l-0.08%2C-0.22L481.5%2C489l-0.14%2C-0.41l-0.94%2C-0.13l-0.05%2C-0.21l-0.1%2C-0.03l-0.46%2C-0.04l-0.04%2C0.13l-0.06%2C-0.01v-0.14l-0.2%2C-0.35l-0.62%2C-0.65l-0.5%2C-0.63l-0.01%2C-0.32l-0.22%2C-0.24l-0.35%2C-0.1l-0.66%2C0.31l-0.41%2C-0.13l-0.15%2C0.06l-0.05%2C0.13l-0.19%2C-0.07l-0.1%2C-0.32l-0.21%2C-0.21l-0.19%2C-0.35l-0.27%2C-0.32l-0.67%2C-0.29l-0.49%2C-0.34l-0.19%2C-0.06l-0.11%2C-0.13l-0.17%2C-0.01l-0.46%2C-0.77l-0.14%2C0.01l-0.11%2C-0.1l-0.1%2C0.01l-0.02%2C-0.29l-0.56%2C-0.72l-0.31%2C-0.06l-0.14%2C0.07l-0.06%2C-0.17l-0.6%2C-0.31l-0.16%2C-0.01l-0.1%2C-0.42l0.32%2C-0.49l-0.16%2C-0.24l-0.14%2C-0.38l-0.06%2C-0.06l-0.2%2C0.01l-0.21%2C-0.14l-0.26%2C0.06v-0.2l-0.36%2C-0.17l-0.1%2C-0.1l-0.11%2C-0.14l-0.36%2C-0.23l-0.44%2C0.08l-0.19%2C-0.32l0.19%2C-0.29l-0.01%2C-0.15l-0.15%2C-0.18l-0.01%2C-0.18l-0.25%2C-0.17l-0.22%2C-0.34l-0.3%2C-0.29l-0.1%2C-0.31l-0.21%2C-0.22l-0.13%2C-0.56l-0.11%2C-0.14l-0.31%2C-0.08l-0.14%2C-0.11l-0.09%2C-0.76l0.04%2C-0.49l-0.13%2C-0.28l-0.19%2C-0.11l-0.47%2C-0.03l-0.13%2C0.25l-0.02%2C-0.39l-0.29%2C-0.04l-0.17%2C-0.1l-0.29%2C-0.2l-0.21%2C-0.28l-0.06%2C-0.37l0.04%2C-1.01l-0.11%2C-0.52l-0.01%2C-0.41l-0.26%2C-0.3l-0.04%2C-0.16l-0.21%2C-0.17h-0.1l-0.17%2C0.07l0.13%2C0.25l-0.01%2C0.08h-0.08l-0.34%2C-0.34l-0.11%2C-0.2l-0.19%2C-0.16l0.04%2C-0.39l-0.26%2C-0.1l-0.05%2C-0.15v-0.58l-0.47%2C-0.16l-0.1%2C-0.44l-0.31%2C-0.69l-0.29%2C-0.14l-0.49%2C-0.06L461%2C466.9l-0.52%2C-0.14l-0.24%2C-0.14l-0.27%2C-0.04l-0.35%2C-0.18l-0.31%2C-0.34l-0.26%2C-0.41l-0.31%2C-0.21l-0.31%2C-0.1l-0.08%2C-0.17l-0.54%2C-0.14l-0.11%2C-0.16l-0.24%2C-0.16l-0.24%2C-0.04l-0.74%2C-0.4l-0.01%2C-0.13l-0.13%2C-0.07l-0.06%2C-0.17l-0.17%2C-0.14l-0.11%2C-0.07l-0.25%2C-0.21l0.01%2C-0.1l-0.1%2C-0.18l-0.31%2C-0.23l-0.14%2C0.04l-0.16%2C-0.66l-0.2%2C-0.04l-0.01%2C-0.18l-0.17%2C-0.07l-0.54%2C-0.54l-0.3%2C-0.42l-0.08%2C-0.25l-0.2%2C-0.28l0.04%2C-0.55l-0.11%2C-0.3l-0.1%2C-0.1h-0.17l-0.16%2C-0.27l-0.24%2C-0.23l-0.7%2C-0.14l-0.03%2C-0.08l-0.26%2C-0.2l-0.19%2C-0.01l-0.05%2C-0.27l-0.2%2C-0.2l-0.19%2C-0.06l-0.11%2C-0.18l-0.14%2C-0.03l-0.37%2C-0.31l-0.32%2C-0.58l-0.44%2C-0.21l-0.17%2C-0.61l-0.09%2C-0.1l-0.05%2C-0.33l-0.86%2C-0.58l-0.05%2C-0.24l0.3%2C0.01l0.09%2C0.21l0.2%2C-0.03l0.03%2C-0.11l-0.1%2C-0.14l0.12%2C-0.08v-0.13l-0.07%2C-0.06l-0.03%2C-0.52l-0.24%2C-0.37l-0.07%2C-0.34l-0.24%2C-0.24l-0.62%2C0.04l-0.31%2C0.08l-0.04%2C0.23l0.19%2C0.1l0.09%2C0.25l0.1%2C-0.01l0.01%2C0.11l-0.07%2C0.04l0.09%2C0.14l-0.08%2C0.08l0.14%2C0.06l0.06%2C0.13l-0.06%2C0.1h-0.15l-0.08%2C-0.11l-0.15%2C-0.18l-0.22%2C-0.68l-0.29%2C-0.37l-0.11%2C-0.25l0.06%2C-0.55l-0.07%2C-0.21l0.04%2C-0.23l-0.22%2C-0.48l0.02%2C-0.16l0.08%2C-0.1l0.05%2C-0.38l-0.07%2C-0.21l-0.51%2C-0.55l0.06%2C-0.1l-0.2%2C-0.25l-0.08%2C-0.3l-0.13%2C-0.35l-0.06%2C-0.28l-0.11%2C-0.1l0.11%2C-0.42l0.13%2C-0.2l-0.05%2C-0.14l0.2%2C-0.41l0.09%2C-0.27l-0.04%2C-0.44l0.05%2C-0.44l0.34%2C-0.34l0.05%2C-0.21l0.11%2C-0.1l-0.06%2C-0.25l0.15%2C-0.14l0.02%2C-0.31l0.29%2C-0.59l0.01%2C-0.23l0.17%2C-0.47l-0.16%2C-0.25l-0.46%2C-0.42l-0.11%2C-0.51l-0.09%2C-0.2l-0.12%2C-0.08l-0.08%2C-0.5l-0.2%2C-0.03l-0.32%2C-0.31l-0.1%2C-0.08l-0.19%2C-0.13l-0.11%2C-0.17l-0.05%2C-0.13l-0.29%2C0.07v-0.23l0.08%2C-0.01l0.02%2C-0.1l-0.11%2C-0.3l-0.16%2C-0.01l0.03%2C-0.23l-0.19%2C-0.43l-0.06%2C-0.28l0.01%2C-1.08l0.29%2C-0.52l-0.03%2C-0.3l-0.09%2C-0.14l-0.17%2C-0.08l0.06%2C-0.26l0.21%2C-0.24l0.14%2C-0.34l0.15%2C-0.04l0.14%2C-0.45l-0.05%2C-0.21l-0.19%2C-0.23l-0.09%2C-0.14l-0.02%2C-0.16l-0.15%2C-0.14l-0.01%2C-0.13l-0.15%2C-0.08l-0.13%2C0.03l-0.14%2C0.21l-0.1%2C0.01l0.24%2C-0.3l-0.02%2C-0.06h-0.13l-0.08%2C-0.04l0.2%2C-0.07V434l0.13%2C-0.37l-0.03%2C-0.25l0.08%2C-0.34l0.14%2C-0.18l0.13%2C-0.4l0.05%2C-0.58l-0.39%2C-0.34l-0.22%2C0.06l-0.32%2C-0.07l-0.2%2C-0.28v-0.27l-0.14%2C-0.24l-0.49%2C-0.17l-0.2%2C-0.23l-0.17%2C0.06l-0.09%2C-0.16l-0.2%2C-0.03l-0.09%2C-0.35l-0.19%2C-0.23l-0.06%2C-0.01l-0.11%2C0.13l-0.09%2C-0.14l-0.46%2C0.07l-0.35%2C-0.14l-0.06%2C-0.54l-0.5%2C-0.16l-0.24%2C-0.27l-0.21%2C-0.08l-0.04%2C-0.3l0.11%2C-0.21l-0.01%2C-0.47l-0.23%2C-0.17l-0.12%2C-0.19l-0.16%2C0.06v-0.21l-0.16%2C-0.23l-0.22%2C-0.08l-0.05%2C-0.21h-0.08l-0.21%2C-0.28l-0.51%2C-0.33l-0.15%2C-0.18l-0.16%2C-0.41l-0.19%2C-0.23l-0.16%2C-0.03l-0.13%2C0.07l-0.19%2C-0.13l-0.03%2C-0.27l-0.25%2C-0.17l-0.25%2C-0.4l-0.04%2C-0.24l-0.11%2C-0.03l-0.19%2C-0.27l-0.29%2C-0.14l-0.66%2C-0.06l-0.15%2C-0.23l-0.04%2C-0.17l-0.24%2C-0.2v-0.11l-0.11%2C-0.26l-0.4%2C-0.6l-0.08%2C-0.3l-0.71%2C-0.23l-0.59%2C0.14l-0.28%2C-0.39l-0.48%2C-0.48l-0.21%2C-0.11h-0.21l-0.24%2C-0.23l-0.14%2C-0.03l-0.05%2C-0.1l-0.19%2C-0.1l-0.11%2C-0.51l-0.22%2C-0.2l-0.03%2C-0.29l-0.08%2C-0.08l0.27%2C-0.74l-0.12%2C-0.11l-0.01%2C-0.21l-0.19%2C-0.13v-0.13l-0.17%2C-0.17l0.03%2C-0.27l-0.24%2C-0.31l-0.38%2C-0.27l-0.13%2C0.06l-0.3%2C-0.04l-0.04%2C-0.28l-0.24%2C-0.36h-0.17l-0.31%2C-0.14l-0.01%2C-0.47l-0.07%2C-0.19l0.16%2C-0.28v-0.27l-0.09%2C-0.33l-0.22%2C-0.27l-0.41%2C-0.3v-0.13l0.1%2C-0.06l-0.04%2C-0.34l0.09%2C-0.36l0.06%2C-0.04l0.02%2C-0.3l0.21%2C-0.16l-0.31%2C-0.93l-0.31%2C-0.24l-0.06%2C-0.14l-0.42%2C-0.03l-0.14%2C-0.13l-0.14%2C-0.3l-0.14%2C-0.13l-0.12%2C-0.17l0.01%2C-0.21l-0.29%2C-0.3l-0.22%2C-0.1l-0.29%2C0.04l-0.12%2C-0.16l-0.82%2C-0.38l-0.01%2C-0.06l0.1%2C-0.06l-0.02%2C-0.23l-0.1%2C-0.14l-0.14%2C-0.06l-0.1%2C-0.47l-0.15%2C-0.04l-0.02%2C0.31l0.04%2C0.08l-0.09%2C0.1l-0.08%2C-0.04l-0.13%2C0.11l-0.13%2C-0.3l0.15%2C-0.13l0.02%2C-0.27l0.08%2C-0.01l0.09%2C-0.14l-0.11%2C-0.31h-0.09l-0.1%2C0.14l0.02%2C0.14l0.15%2C0.01v0.06l-0.49%2C0.24l-0.09%2C0.1l0.02%2C-0.21l0.22%2C-0.21l0.24%2C-0.56l-0.04%2C-0.4l-0.17%2C-0.38L424.6%2C406l-0.13%2C-0.09h-0.14l0.26%2C-0.33v-0.2l-0.09%2C-0.14l0.04%2C-0.47l-0.09%2C-0.37l0.2%2C-0.27l0.04%2C-0.41l-0.24%2C-0.14l0.03%2C-0.27l-0.05%2C-0.1l-0.17%2C-0.01l-0.01%2C-0.41l-0.16%2C-0.13l0.09%2C-0.44l-0.07%2C-0.19l-0.1%2C-0.07l-0.01%2C-0.13l-0.08%2C-0.08h-0.19l-0.29%2C-0.11l-0.77%2C-0.23l-0.06%2C-0.11l0.01%2C-0.19l0.44%2C-0.43l0.13%2C-0.46l-0.2%2C-0.64l-0.07%2C-0.97l-0.16%2C-0.16l-0.06%2C-0.3l0.05%2C-0.13l0.1%2C-0.01l-0.01%2C-0.14l0.1%2C-0.1l0.06%2C-0.24l-0.05%2C-0.14l0.17%2C-0.37l-0.13%2C-0.67l0.47%2C-0.84l-0.09%2C-1.06l-0.05%2C-0.1l-0.1%2C-0.01l-0.09%2C-0.29l-0.11%2C-0.09l-0.01%2C-0.17l-0.39%2C-0.66h-0.09l-0.21%2C-0.17h-0.06l0.03%2C0.09l-0.08%2C0.04l-0.19%2C-0.03l-0.21%2C-0.73l-0.16%2C-0.27l-0.42%2C-0.42l0%2C0l6.93%2C-5.2l2.57%2C-0.59l0%2C0V385.01z%22%2F%3E%0A%09%09%3Cpath%20fill%3D%22white%22%20stroke%3D%22none%22%20id%3D%22EG-KB%22%20title%3D%22Al%20Qaly%C5%ABb%C4%AByah%22%20%20d%3D%22M357.46%2C373.52L355.05%2C372.04L353.4%2C369.26L353.4%2C369.26L353.23%2C364.63L353.23%2C364.63L352.35%2C362.89L351.95%2C361.01L351.95%2C361.01L353.23%2C358.35L355.5%2C356.78L355.5%2C356.78L357.91%2C354.94L358.43%2C353.71L358.43%2C353.71L358.83%2C349.2L358.83%2C349.2L359.74%2C349.79L360.81%2C351.58L361.98%2C351.65L361.98%2C351.65L360.71%2C352.95L360.63%2C355.43L359.97%2C355.47L359.97%2C358.09L361.09%2C359.15L362.21%2C360.62L363.42%2C363.01L364.44%2C365.7L366.57%2C367.36L369.02%2C368.7L369.22%2C368.97L371.02%2C370.05L371.02%2C370.05L366.51%2C370.35L362.11%2C372.12L360.25%2C373.81L360.25%2C373.81z%22%2F%3E%0A%09%09%3Cpath%20fill%3D%22white%22%20stroke%3D%22none%22%20id%3D%22EG-KFS%22%20title%3D%22Kafr%20ash%20Shaykh%22%20%20d%3D%22M351.8%2C297.07L352.08%2C297.16L352.23%2C297.13L352.66%2C297.2L352.72%2C297.28L352.85%2C297.23L352.91%2C297.36L352.99%2C297.35L353.19%2C297.51L353.45%2C297.6L354.24%2C297.74L355.21%2C298.04L355.72%2C298.05L355.86%2C298.14L356.08%2C298.17L356.27%2C298.3L356.44%2C298.3L356.81%2C298.56L357.75%2C298.72L358.62%2C299.06L359.27%2C299.18L361.1%2C299.97L361.12%2C302.68L359.87%2C302.57L359.87%2C302.57L358.86%2C303.48L358.94%2C305.57L360.03%2C305.48L360.11%2C308.38L360.57%2C309.38L360.64%2C320L360.88%2C321.7L360.18%2C322.24L358.54%2C321.93L358.54%2C321.93L358.54%2C321.83L357.35%2C321.86L355.83%2C321.79L355.83%2C321.79L350.63%2C322.22L349.68%2C322.15L349.68%2C327.76L344.46%2C327.67L344.23%2C328.56L344.07%2C329.57L339.4%2C329.57L339.1%2C328.52L339.1%2C328.52L337.89%2C328.51L335.97%2C325.02L330.04%2C319.44L326.38%2C319.79L326.38%2C312.89L323.58%2C309.67L323.17%2C304.77L325.14%2C304.76L327.65%2C304.22L334.52%2C301.89L337.53%2C301.13L339.47%2C299.86L340.09%2C300.06L341.16%2C299.57L344.5%2C298.74L345.99%2C297.95L346.16%2C298.55L345.99%2C299.2L344.91%2C298.9L343.83%2C299.14L341.45%2C299.86L339.92%2C300.71L339.35%2C301.29L338.28%2C301.77L337.5%2C302.25L335.83%2C302.91L334.22%2C303.44L333.14%2C304.46L332.78%2C305.3L332.19%2C305.24L331.41%2C305.6L329.92%2C305.65L329.56%2C306.19L328.78%2C306.31L327.71%2C306.07L326.87%2C306.37L326.69%2C307.03L326.62%2C308.34L327.23%2C308.34L328.66%2C308.58L331.6%2C308.5L331.71%2C307.92L332.19%2C306.55L333.26%2C306.85L334.14%2C307.57L334.98%2C308.07L335.65%2C307.27L335.89%2C306.55L336.61%2C306.13L337.74%2C305.3L338.28%2C305.18L338.56%2C305.72L339.24%2C306.31L340.37%2C306.01L342.09%2C306.26L343.36%2C306.35L344.48%2C305.67L346.75%2C305.07L347.6%2C303.84L348.2%2C302.43L348.85%2C301.53L350.35%2C301.59L351.24%2C301.71L351.31%2C302.74L351.99%2C303.01L352.67%2C301.17L351.9%2C300.16L349.99%2C298.96L348.61%2C298.37L347.53%2C298.23L346.75%2C298.01L347.66%2C297.55L349.17%2C297.16L349.53%2C297.13L349.67%2C297.22L349.87%2C297.13z%22%2F%3E%0A%09%09%3Cpath%20fill%3D%22white%22%20stroke%3D%22none%22%20id%3D%22EG-KN%22%20title%3D%22Qin%C4%81%22%20%20d%3D%22M422.69%2C625.51l-2.43%2C-1.21l-2.47%2C-2.19l-1.25%2C-0.96l-1.22%2C-3.2l-0.41%2C-3l0.18%2C-1.55l-0.76%2C-1.52l-0.15%2C-3.12l-1.15%2C-2.49l-0.64%2C-1.07l0.11%2C-2.34l0.92%2C-2.03l1.78%2C-1.84l2.64%2C-1.14l2.64%2C-2.47l1.66%2C-1.97l0.69%2C-1.52v-2.67l0.52%2C-1.59l1.55%2C-2.73l1.33%2C-1.97l-0.25%2C-2.25l-1.22%2C-2.27l-0.92%2C-0.76l-2.58%2C-0.13l-2.58%2C1.02l-1.89%2C1.4l-4.19%2C1.72l-1.15%2C0.7l-1.89%2C0.63l-1.84%2C0.13l-2.07%2C0.38l-1.43%2C0.44l-4.82%2C0.12l-1.6%2C-0.63l-4.86%2C-4.24l0%2C0l-2.18%2C-2.66l0%2C0l0.69%2C-1.13l0.98%2C-0.95l1.43%2C-0.96h1.32l1.21%2C-0.45l1.32%2C-0.95l0.69%2C-1.15l0.86%2C-0.13l1.21%2C0.64l0.23%2C1.4l0.64%2C1.72l0.94%2C0.45l0.72%2C0.5l0.98%2C1.34h1.21l0.46%2C-0.64l0.92%2C-1.01l0%2C0l1.69%2C-0.12l1.43%2C-0.76l2.07%2C-1.53l2.93%2C-2.04l2.47%2C-0.83l6.08%2C-0.06l4.48%2C0.96l3.39%2C2.29l1.43%2C2.29l0.62%2C2.18l0%2C0l0%2C0l0%2C0l1.13%2C2.48l0.35%2C3.43l0%2C0l0.03%2C3.95l-0.2%2C0.77l0%2C0l-1.74%2C5.5l-1.97%2C3.15l-5.77%2C3.76l-1.89%2C3.1l-1.72%2C1.83l-0.8%2C1.83v5.38l0.8%2C2.53l1.55%2C2.46l0%2C0l0.71%2C0.64l0%2C0l0.07%2C3.57L422.69%2C625.51zM418.67%2C601.39l1.84%2C0.34l1.45%2C-0.25l0.92%2C-1.35l0.61%2C-1.44l0.31%2C-1.6l-2.68%2C-0.25l-1.38%2C3.29L418.67%2C601.39z%22%2F%3E%0A%09%09%3Cpath%20fill%3D%22white%22%20stroke%3D%22none%22%20id%3D%22EG-LX%22%20title%3D%22Al%20Uq%C5%9Fur%22%20%20d%3D%22M423.8%2C597.09L423.5%2C598.69L422.88%2C600.13L421.97%2C601.48L420.51%2C601.73L418.67%2C601.39L419.75%2C600.13L421.13%2C596.83z%22%2F%3E%0A%09%09%3Cpath%20fill%3D%22white%22%20stroke%3D%22none%22%20id%3D%22EG-MN%22%20title%3D%22Al%20Miny%C4%81%22%20%20d%3D%22M241.91%2C499.36L243.29%2C496.6L244.28%2C494.39L244.87%2C492.62L245.27%2C490.4L246.05%2C488.62L247.63%2C487.51L249.21%2C486.63L254.53%2C485.51L257.69%2C483.96L261.83%2C480.85L265.57%2C479.52L268.14%2C477.52L270.7%2C476.85L274.45%2C473.51L279.18%2C470.4L281.74%2C468.39L284.11%2C466.16L285.29%2C460.59L286.87%2C455.23L288.05%2C451.88L289.63%2C448.98L290.77%2C444.64L290.77%2C444.64L293.28%2C444.41L301.77%2C444.12L303.29%2C444.15L336.7%2C443.04L339.13%2C444.45L342.02%2C446.46L342.02%2C446.46L345.75%2C446.96L345.29%2C448.57L345.29%2C448.57L344%2C452.29L343.94%2C456.58L343.94%2C456.58L343.9%2C459.06L342.72%2C460.76L341.61%2C462.59L340.37%2C464.83L339.62%2C467.64L339.75%2C469.88L340.37%2C475.91L343.72%2C483.6L344.21%2C489.47L345.33%2C493.1L345.58%2C497.85L345.21%2C501.19L345.21%2C501.19L342.43%2C501L340.87%2C502.37L338.44%2C501.98L336.61%2C501.49L333.58%2C501.49L333.58%2C501.49L333.49%2C499.54L243.36%2C499.36L243.36%2C499.36z%22%2F%3E%0A%09%09%3Cpath%20fill%3D%22white%22%20stroke%3D%22none%22%20id%3D%22EG-MNF%22%20title%3D%22Al%20Min%C5%ABf%C4%AByah%22%20%20d%3D%22M347.01%2C345.13L347.01%2C345.13L347.01%2C345.13L351.44%2C345.08L351.91%2C346.29L351.91%2C346.29L351.74%2C346.23L351.91%2C346.29L351.91%2C346.29L351.97%2C347.32L355.06%2C347.34L355.06%2C347.34L358.84%2C349.08L358.43%2C353.71L358.43%2C353.71L357.91%2C354.94L355.5%2C356.78L355.5%2C356.78L353.23%2C358.35L351.95%2C361.01L351.95%2C361.01L352.35%2C362.89L353.23%2C364.63L353.23%2C364.63L353.4%2C369.34L351.45%2C370L350.69%2C369.81L350.69%2C369.81L349.8%2C369.29L349.8%2C369.29L349.8%2C369.29L349.8%2C369.29L349%2C370.19L347.37%2C369.89L346.47%2C369L346.4%2C367.2L345.49%2C366.31L344.07%2C366.38L343.98%2C363.2L343.98%2C363.2L343.98%2C363.2L343.98%2C363.2L341.89%2C363.06L341.21%2C363.64L339.77%2C363.76L339.77%2C363.76L339.91%2C361.93L341.29%2C361.78L341.37%2C359.93L341.27%2C355.9L340.69%2C354.36L340.95%2C352.63L339.78%2C351.75L340.24%2C349.94L339.17%2C349.86L339.04%2C349.46L339.31%2C344.8L339.31%2C344.8L342.83%2C344.36L342.98%2C343.37L345.4%2C343.37L345.47%2C344.27L346.63%2C344.32z%22%2F%3E%0A%09%09%3Cpath%20fill%3D%22white%22%20stroke%3D%22none%22%20id%3D%22EG-MT%22%20title%3D%22Ma%C5%A3r%C5%AB%E1%B8%A9%22%20%20d%3D%22M84.21%2C293.66l0.08%2C0.28l-0.01%2C0.35l-0.06%2C0.04l0.04%2C0.16l-0.07%2C0.1l0.01%2C0.12l-0.11%2C0.18l0.09%2C0.31l-0.05%2C0.12l0.25%2C0.2l0.05%2C0.1l-0.06%2C0.07l0.16%2C0.12l-0.07%2C0.15h-0.06l0.06%2C0.16l-0.08%2C0.26l0.09%2C-0.03l0.07%2C0.07l-0.02%2C0.13l0.24%2C0.25l0.26%2C0.6l0.1%2C0.06l0.01%2C0.17l-0.06%2C0.04l0.16%2C0.41l-0.03%2C0.1l0.15%2C0.17l0.02%2C0.17l0.15%2C0.19l0.14%2C0.01l-0.05%2C0.17l-0.41%2C0.1l-0.07%2C0.25l-0.1%2C0.07l-0.08%2C0.01l-0.07%2C-0.13l-0.11%2C0.09v0.39l0.16%2C0.34l0.15%2C0.16l-0.01%2C0.13l0.37%2C0.41h0.09l0.2%2C0.17l1.32%2C0.54l1.36%2C0.35l1.27%2C0.17l1.06%2C0.25h0.39l0.16%2C0.06l0.05%2C-0.04l1.41%2C0.04l1.17%2C-0.09l0.06%2C-0.07l0.05%2C0.12l0.37%2C0.03l0.07%2C-0.04l0.05%2C0.06l0.77%2C0.04l1.51%2C-0.29l0.89%2C-0.32l0.51%2C-0.07l0.01%2C-0.09l0.19%2C0.1l0.69%2C-0.01l1.2%2C-0.25l1.49%2C-0.47l1.06%2C-0.45l1.52%2C-0.42l0.01%2C-0.07l0.21%2C0.03l1.77%2C-0.67l0.15%2C0.06l0.01%2C-0.06l0.16%2C-0.01l0.2%2C-0.15h0.14l0.39%2C-0.2l0.34%2C-0.03l0.1%2C-0.09l0.51%2C-0.13l0.13%2C-0.1h0.22l0.06%2C-0.07l0.3%2C-0.07l0.15%2C-0.13l0.24%2C-0.03l0.24%2C-0.16h0.24l0.35%2C-0.2l0.51%2C-0.13l0.51%2C-0.28l1.01%2C-0.32l0.25%2C-0.16l0.19%2C0.01l0.39%2C-0.22l0.34%2C-0.04l0.26%2C-0.13l0.06%2C0.03l0.06%2C-0.07l0.14%2C-0.01l0.03%2C-0.09l0.09%2C0.07l0.15%2C-0.13h0.41l0.1%2C-0.09l0.1%2C0.03l0.12%2C-0.09l0.1%2C0.01l0.06%2C-0.1l0.21%2C0.03l0.02%2C-0.06l0.13%2C-0.01l0.09%2C0.04l0.19%2C-0.12l0.1%2C0.03l0.15%2C-0.12h0.22l0.35%2C-0.17l0.19%2C0.03l0.14%2C-0.07l0.31%2C-0.01l0.06%2C-0.09l0.31%2C0.01l0.07%2C-0.06l0.05%2C0.07l0.54%2C-0.03l0.06%2C0.06l0.15%2C-0.04l0.06%2C0.07l0.15%2C-0.01l0.24%2C0.13l0.21%2C-0.01l0.25%2C0.13l0.2%2C-0.04l0.13%2C0.15l0.24%2C0.06l0.21%2C0.03l0.21%2C-0.06l0.27%2C0.19l0.4%2C0.01l0.02%2C0.06h0.29l0.04%2C0.06l0.2%2C-0.03l0.1%2C0.07l0.11%2C-0.01l0.06%2C0.09l0.08%2C-0.1l0.19%2C0.01l0.06%2C0.12l0.1%2C-0.06l0.21%2C0.03l0.27%2C0.2l0.08%2C-0.06l0.09%2C0.07l0.16%2C-0.04l0.06%2C0.09l0.02%2C-0.09h0.11l0.01%2C0.12l0.25%2C0.09l0.26%2C-0.05l0.19%2C0.09h0.32l0.32%2C0.18l0.26%2C-0.04l0.08%2C0.12l0.17%2C-0.03l0.05%2C0.07l0.07%2C-0.03l0.19%2C0.09l0.1%2C-0.06l0.09%2C0.12l0.14%2C-0.03l0.17%2C0.09l0.05%2C-0.07l0.05%2C0.09l0.61%2C0.1l0.24%2C0.25l0.12%2C-0.01l0.01%2C0.07l0.2%2C-0.07l0.06%2C0.1l0.1%2C-0.04l0.06%2C0.06l0.22%2C0.01l0.08%2C0.12l0.11%2C-0.01l0.26%2C0.13l0.09%2C-0.05l0.11%2C0.09l0.14%2C0l0.07%2C0.09l0.15%2C-0.06l0.25%2C0.23l0.4%2C0.16l0.07%2C-0.03l0.92%2C0.28l0.15%2C-0.04l0.11%2C0.1l0.16%2C-0.01l0.05%2C0.1l0.4%2C0.01l0.15%2C0.13l0.09%2C-0.06l0.31%2C0.01l0.22%2C0.13l0.34%2C0.09l0.04%2C0.07l0.74%2C0.13l0.76%2C0.31l0.22%2C-0.04l0.12%2C0.1l0.11%2C-0.01l0.14%2C0.13l0.85%2C0.22l0.5%2C0.36l0.37%2C-0.04l0.11%2C0.04l0.02%2C0.1l0.23%2C-0.03l0.16%2C0.19l0.27%2C-0.04l0.1%2C0.19l0.24%2C-0.04l0.16%2C0.12l0.37%2C-0.04l0.36%2C0.19l0.3%2C-0.06l0.47%2C0.03l0.11%2C0.18l0.29%2C0.15h0.19l0.05%2C-0.07l0.41%2C0.13l0.81%2C-0.06l0.16%2C0.1l0.37%2C-0.01l0.07%2C0.09l0.14%2C-0.06l0.22%2C0.14l0.74%2C0.03l0.05%2C0.07l0.35%2C0.03l0.26%2C0.12l0.04%2C0.09l0.29%2C0.06l0.52%2C0.31l0.17%2C-0.03l0.42%2C0.22l0.8%2C-0.03l1.48%2C-0.25l0.54%2C-0.33l0.06%2C0.45l0.41%2C0.22l0.36%2C0.01l0.05%2C0.15l0.16%2C0.04l0.15%2C-0.04l0.17%2C0.12l0.66%2C0.03l0.61%2C-0.15h0.05l-0.02%2C0.09l0.11%2C0.03l1.2%2C-0.09l0.27%2C0.01l0.36%2C0.12l0.36%2C-0.06l0.47%2C0.25l0.9%2C0.03l0.3%2C0.12l1.91%2C-0.1l0.12%2C0.04l0.16%2C0.22l0.59%2C0.23l0.44%2C0.07l0.12%2C0.25l-0.01%2C0.16l0.24%2C0.15l0.08%2C0.13l1.31%2C0.36l0.31%2C0.19l0.06%2C0.15l0.34%2C0.07l0.19%2C0.15l0.37%2C0.07l1.1%2C-0.06h0.85l0.3%2C0.06l0.08%2C-0.06l0.69%2C0.04l0.15%2C0.09l0.2%2C-0.09l0.29%2C0.06l0.05%2C-0.07l0.74%2C-0.06l0.19%2C-0.03l0.7%2C-0.07l0.1%2C0.07l0.17%2C-0.09l0.09%2C0.07l0.15%2C-0.03l0.14%2C0.12l0.25%2C-0.07l0.04%2C0.2l0.19%2C0.09l0.1%2C0.2l0.14%2C0.03l0.27%2C0.23h0.16l0.04%2C0.1l-0.05%2C0.26l0.34%2C0.5l0.32%2C0.17l0.8%2C0.06l0.11%2C0.13l0.13%2C-0.09h0.46l0.06%2C0.17l0.26%2C0.17l0.29%2C-0.19l0.14%2C0.41v0.09l-0.07%2C0.03l0.05%2C0.26l0.22%2C0.22l0.5%2C0.22l0.29%2C-0.03l0.5%2C0.19l0.09%2C0.13l0.7%2C-0.07l0.71%2C0.04l0.9%2C-0.02v-0.06l0.89%2C0.03l0.13%2C0.06l1.5%2C0.12l0.09%2C0.07h0.41l0.31%2C0.12l-0.24%2C0.13h-0.22l-0.09%2C-0.15l-0.1%2C-0.04l-0.37%2C0.07l-0.14%2C-0.13h-0.31l-0.11%2C0.04l-0.1%2C0.17l-0.34%2C-0.22l-0.15%2C0.16h-0.1l-0.06%2C0.28l0.06%2C0.16l0.76%2C0.04l0.04%2C-0.1l0.44%2C0.01l0.05%2C-0.06l0.49%2C0.04l0.04%2C-0.13l0.14%2C-0.07l0.14%2C0.32l0.27%2C0.09l0.42%2C0.03l0.24%2C-0.19v-0.07l0.19%2C0.04l0.1%2C0.1l0.11%2C-0.06l0.04%2C-0.15l-0.1%2C-0.12l-0.47%2C-0.04l-0.04%2C-0.07l0.44%2C0.06l0.15%2C-0.04l0.2%2C0.04l0.09%2C-0.06l0.54%2C0.05l1.26%2C-0.19l0.66%2C-0.03l0.61%2C-0.13l0.15%2C0.04l0.46%2C-0.04v0.26l0.37%2C0.12l0.14%2C0.12l0.02%2C0.45l-0.1%2C0.01l-0.16%2C0.29l0.01%2C0.38l-0.05%2C0.12l0.3%2C0.47v0.16l0.17%2C0.1l0.04%2C0.13l0.09%2C0.03l0.16%2C0.26l0.15%2C0.09l0.06%2C0.35l-0.04%2C0.17l0.41%2C0.67l0.09%2C0.46l0.11%2C0.13l0.02%2C0.22l-0.09%2C0.1l0.07%2C0.07l-0.01%2C0.13l0.13%2C0.01l0.05%2C0.15l-0.02%2C0.36l0.17%2C0.15l0.2%2C0.38l0.35%2C0.31l-0.04%2C0.09l0.24%2C0.22l0.54%2C0.39l0.27%2C0.31l0.36%2C0.19l0.31%2C0.26l0.49%2C0.22l1.75%2C0.36l3.06%2C0.01l0.02%2C0.1l-0.07%2C-0.06l-0.15%2C0.01l0.02%2C0.13l0.14%2C0.17l0.25%2C0.09l0.12%2C0.2l0.32%2C0.22h0.81l0.31%2C-0.06l0.07%2C-0.13h0.34l0.21%2C-0.09l1.22%2C-0.03l0.04%2C0.06l-0.19%2C0.26l0.09%2C0.29l0.06%2C0.13l0.39%2C0.17l0.02%2C0.07l0.61%2C-0.06l0.19%2C0.03l0.09%2C0.1l0.2%2C0.06l0.86%2C0.1l0.06%2C-0.15l0.15%2C-0.1l-0.04%2C-0.17l-0.15%2C0.03l-0.22%2C0.25l-0.21%2C-0.01v-0.28l0.21%2C0.03l0.02%2C-0.06h0.41l0.34%2C-0.12l0.19%2C-0.03l0.16%2C-0.06l0.65%2C-0.07l0.39%2C-0.12l1.02%2C-0.42h0.26l0.01%2C-0.06l0.62%2C-0.2l0.11%2C-0.1l0.27%2C-0.04l0.11%2C-0.15l0.44%2C-0.07l0.02%2C-0.09l0.11%2C-0.04l0.6%2C-0.15l0.11%2C-0.09l0.11%2C0.07l0.08%2C-0.12l0.21%2C-0.06l0.16%2C-0.17l0.15%2C-0.04l0.11%2C0.04l0.05%2C-0.1l0.29%2C-0.16v-0.15l0.15%2C0.06l-0.04%2C-0.17l0.14%2C-0.15l0.11%2C0.01l0.06%2C-0.22l0.1%2C-0.01l0.1%2C-0.31l-0.06%2C-0.15l0.2%2C0.04l0.37%2C0.2l0.02%2C0.19l0.07%2C0.03l-0.11%2C0.17l0.04%2C0.13l-0.09%2C0.12l0.01%2C0.23l0.11%2C0.16l0.11%2C-0.04l-0.05%2C0.1l0.1%2C0.13h-0.09l-0.1%2C-0.1l-0.04%2C0.13l0.1%2C0.09l-0.11%2C0.01l-0.04%2C0.17l0.1%2C0.23l0.11%2C0.94l0.35%2C0.45l0.06%2C0.19l0.16%2C0.06v0.06l0.37%2C0.3l0.02%2C0.19l-0.13%2C0.36l0.2%2C0.33l-0.11%2C0.01l-0.11%2C0.12l0.16%2C0.48l-0.13%2C0.04l-0.02%2C0.16l0.2%2C0.39l0.11%2C0.07l-0.14%2C0.06l0.12%2C0.54l0.13%2C0.25l0.21%2C0.22l0.8%2C0.46l0.21%2C0.06l0.01%2C0.07l1.2%2C0.26l1.2%2C0.1l0.31%2C-0.04l0.84%2C0.07l0.11%2C-0.05l0.06%2C0.13l0.16%2C0.07l0.52%2C-0.04l0.76%2C0.06v-0.06h0.06l0.08%2C0.1l0.35%2C-0.07l0.11%2C0.06l0.21%2C-0.06l0.69%2C0.03l0.15%2C-0.04l0.3%2C0.06l0.37%2C-0.15l0.35%2C0.04l0.44%2C-0.1l0.56%2C0.04l0.39%2C-0.04l0.39%2C-0.13l0.85%2C0.01l0.35%2C0.12l0.67%2C0.54l0.8%2C0.2l0.26%2C0.2l0.17%2C-0.04l0.02%2C0.07l0.19%2C-0.07l0.54%2C-0.04l0.52%2C0.03l0.16%2C-0.06l0.32%2C0.03l0.04%2C0.06l0.12%2C-0.06l0.26%2C0.06l0.89%2C-0.09l0.86%2C0.09l1.11%2C0.35l0.51%2C-0.06l0.87%2C-0.35l0.35%2C-0.04l0.41%2C-0.2l0.41%2C-0.07l0.02%2C-0.09l0.34%2C-0.03l0.42%2C-0.13l1.86%2C-0.13l0.13%2C0.16l0.39%2C0.2l0.26%2C-0.09l0.06%2C0.25l0.11%2C0.15l0.45%2C0.19l0.16%2C0.32l0.16%2C0.04l0.02%2C0.07l0.19%2C0.06l0.25%2C0.19l0.26%2C0.09l0.17%2C-0.06l0.32%2C0.12l0.16%2C-0.01l0.29%2C0.25l0.34%2C0.12l0.17%2C-0.09h0.22l0.09%2C0.12l0.24%2C-0.03l0.17%2C0.06l0.16%2C-0.12l0.39%2C-0.03l0.09%2C-0.15h0.14l-0.06%2C0.09l0.01%2C0.13h0.34l0.02%2C0.29l0.09%2C-0.01l0.05%2C0.09l0.27%2C0.01l0.04%2C0.06l0.18%2C0.01l0.07%2C0.1l0.34%2C-0.03l0.29%2C0.1l0.05%2C0.06l-0.04%2C0.35l0.27%2C0.22l-0.07%2C0.13l0.04%2C0.1l0.56%2C0.3l1.96%2C0.54l0.51%2C-0.01l0.31%2C0.09l0.81%2C-0.06l0.81%2C0.06l-0.05%2C0.17l0.23%2C0.09l0.07%2C0.12l0.07%2C-0.04l0.04%2C0.15h-0.05l-0.05%2C0.26l0.19%2C0.17l0.06%2C-0.01v-0.22h0.11l0.07%2C0.17l0.49%2C0.1l0.62%2C-0.04l0.6%2C0.04v0.07l-0.11%2C-0.01l-0.07%2C0.1l-0.04%2C0.23l0.17%2C0.2l0.05%2C0.19l0.27%2C0.2l0.52%2C0.22l0.02%2C0.06l0.32%2C0.07l0.24%2C0.16l0.32%2C0.03l0.49%2C-0.06l0.81%2C0.16l-0.05%2C0.29l0.19%2C0.19l-0.02%2C0.13l0.06%2C0.06l-0.05%2C0.2l0.08%2C0.19l-0.09%2C0.07v0.23l0.19%2C0.2v0.09h0.06l0.26%2C0.3l0.45%2C0.26l0.17%2C0.22l0.51%2C0.27l0.44%2C0.12l0.21%2C0.17l0.35%2C0.15l0.16%2C0.25v0.15l0.51%2C0.54l0.64%2C0.33l0.3%2C0.04l0.9%2C0.32l0.1%2C0.07l0.05%2C0.19l0.13%2C-0.01l0.67%2C0.2l0.3%2C0.27l0.22%2C0.01l0.1%2C-0.09v0.07l-0.2%2C0.13l0.01%2C0.09l0.31%2C0.23l0.09%2C-0.01l0.1%2C0.2l0.1%2C-0.06l0.81%2C0.25l0.45%2C0.04l0.06%2C0.17l-0.86%2C-0.19l-0.24%2C-0.13l-0.15%2C0.06l-0.19%2C-0.07l-0.13%2C-0.17l-0.29%2C-0.1l-0.13%2C-0.19l-0.1%2C-0.01l0.16%2C0.27h-0.1l-0.13%2C-0.17l-0.02%2C0.04l0.09%2C0.14l0.21%2C0.07l-0.01%2C0.13l-0.22%2C-0.09l-0.06%2C-0.16L256%2C337.1l0.24%2C0.25l0.47%2C0.07l0.15%2C0.17l0.2%2C-0.04l0.16%2C0.17l0.24%2C-0.06l0.11%2C-0.12l0.16%2C0.03l0.43%2C0.3l0.31%2C-0.04l0.01%2C-0.1l-0.21%2C-0.08l0.05%2C-0.07l0.94%2C0.26l0.62%2C0.03l0.26%2C0.12l0.51%2C0.04l1.34%2C-0.09l1.14%2C0.03l0.65%2C-0.07l0.35%2C-0.14l0.1%2C0.04l1.26%2C-0.39l1.36%2C-0.27l0.06%2C-0.09l0.97%2C-0.27l1.29%2C-0.58l0.49%2C-0.17l0.07%2C0.03l0.82%2C-0.33l1.1%2C-0.27l0.72%2C-0.27l0.32%2C-0.2l0.14%2C0.03l0.5%2C-0.29l2.13%2C-1l0.94%2C-0.62l0.8%2C-0.42l0.09%2C0.06l0.85%2C-0.39l0.56%2C-0.32l0.15%2C-0.16l0.67%2C-0.33v-0.06l0.19%2C-0.07l0.19%2C-0.19l1.36%2C-0.72l0.05%2C-0.09l0.17%2C-0.06l0.09%2C-0.12l0.08%2C0.03l0.19%2C-0.17l0.07%2C0.03l0.01%2C-0.12l0.13%2C-0.1l0.11%2C0.01l0.14%2C-0.19l0.27%2C-0.16l0.03%2C-0.09l0.35%2C-0.19l0.27%2C-0.42h0.09l0.15%2C-0.15l0.06%2C0.03l0.14%2C-0.15l0.13%2C-0.01l0.51%2C-0.42l0.06%2C-0.12l0.17%2C-0.07l0.49%2C-0.43l0%2C0l-0.02%2C3.08l0.93%2C30.57l0%2C0v5.72l0%2C0l1.28%2C2.03l3.16%2C1.54l0%2C0l4.26%2C0.14l6.37%2C5.04l1.96%2C0.96l0%2C0l0%2C0l0%2C0l7.56%2C5.6l2.83%2C0.55l1.68%2C1.06l0%2C0l1.55%2C3.12l0%2C0l-3.07%2C0.4l-22.68%2C15l-6.62%2C1.63l-6.46%2C8.29l-32.28%2C31.75l-41.89%2C10.06l-20.39%2C45.43l0%2C0l-104.82%2C-0.01l0%2C0l-0.81%2C0l0%2C0l-0.02%2C-80.41l-0.49%2C-0.91l-1.42%2C-3.99l-2.1%2C-4.35l-0.48%2C-1.51l-0.74%2C-1.08l-1.02%2C-2.73l-0.12%2C-0.72l0.77%2C-1.99l0.91%2C-1.12l0.12%2C-0.73l-0.09%2C-0.43l-1.74%2C-4.32l-1.69%2C-3.79l-0.13%2C-1.35l0.16%2C-3.66l-0.31%2C-1.69l-2.69%2C-9.13l-2.48%2C-2.75l0.51%2C-1.71l1.13%2C-2.27l1.13%2C-2.02l0.45%2C-1.19l0.61%2C-2.26l2.31%2C-1.95l1.07%2C-1.35l0.77%2C-1.72l0.67%2C-1.06l1.63%2C-1.7l0.96%2C-3.33l0.1%2C-0.79l-0.04%2C-0.87l0.26%2C-1.1l1.06%2C-2.38l0.48%2C-2.37l0.14%2C-1.19l1.06%2C-2.71l0.1%2C-0.67l-1.27%2C-4.36l0.02%2C-1.03l-0.44%2C-1.64l-0.79%2C-1.25l-0.52%2C-1.46l-0.29%2C-1.77l-1.17%2C-3.5l-0.66%2C-1.29l-0.95%2C-2.25l-0.24%2C-1.73l0.06%2C-1.34l0.41%2C-3.63l-0.06%2C-2.19l-0.26%2C-1.04l-0.63%2C-1.01l-0.26%2C-1.51l-0.11%2C-1.27l0.1%2C-0.52l3.49%2C-2.78l1.11%2C-1.11l4.45%2C-3.23l0.39%2C-0.8l0.33%2C-2.05l0.25%2C-0.74l0.27%2C-0.5l0.55%2C-0.67l0.69%2C-0.61l0.62%2C-1.19L84.21%2C293.66z%22%2F%3E%0A%09%09%3Cpath%20fill%3D%22white%22%20stroke%3D%22none%22%20id%3D%22EG-PTS%22%20title%3D%22B%C5%ABr%20Sa%D9%B0%C4%ABd%22%20%20d%3D%22M409.09%2C317.27l1.29%2C0.68l0.52%2C0.39l0.28%2C0.09l0.1%2C0.13l0.35%2C0.13l0.15%2C0.17l0.04%2C0.2l0.44%2C0.25l0.11%2C0.16l0.65%2C0.49l0.5%2C0.6l0.3%2C0.51l0.56%2C0.6l0.09%2C0.09l0.06%2C0.1l0.29%2C0.36l0.06%2C0.39v0.1l0.44%2C0.45l0.64%2C0.45l0.79%2C0.77l0.66%2C0.48l0.74%2C0.39l1.01%2C0.32l0.66%2C0.09l0%2C0v3.04l0%2C0l-3.08%2C-0.81l-3%2C-1.94l0%2C0l-3.19%2C-1.16l-1.94%2C-0.97l-2.2%2C-0.17l-0.23%2C-0.65l0.93%2C-0.75l1.31%2C-1.97l0.44%2C-0.96l0.48%2C-0.57L409.09%2C317.27zM409.09%2C317.27l-0.96%2C-0.15l-0.09%2C-0.09l0.04%2C-0.15l0.06%2C-0.07v-0.13l0.15%2C-0.03l0.2%2C0.07l0.2%2C0.16l0.08%2C-0.03l0.07%2C0.03l0.19%2C0.15l0.08%2C-0.03L409.09%2C317.27zM408.13%2C316.07l-0.01%2C0.61l-0.05%2C0.01l-0.02%2C0.12l-0.03%2C0.13l-0.5%2C-0.64l0.16%2C-0.03l0.1%2C0.25l0.01%2C-0.07H408l0.17%2C-0.83l0.08%2C-0.04L408.13%2C316.07zM407.46%2C312.96l0.03%2C0.07l-0.66%2C0.97l-0.14%2C0.1l-0.05%2C0.17l-0.22%2C0.2l-0.09%2C0.23l0.11%2C0.15l0.28%2C0.06l0.04%2C0.15l0.15%2C0.12l-0.14%2C0.29l0.19%2C0.28l0.33%2C0.17l0.21%2C0.01l-0.05%2C0.26l0.08%2C0.1l-0.61%2C0.75l-0.31%2C0.48l-0.26%2C0.7l-0.09%2C-1.44l0.18%2C-0.39l-0.26%2C-0.44l-0.22%2C-0.74l-0.31%2C0.57l0.13%2C0.39l-0.39%2C0.22l0.09%2C0.52l-0.3%2C0.72l-0.4%2C-0.54l-0.22%2C-0.79l-0.35%2C-0.66l0.26%2C-0.48l-0.04%2C-0.48l0%2C0l0.32%2C-0.37l0%2C0l0.14%2C0.03l0.14%2C-0.15l0.39%2C0.17l0.82%2C0.04l0.17%2C-0.1l0.13%2C0.01L407.46%2C312.96z%22%2F%3E%0A%09%09%3Cpath%20fill%3D%22white%22%20stroke%3D%22none%22%20id%3D%22EG-SHG%22%20title%3D%22S%C5%ABh%C4%81j%22%20%20d%3D%22M384.06%2C547.77L386.08%2C550.33L386.54%2C551.92L387.51%2C553.2L389.15%2C553.73L389.59%2C556.72L390.79%2C560.32L391.95%2C562.09L392.76%2C562.94L395.49%2C564.66L399.52%2C565.87L401.33%2C567.2L402.37%2C569.79L404.41%2C572.59L404.75%2C572.72L404.56%2C574.36L406.52%2C575.24L406.52%2C575.24L405.6%2C576.25L405.14%2C576.88L403.93%2C576.88L402.96%2C575.55L402.23%2C575.05L401.3%2C574.6L400.66%2C572.88L400.43%2C571.48L399.22%2C570.84L398.36%2C570.97L397.67%2C572.11L396.35%2C573.07L395.15%2C573.51L393.83%2C573.51L392.39%2C574.47L391.42%2C575.42L390.73%2C576.55L390.73%2C576.55L390.5%2C576.28L390.5%2C576.28L389.69%2C575.29L388.07%2C572.94L387.17%2C572.56L385.73%2C570.97L382.86%2C567.21L380.54%2C563.74L379.47%2C562.5L379.33%2C562.23L377.12%2C559.39L375.17%2C556.46L373.04%2C553.41L371.95%2C551.54L369.94%2C550.01L367.43%2C549.54L364.43%2C546.08L361.91%2C542.82L361.39%2C540.99L361.39%2C540.99L362.04%2C540.79L363.23%2C539.81L364.95%2C538.85L365.81%2C538.21L366.96%2C536.55L367.53%2C535.46L369.31%2C535.65L370.17%2C536.8L371.06%2C538.78L372.1%2C539.76L372.95%2C541.61L375.17%2C541.63L375.17%2C541.63L375.67%2C541.96L378.25%2C542.91L384.06%2C547.77L384.06%2C547.77z%22%2F%3E%0A%09%09%3Cpath%20fill%3D%22white%22%20stroke%3D%22none%22%20id%3D%22EG-SHR%22%20title%3D%22Ash%20Sharq%C4%AByah%22%20%20d%3D%22M393.39%2C324.07L394.05%2C324.13L394.74%2C323.95L395.72%2C324.33L395.78%2C324.78L396.14%2C325.05L396.44%2C324.87L396.59%2C324.48L396.35%2C324.21L396.29%2C323.74L396.51%2C323.67L397.15%2C323.77L397.39%2C324.15L398.17%2C324.67L398.81%2C324.61L398.81%2C324.61L399.48%2C325.82L401.44%2C325.9L401.63%2C331.55L399.93%2C331.6L399.7%2C333.44L397.89%2C337.55L398.8%2C341.39L398.87%2C344.1L394.13%2C350.83L393.87%2C351.77L388.83%2C352.07L388.24%2C352.94L384.46%2C352.75L384.04%2C351.87L381.78%2C351.77L381.95%2C353.42L383.63%2C354.3L384.04%2C358.85L385.05%2C363.75L385.05%2C363.75L378.76%2C368.15L375.61%2C370.05L371.02%2C370.05L371.02%2C370.05L369.22%2C368.97L369.02%2C368.7L366.57%2C367.36L364.44%2C365.7L363.42%2C363.01L362.21%2C360.62L361.09%2C359.15L359.97%2C358.09L359.97%2C355.47L360.63%2C355.43L360.71%2C352.95L361.98%2C351.65L361.98%2C351.65L364%2C349.66L364.92%2C347.29L364.08%2C346.52L364.08%2C340.03L365.4%2C338.86L374.22%2C338.62L374.43%2C337.15L375.75%2C336.43L375.91%2C334.8L378.18%2C334.62L378.32%2C331.73L381.2%2C328.75L381.35%2C326.77L382.44%2C324.96L386.03%2C325.03L386.96%2C324.84L391.12%2C324.28L394.47%2C322.99L394.47%2C322.99L394.26%2C323.44L393.39%2C323.86z%22%2F%3E%0A%09%09%3Cpath%20fill%3D%22white%22%20stroke%3D%22none%22%20id%3D%22EG-SIN%22%20title%3D%22Sham%C4%81l%20S%C4%ABn%C4%81'%22%20%20d%3D%22M431.85%2C322.79l0.24%2C0.15v0.15l0.1%2C0.09l0.05%2C0.22l-0.08%2C0.04l-0.06%2C0.2l-0.22%2C-0.22h-0.09l0.01%2C0.12l0.27%2C0.25l-0.03%2C0.12l-0.41%2C-0.51l0.05%2C-0.28l-0.13%2C-0.2L431.85%2C322.79zM457.23%2C320.57l0.86%2C0.52l-0.03%2C0.09l-0.37%2C-0.23l-0.36%2C-0.04l-0.04%2C-0.1l-0.09%2C-0.03l-0.06%2C0.04l0.07%2C0.03l0.01%2C0.13h-0.06l-0.2%2C-0.35l0.12%2C-0.04l0.1%2C0.07L457.23%2C320.57zM443.49%2C316.55l0.17%2C0.06l1.04%2C-0.04l0.49%2C0.06l0.19%2C0.09l0.84%2C0.06l0.35%2C0.13l0.14%2C-0.04l0.11%2C0.1l0.31%2C0.07l0.06%2C-0.12l0.35%2C0.19l0.09%2C-0.03l1.05%2C0.2l0.14%2C-0.03l0.19%2C0.07l0.2%2C-0.1l0.02%2C0.06l-0.15%2C0.3l-0.1%2C-0.03l-0.19%2C0.15l-0.2%2C-0.19l-0.11%2C0.03l-0.03%2C-0.1l-0.09%2C0.09l-0.16%2C-0.15l-0.22%2C0.06l-0.71%2C-0.25l-0.34%2C0.01l-0.13%2C-0.09l-0.67%2C-0.17l-0.17%2C-0.01l-0.1%2C0.07l-0.17%2C-0.13l-0.26%2C-0.06h-0.56l-0.26%2C-0.07l-0.49%2C0.01l-0.51%2C0.12l-0.34%2C-0.09h-0.64l-0.09%2C0.07l-0.35%2C-0.04l-0.55%2C0.12h-0.16l0.03%2C-0.09l-0.15%2C0.07l-0.04%2C-0.06l-0.14%2C0.01l0.04%2C0.31l-0.11%2C-0.01l-0.04%2C0.13l-0.06%2C-0.07l-0.17%2C-0.03l-0.09%2C0.12l0.47%2C0.19l0.05%2C0.19h0.21l0.11%2C-0.13l-0.04%2C0.12l0.14%2C-0.01v0.06l-0.62%2C0.1l-0.69%2C0.2l-0.72%2C-0.03l-2.02%2C1.14l-0.66%2C0.57l-0.16%2C0.01l-0.14%2C0.12l-0.41%2C0.12l-1.42%2C0.61l0.01%2C0.07l-0.14%2C0.09l-0.04%2C0.29l-0.08%2C0.07h-0.22l-0.06%2C0.16l-0.16%2C0.16h-0.26l-0.07%2C-0.09l0.02%2C-0.15l0.25%2C-0.15l0.59%2C-0.55l1.55%2C-0.87l0.71%2C-0.32l0.08%2C-0.13l1.26%2C-0.7l2.2%2C-1.39l0.84%2C-0.32l0.61%2C-0.12L443.49%2C316.55zM493.99%2C316.95l3.71%2C12.31l2.56%2C7.51l3.96%2C8.31l1.3%2C5.41l-0.13%2C2.83l1.95%2C2.29l-0.93%2C2.62l0.11%2C1.59l3.14%2C2.05l0.92%2C3.44l5.33%2C14.97l-0.09%2C0.78l4.6%2C12.9l-0.03%2C2.48l0.81%2C1.4l0.2%2C0.97l-0.21%2C1.4l-0.42%2C1.41l0.18%2C1.5l0.21%2C0.86l0.59%2C1.12l1.13%2C1.33l0%2C0l-2.39%2C-0.58l-3.74%2C0.15l-3.73%2C-0.73l-3.47%2C-0.29l-3.86%2C-0.59l-0.31%2C-0.27l-1.43%2C0.12l-2.62%2C-1.07l-2.63%2C-0.88l-0.91%2C-0.28l-0.08%2C0.03l-6.04%2C-3.68l-3.86%2C-0.88l-3.6%2C-1.18l-3.34%2C-2.21l-7.97%2C-5.01l-0.05%2C-0.11l-1.77%2C-0.86l-8.2%2C-1.92l-4.26%2C0.07l-1.02%2C-0.29l-8.36%2C-1.18l-9.77%2C-0.29l-6.61%2C0.43l-0.02%2C-0.12l-0.24%2C0.28l-1.87%2C-0.07l0%2C0v-1.84l0%2C0l-1.54%2C-0.15l0.13%2C-11.38l-1.04%2C-3.86l0%2C0l-0.12%2C-0.01l0%2C0l-0.77%2C-2.79l-1.41%2C-3.85l-1.67%2C-2.97l-3.21%2C-5.05l-1.05%2C-17.58l-0.24%2C-6.82l0%2C0v-3.04l0%2C0l1.68%2C0.01l1.67%2C-0.17l0.36%2C-0.06l0.16%2C-0.09l0.74%2C-0.09l0.05%2C-0.06l1.67%2C-0.41l0.97%2C-0.36l0.38%2C-0.22l0.22%2C-0.06l0.05%2C0.06l0.3%2C-0.22l0.5%2C-0.1l0.04%2C-0.09l1.01%2C-0.54l0.26%2C-0.22l1.02%2C-0.6l0.62%2C-0.26l0.81%2C-0.46l0.81%2C-0.54l0.25%2C-0.23l0.16%2C-0.06l0.26%2C0.55l-0.05%2C0.1l-0.15%2C0.03l-0.16%2C-0.13h-0.14l-0.39%2C0.17l-1.14%2C0.68l-0.71%2C0.25l-0.15%2C0.13l-0.52%2C0.19l-1%2C0.68l-0.5%2C0.2l-0.13%2C0.16l-0.2%2C0.06l-0.15%2C0.15l-0.3%2C0.04l-0.15%2C0.17l-0.13%2C-0.04l-0.11%2C0.22l-0.06%2C-0.06l-0.24%2C0.03l-0.04%2C0.09l-0.15%2C0.07l-0.14%2C-0.03l-0.16%2C0.04l-0.15%2C0.06l-0.06%2C0.1l-0.26%2C0.16l-0.1%2C-0.04l-0.13%2C0.04l-0.24%2C0.2l-0.25%2C-0.04l-0.28%2C0.09l-0.04%2C0.07h-0.4l-0.24%2C0.13h-0.37l-0.15%2C0.12l-1%2C0.1l-0.46%2C0.25l-0.05%2C-0.06l-0.19%2C0.01l-0.04%2C0.06l-0.16%2C-0.03l-0.2%2C0.19l-0.2%2C0.06v0.06l0.24%2C0.01l0.05%2C0.07l0.22%2C0.06l0.24%2C-0.1l-0.09%2C-0.15l0.08%2C-0.16l0.14%2C0.13l0.11%2C0.01l0.31%2C-0.06l0.35%2C0.04l0.1%2C-0.12l0.47%2C0.07l0.05%2C0.07l-0.1%2C0.25l0.05%2C0.39l-0.44%2C0.01l-0.3%2C0.19l0.04%2C0.07l0.31%2C0.03l0.14%2C0.07h0.4l0.11%2C-0.15l0.51%2C-0.03l0.4%2C-0.38l0.06%2C-0.16l0.25%2C-0.17l0.29%2C0.01l0.51%2C0.26l0.79%2C-0.06l0.31%2C-0.13l0.36%2C-0.45l0.08%2C-0.01l0.55%2C-0.57l0.13%2C-0.1l0.17%2C-0.13l0.54%2C-0.15l0.29%2C-0.29l0.17%2C-0.03l0.06%2C-0.1l0.44%2C-0.01l0.11%2C-0.1l0.16%2C-0.01l0.09%2C-0.2l0.14%2C0.1l0.31%2C-0.35l0.16%2C0.01l0.1%2C0.15l0.22%2C-0.06l0.29%2C0.06l0.05%2C0.07l0.15%2C-0.07l0.14%2C-0.17l0.36%2C0.17l0.26%2C0.01l0.03%2C0.06l0.21%2C-0.01l0.02%2C-0.1l0.19%2C0.09l0.21%2C-0.12l0.17%2C0.09l0.14%2C-0.01l-0.04%2C0.13l0.12%2C0.07l0.06%2C-0.12l0.2%2C-0.13l-0.04%2C-0.35l0.04%2C-0.1l-0.03%2C-0.06l-0.11%2C-0.01l-0.04%2C0.09l-0.22%2C0.03l-0.05%2C0.12l-0.09%2C-0.07l0.05%2C-0.1l-0.16%2C0.01l-0.09%2C0.09h-0.1l0.01%2C0.16l-0.07%2C-0.04l0.06%2C-0.28l0.36%2C-0.26h0.17l0.38%2C0.26h0.4l-0.04%2C0.06l0.06%2C0.06H435l0.3%2C0.28l0.19%2C0.03l0.05%2C0.17l0.15%2C0.03l-0.06%2C0.09l0.07%2C0.06l0.2%2C0.01l0.16%2C-0.19l0.19%2C0.01l0.06%2C0.15l-0.1%2C0.06l-0.01%2C0.13l0.14%2C0.06l0.09%2C0.22l0.14%2C0.04l0.03%2C0.06l-0.08%2C0.04l0.09%2C0.1h-0.15l-0.15%2C-0.16l-0.05%2C-0.15l0.06%2C-0.04l-0.03%2C-0.1l-0.6%2C-0.03l-0.04%2C0.04l0.1%2C0.1l0.24%2C0.06l-0.08%2C0.04l0.05%2C0.06l-0.17%2C0.03l-0.11%2C0.1l0.17%2C0.06l0.02%2C0.16l0.17%2C0.09l-0.06%2C0.09l0.07%2C0.12l-0.14%2C0.09l-0.29%2C0.01l-0.11%2C0.12l0.2%2C-0.03l0.16%2C0.2l0.46%2C0.1l0.15%2C0.13h0.91l0.36%2C-0.46l0.27%2C-0.09l0.16%2C-0.19v-0.12l-0.39%2C-0.25h-0.1l-0.06%2C0.12l-0.2%2C0.06l-0.04%2C-0.19l0.14%2C-0.35l-0.01%2C-0.13l0.22%2C-0.12l0.11%2C0.13l0.16%2C-0.13l0.21%2C-0.04l0.1%2C-0.26l0.06%2C-0.03l0.69%2C0.14l0.36%2C-0.22l-0.07%2C-0.29l-0.25%2C0.1l-0.08%2C-0.26l0.21%2C-0.42l0.02%2C-0.17l0.11%2C-0.06l0.22%2C0.03l0.15%2C-0.12l-0.03%2C-0.09l0.06%2C0.01l0.06%2C-0.19l-0.06%2C-0.16l-0.1%2C0.07l-0.08%2C-0.1l-0.11%2C-0.01l-0.3%2C0.13l-0.09%2C-0.03l-0.21%2C0.15l-0.49%2C0.01l-0.04%2C0.17l-0.21%2C0.06l-0.06%2C0.1l0.06%2C0.12l-0.11%2C0.12l-0.04%2C0.22l0.15%2C0.01l0.04%2C0.09l-0.06%2C0.07l-0.1%2C-0.03l0.07%2C0.19l-0.19%2C0.09l0.11%2C0.13l0.05%2C0.07l-0.01%2C0.13l-0.47%2C-0.32l-0.19%2C-0.04l-0.52%2C0.09l-0.79%2C-0.09v0.1l-0.29%2C0.09l-0.05%2C0.09l-0.17%2C-0.16l-0.21%2C-0.01l0.01%2C-0.25l-0.06%2C-0.09l-0.24%2C0.07l-0.19%2C-0.12l0.01%2C-0.1l0.15%2C-0.09l0.59%2C0.06l0.72%2C-0.15l0.49%2C-0.46l0.04%2C-0.13h0.09l0.1%2C-0.1l0.36%2C-0.78l0.66%2C-0.97l0.23%2C-0.16h0.14l0.4%2C-0.35l0.31%2C0.04l0.26%2C-0.09l2.27%2C-1.41l0.24%2C-0.09l0.1%2C0.2l0.19%2C-0.03l-0.03%2C0.12l-0.16%2C-0.01l-0.14%2C-0.15l-0.05%2C0.06h-0.17l0.05%2C0.1h0.2l-0.01%2C0.04l-0.24%2C0.06l-0.1%2C-0.1h-0.09l0.02%2C0.09l-0.15%2C0.06l-0.04%2C0.13l-0.08%2C0.01l-0.01%2C-0.09l-0.09%2C0.01l0.01%2C0.13l0.54%2C0.15l0.2%2C0.19l0.02%2C0.15l-0.11%2C0.04l0.14%2C0.14l0.05%2C0.18l0.49%2C0.39v0.3l0.17%2C0.15l0.01%2C0.29l0.11%2C0.26l0.69%2C0.22l0.1%2C0.16l0.02%2C0.22l0.44%2C0.64l-0.42%2C-0.49l-0.15%2C-0.3l-0.2%2C-0.13l-0.31%2C0.15l-0.17%2C-0.2h-0.47l-0.09%2C-0.15l0.09%2C-0.22l-0.11%2C-0.22l-0.16%2C0.03l0.06%2C0.33l-0.2%2C0.04l-0.27%2C-0.04l0.01%2C0.17l0.09%2C0.15v0.16l-0.09%2C0.13l0.22%2C0.06l0.05%2C0.13l0.1%2C0.04l-0.1%2C0.06l-0.03%2C0.13l0.2%2C0.03l0.06%2C0.22l0.25%2C0.12l0.08%2C0.19l0.16%2C0.01l0.21%2C-0.1l0.17%2C0.06v0.04l-0.21%2C0.01l-0.15%2C0.19h-0.16l-0.07%2C-0.2l-0.16%2C-0.04l-0.19%2C0.26l0.21%2C0.04l0.01%2C0.42l0.1%2C-0.03l0.38%2C0.28l0.32%2C0.06l0.4%2C0.26h0.17l0.34%2C-0.13l0.17%2C0.06l-0.01%2C0.09l-0.05%2C-0.06l-0.38%2C0.06l-0.09%2C0.2l-0.17%2C-0.04l-0.13%2C0.1l0.11%2C0.13l-0.01%2C0.22l0.22%2C0.2l-0.02%2C0.07l-0.19%2C0.01l-0.1%2C0.15l0.25%2C0.01l0.04%2C0.1l-0.14%2C0.26l-0.05%2C-0.1l-0.25%2C0.01l-0.01%2C0.29l0.11%2C-0.15l0.06%2C0.12l-0.15%2C0.15l-0.05%2C0.15l0.05%2C0.04l0.49%2C-0.09l0.04%2C0.1l0.14%2C-0.12l0.35%2C-0.04l0.12%2C-0.12l0.15%2C0.07l0.34%2C-0.09l0.33%2C-0.14l0.36%2C-0.32l0.21%2C-0.09l0.03%2C-0.45l0.14%2C-0.1h0.16l0.67%2C-0.23l0.29%2C0.1h0.19l0.26%2C-0.04l0.14%2C-0.06l0.52%2C-0.78l0.25%2C-0.01l0.17%2C0.19l-0.32%2C-0.04l-0.14%2C0.12l0.04%2C0.12l-0.1%2C0.01l0.13%2C0.16l0.2%2C0.07l0.2%2C-0.03l0.02%2C-0.17l0.09%2C-0.1l0.24%2C-0.07l0.12%2C0.01l-0.01%2C0.06l0.09%2C0.03l0.32%2C-0.16l0.13%2C-0.19l0.29%2C-0.17l0.27%2C0.04l-0.04%2C0.15h-0.09l-0.13%2C0.12h0.09v0.06l0.17%2C0.09v-0.19l0.36%2C0.04l0.08%2C-0.06l0.06%2C-0.28l-0.17%2C0.04l-0.07%2C-0.09l0.09%2C-0.19h0.49l0.13%2C0.1h0.15l0.01%2C-0.19l0.2%2C-0.09l-0.25%2C-0.1l-0.13%2C0.03l-0.24%2C-0.07l-0.05%2C0.13l-0.4%2C0.03l-0.34%2C0.28l-0.55%2C0.13v0.09l-0.24%2C0.09l-0.1%2C0.12l-0.16%2C0.03l0.06%2C0.09l-0.26%2C0.01l-0.1%2C-0.07l-0.07%2C0.12v-0.16l0.15%2C0.01l0.03%2C-0.09l0.36%2C-0.22l0.25%2C0.01l0.02%2C-0.1l0.35%2C-0.07l0.01%2C-0.07l0.15%2C-0.03l0.15%2C-0.13l0.19%2C-0.01l0.3%2C-0.15l0.13%2C-0.12l0.01%2C-0.13l0.21%2C-0.1l0.47%2C-0.06l0.47%2C0.09l0.66%2C-0.15l0.51%2C0.03l0.51%2C-0.16l0.13%2C-0.15v-0.12l0.09%2C-0.01l0.01%2C-0.15l-0.13%2C-0.75l0.45%2C-0.42l0.26%2C-0.55l-0.2%2C-0.32l0.01%2C-0.13l0.2%2C-0.06l0.21%2C0.07l0.11%2C-0.09l0.27%2C0.06l0.1%2C-0.09v-0.06l-0.27%2C-0.03l-1.19%2C-0.61l-0.13%2C-0.16l-0.42%2C-0.12l-0.1%2C0.03l-0.06%2C-0.09l-0.35%2C-0.12l-0.9%2C-0.55l-0.81%2C-0.12l-0.05%2C-0.06l-0.84%2C-0.09h-0.09l0.01%2C0.12l-0.19%2C0.04l-0.17%2C-0.09l-0.06%2C-0.13h-0.09l-0.04%2C0.07l-0.1%2C-0.09l-0.05%2C0.03l-0.15%2C-0.17l0.19%2C-0.36l0.08%2C0.16l0.3%2C0.09l0.46%2C0.28l1.15%2C0.15l1.02%2C0.3l0.34%2C0.03l0.42%2C0.19l0.3%2C0.03l0.49%2C0.16l1.11%2C0.46l1.07%2C0.6l0.15%2C0.19l0.8%2C0.42l-0.2%2C0.13l-0.09%2C-0.1l0.04%2C-0.09l-0.12%2C-0.09l-0.49%2C-0.22l-0.07%2C0.06l-0.03%2C0.13l0.4%2C-0.03l0.04%2C0.07l-0.09%2C0.06l0.17%2C0.04l0.06%2C0.15l-0.04%2C0.06h-0.15l-0.01%2C0.06l0.14%2C0.04l0.16%2C-0.1l0.16%2C0.12l0.21%2C0.25l-0.01%2C0.12l-0.13%2C0.09l0.22%2C-0.04l0.17%2C0.06v0.23l0.24%2C0.22l0.49%2C0.17l0.01%2C-0.09l-0.21%2C-0.1l-0.13%2C-0.26l0.04%2C-0.06l0.14%2C0.01l0.01%2C-0.06h-0.11l-0.17%2C-0.12l0.14%2C-0.06l0.08%2C0.09l0.11%2C-0.01l0.01%2C0.22h0.07l0.16%2C0.23l0.05%2C0.2l0.3%2C0.06l0.29%2C0.2l0.06%2C-0.03l-0.62%2C-0.6l0.14%2C-0.01l0.17%2C0.26l0.21%2C0.1l0.38%2C0.35l0.22%2C0.01l0.56%2C0.2l1.27%2C0.23l1.37%2C0.09h1.69l2.38%2C-0.15l0.34%2C-0.09l0.61%2C0.01l0.11%2C-0.07l0.75%2C-0.09l0.77%2C-0.19l0.25%2C0.01l0.08%2C-0.09l1.6%2C-0.36l0.2%2C-0.12l0.3%2C-0.03l1.87%2C-0.64l0.22%2C-0.01l0.03%2C-0.06l0.25%2C0.03l0.26%2C-0.42h0.05l-0.05%2C0.16l0.25%2C0.1l1.09%2C-0.35l0.39%2C-0.09l0.74%2C-0.2l0.81%2C-0.36l0.69%2C-0.19l0.13%2C-0.12l1.58%2C-0.61l0.11%2C-0.13l0.16%2C-0.01l0.08%2C-0.09l0.51%2C-0.22l0.37%2C-0.04l0.51%2C-0.22l0.15%2C0.01l0.05%2C-0.15l0.79%2C-0.33l1.83%2C-0.96l2.15%2C-1.25l1.54%2C-1l1.4%2C-0.99l0.65%2C-0.6l0.34%2C-0.19l1.6%2C-1.47L493.99%2C316.95z%22%2F%3E%0A%09%09%3Cpath%20fill%3D%22white%22%20stroke%3D%22none%22%20id%3D%22EG-TER%22%20title%3D%22Disputed%20Territory%22%20%20d%3D%22M485.86%2C778.57L482.18%2C789.74L462.36%2C792L462.13%2C791.92L444.5%2C778.48L444.5%2C778.48z%22%2F%3E%0A%09%09%3Cpath%20fill%3D%22white%22%20stroke%3D%22none%22%20id%3D%22EG-HT%22%20title%3D%22Hala'Ib%20Triangle%22%20%20d%3D%22M600.72%2C765.31l0.05%2C0.19l0.46%2C0.15l0.04%2C0.2l0.13%2C0.09l0.24%2C0.04l0.11%2C0.21l-1.12%2C-0.11l0.09%2C0.5l-0.1%2C-0.03l-0.09%2C-0.15l-0.15%2C0.05v0.12l-0.1%2C0.04l-0.11%2C0.24l-0.08%2C0.01l-0.13%2C-0.12l0.1%2C0.03l0.24%2C-0.44l-0.01%2C-0.11l-0.12%2C-0.11l-0.01%2C-0.23l0.1%2C-0.01l0.16%2C-0.23l0.05%2C-0.35H600.72zM560.64%2C734.55l0.15%2C0.08l0.24%2C0.27l0.1%2C0.23l-0.08%2C0.08l-0.01%2C0.26l0.08%2C0.04l-0.04%2C0.11l0.16%2C0.24v0.08l-0.08%2C0.01l-0.01%2C0.23h-0.11l-0.05%2C0.16l-0.29%2C0.2l0.05%2C-0.38l-0.07%2C-0.27l0.1%2C-0.21l-0.1%2C-0.38l-0.09%2C-0.13l-0.26%2C-0.03l-0.08%2C-0.08l0.09%2C-0.46l0.14%2C-0.03l0.39%2C0.27L560.64%2C734.55zM560.06%2C734.22l0.06%2C0.09l-0.07%2C0.19l0.07%2C0.51l-0.05%2C0.07l-0.15%2C-0.16l-0.14%2C-0.01l-0.08%2C0.07l-0.15%2C-0.13l-0.16%2C0.03l-0.31%2C-0.11l-0.01%2C-0.22l0.09%2C-0.12l0.36%2C0.03l0.25%2C-0.19l0.17%2C0.05l0.04%2C-0.09H560.06zM554.82%2C723.37l0.16%2C0.13l0.09%2C0.9l0.32%2C0.22l0.1%2C0.16l-0.19%2C0.32l0.11%2C0.62l0.26%2C0.24l-0.04%2C0.38l-0.11%2C-0.01l-0.03%2C0.08l0.38%2C0.26l0.14%2C-0.03l0.01%2C-0.2l0.05%2C0.01l0.32%2C0.7l-0.07%2C0.7l0.31%2C1.36l-0.07%2C0.16l0.14%2C0.19l-0.15%2C0.43l0.01%2C0.43l0.59%2C1.09l0.01%2C0.12l0.09%2C0.07l-0.03%2C0.11l0.1%2C0.05l-0.05%2C0.11l0.09%2C0.08l-0.09%2C0.3l-0.15%2C0.01l-0.04%2C-0.13l0.19%2C-0.09l-0.02%2C-0.2l-0.08%2C-0.03l-0.08%2C0.12l-0.15%2C-0.15l0.04%2C-0.26h-0.31l-0.2%2C0.32l0.1%2C0.65l0.42%2C0.27l0.14%2C0.24l0.11%2C-0.01l0.02%2C-0.31l-0.09%2C-0.18l0.11%2C0.04l0.09%2C-0.09l0.13%2C-0.01l0.1%2C0.05l-0.27%2C0.11l0.01%2C0.15l0.11%2C-0.07l0.08%2C0.04l-0.03%2C-0.12l0.16%2C0.03l0.14%2C0.3l0.04%2C0.38l0.08%2C0.09l-0.08%2C0.08l0.31%2C0.23l0.1%2C0.2l0.11%2C0.08v0.09l0.25%2C0.17l-0.05%2C0.16l0.21%2C0.03l0.01%2C0.13l-0.1%2C0.11l-0.11%2C-0.03v0.09l0.21%2C0.13l0.1%2C0.4l0.16%2C0.08l-0.09%2C-0.13l-0.01%2C-0.31l-0.17%2C-0.27l0.21%2C-0.03l0.15%2C0.07l-0.09%2C0.05l-0.04%2C0.16l0.29%2C0.32v0.27l0.39%2C0.28l-0.04%2C0.32l0.2%2C0.11l0.05%2C0.09l0.14%2C0.03l0.1%2C0.35l0.14%2C0.04l0.1%2C0.17l0.16%2C0.08l0.13%2C0.35l0.17%2C0.15l0.1%2C0.2l0.14%2C0.04l0.05%2C-0.2l-0.06%2C0.01l-0.08%2C-0.15l-0.03%2C-0.32l-0.17%2C-0.3l-0.01%2C-0.31l0.1%2C-0.12h0.16l0.15%2C0.08l0.25%2C-0.05l0.17%2C-0.13v-0.09l0.14%2C0.01l0.17%2C0.23v0.22l0.3%2C0.97l-0.16%2C0.31l-0.13%2C-0.08l-0.04%2C-0.19l-0.26%2C-0.01l-0.14%2C0.27l0.04%2C0.24l-0.05%2C0.07l0.15%2C0.04l0.06%2C0.17l0.16%2C0.04l0.15%2C0.19l0.34%2C0.08l0.3%2C-0.03l0.04%2C-0.08l-0.09%2C-0.05l-0.01%2C-0.13l-0.21%2C-0.22l-0.19%2C0.03v0.19l-0.08%2C-0.08l0.1%2C-0.61l0.09%2C-0.07l0.06%2C0.03l0.11%2C0.35l0.16%2C0.13l0.05%2C0.16l0.29%2C0.39l-0.13%2C0.11v0.08l0.15%2C0.16l0.11%2C0l0.06%2C0.08l-0.16%2C0.32l0.09%2C-0.01l0.04%2C-0.09l0.17%2C0.47l0.4%2C0.43l0.15%2C0.38l0.29%2C0.19l0.32%2C0.42l0.2%2C0.09l0.05%2C0.19l0.07%2C-0.01l0.22%2C0.35l0.45%2C0.43l0.15%2C0.04l0.29%2C0.34h0.35l0.62%2C0.39l0.06%2C0.22l-0.24%2C0.15l0.07%2C0.08h0.1l0.01%2C0.12l0.41%2C0.09l-0.01%2C-0.2l-0.07%2C-0.08l0.14%2C-0.03l0.24%2C0.38l-0.08%2C0.03l-0.11%2C-0.08l0.05%2C0.16l0.19%2C0.03l0.04%2C-0.05l0.31%2C0.15l0.26%2C0.01l0.31%2C0.11l0.36%2C-0.13l0.09%2C0.09l0.6%2C0.2l0.01%2C0.15l-0.22%2C-0.05l-0.1%2C0.08l0.03%2C-0.19l-0.08%2C0.03l-0.09%2C-0.08l-0.2%2C0.03l0.04%2C0.08l0.16%2C-0.07l0.09%2C0.12l-0.11%2C0.35l0.09%2C0.46l-0.13%2C0.08l0.02%2C0.19l0.74%2C-0.17l0.03%2C-0.05l-0.13%2C0.01l-0.01%2C-0.08l0.35%2C-0.16l0.09%2C-0.28l-0.05%2C-0.11l0.12%2C-0.07l-0.04%2C-0.09l0.09%2C-0.01l0.19%2C0.08l0.14%2C0.42h0.07l0.03%2C-0.07l0.19%2C0.19l0.02%2C0.16l0.21%2C0.08l0.32%2C-0.09l0.39%2C0.01l0.25%2C0.13l0.42%2C0.13l0.14%2C0.13l0.08%2C-0.11l0.14%2C-0.01l0.5%2C0.13l0.08%2C0.24l0.08%2C-0.01l0.05%2C-0.15l0.1%2C-0.03l0.67%2C-0.03l0.2%2C0.07l0.13%2C0.16l0.15%2C-0.03l0.04%2C0.09l0.51%2C0.03l0.17%2C0.07l0.06%2C0.09l0.17%2C-0.01l0.15%2C0.07l0.04%2C0.12l0.15%2C0.08l0.26%2C0.05l1.2%2C-0.05l0.05%2C0.07l0.39%2C-0.04l0.24%2C-0.13l-0.04%2C0.13l0.29%2C0.07l0.07%2C0.15l0.17%2C0.11l0.29%2C-0.03l0.29%2C0.07l0.08%2C-0.13l0.15%2C0.08l0.24%2C-0.16l0.19%2C0.03l0.05%2C0.09l0.13%2C-0.04l0.09%2C0.05l0.08%2C0.13l-0.05%2C0.23l0.15%2C0.3l0.16%2C0.08l0.04%2C0.16l0.1%2C-0.03l0.05%2C0.07v0.13l0.13%2C-0.04l0.13%2C0.09l0.49%2C-0.01l0.13%2C0.17l0.16%2C0.07l0.13%2C-0.07l0.29%2C0.04l0.2%2C0.31l-0.04%2C0.17l0.3%2C0.25l0.11%2C0.19l0.1%2C-0.01l0.08%2C0.11l0.26%2C0.03l0.16%2C-0.08l0.01%2C0.57l0.31%2C0.55l0.55%2C0.25l0.2%2C0.27l0.19%2C0.56l0.09%2C0.09l0.06%2C0.66l0.16%2C0.24v0.52l0.15%2C0.48l0.06%2C0.5l0.22%2C0.5l0.11%2C0.03l0.09%2C0.22l0.11%2C0.05l-0.06%2C0.15l0.17%2C0.17l0.07%2C0.19l0.49%2C0.36l0.2%2C0.28l0.13%2C0.03l0.26%2C0.2l-0.04%2C0.05l0.08%2C0.13l0.11%2C0.01l0.2%2C0.25l0.35%2C0.12l0.1%2C0.15l0.16%2C0.03l0.1%2C0.13l0.61%2C0.32l0.11%2C0.16l0.24%2C0.15l0.37%2C0.08l0.51%2C0.31h0.1l0.15%2C-0.19l0.21%2C-0.01l0.56%2C0.51l-0.05%2C0.42l-0.12%2C0.19l0.01%2C0.6l0.29%2C0.79v0.25l0.56%2C1.01l0.2%2C0.08l0.39%2C0.35l0.24%2C0.01l0.72%2C0.46l0.29%2C0.04l0.09%2C0.16l0.13%2C0.03l0.62%2C0.43l0.15%2C0.07l0.49%2C-0.01l0.28%2C0.23l0.6%2C0.21l0.47%2C0.32l0.44%2C0.11l0.06%2C0.16l0.14%2C0.01l0.21%2C0.21l0.29%2C0.04l0.03%2C0.08l0.26%2C0.13l0.19%2C0.39l0.25%2C0.01l0.04%2C0.08l0.15%2C0.01l0.24%2C0.25h0.07l-0.07%2C0.2l0.67%2C0.4l-0.01%2C0.08l0.39%2C0.31l0.01%2C0.23l0.25%2C0.08l-0.04%2C0.12l0.15%2C0.15l0.13%2C0.07l0.11%2C-0.07l0.3%2C0.16l0.15%2C-0.04l0.02%2C0.11l0.11%2C0.01l0.05%2C0.11l-0.08%2C0.07l-0.01%2C0.35l0.21%2C0.38l0.86%2C0.44l0.19%2C0.32l-0.03%2C0.07l0.19%2C0.2h0.11l0.11%2C0.25l0.13%2C0.01l0.26%2C-0.11l0.3%2C0.08l0.21%2C0.29l-0.06%2C0.13l0.04%2C0.12l0.29%2C0.13l0.13%2C0.33l0.24%2C0.05l0.01%2C0.11l0.16%2C0.11l0.09%2C0.07l0.05%2C0.13h0.22l0.76%2C0.32l0.14%2C-0.01l0.05%2C-0.11l0.36%2C0.08l0.3%2C-0.13l0.21%2C0.05l0.06%2C0.08l0.14%2C-0.12l-0.04%2C-0.12l0.05%2C-0.17l-0.17%2C-0.04v-0.12l0.01%2C-0.05h0.14l0.19%2C0.32l0.29%2C0.29l0.57%2C0.38l-0.08%2C0.75l0.05%2C0.04l0.1%2C-0.11l0.14%2C0.6l0.34%2C0.24l0.55%2C0.25l0.3%2C0.29l0.11%2C0.03l0.15%2C0.36l0.38%2C0.42l0.13%2C0.27l0.35%2C0.08l0.29%2C0.19l0.4%2C0.03l0.12%2C0.05v0.05l0.2%2C0.01l0.03%2C0.08l0.51%2C0.36l0.08%2C0.12l0.29%2C-0.04l0.05%2C0.4l-126.12%2C2.59l0%2C0l3.3%2C-9.78l9.41%2C-1.76l0.26%2C-0.09l0.97%2C-0.12l4.12%2C-0.76l0.33%2C-0.11l0.79%2C-0.08l1.37%2C-0.25l0.1%2C-0.08l1.01%2C-0.11l5.51%2C-1.02l11.66%2C-27.08l1.18%2C0.28l10.54%2C3.13l2.18%2C-2.06l0%2C0L554.82%2C723.37z%22%2F%3E%0A%09%09%3Cpath%20fill%3D%22white%22%20stroke%3D%22none%22%20id%3D%22EG-SUZ%22%20title%3D%22As%20Suways%22%20%20d%3D%22M387.03%2C433.03L387.81%2C418.79L390%2C393.32L390.04%2C388.97L388.76%2C380.38L388.11%2C375.5L386.88%2C371.24L386.88%2C371.24L386.76%2C368.47L386.76%2C368.47L388.67%2C368.29L407.29%2C368.18L409.93%2C368.99L416.07%2C369.42L417.8%2C368.01L422.41%2C367.49L422.41%2C367.49L428.26%2C367.77L428.26%2C367.77L429.31%2C371.63L429.18%2C383.02L430.72%2C383.16L430.72%2C383.16L430.72%2C385.82L430.72%2C385.82L428.15%2C386.41L421.22%2C391.61L421.22%2C391.61L420.98%2C391.27L420.83%2C391.17L420.71%2C390.71L420.58%2C390.49L420.43%2C390.48L420.38%2C390.29L419.98%2C389.92L419.55%2C389.88L419.42%2C389.76L419.52%2C389.61L420.2%2C388.99L420.19%2C388.91L420.46%2C388.51L420.34%2C388.15L420.52%2C387.87L420.58%2C387.56L420.58%2C387.37L420.49%2C387.2L420.27%2C387.02L420.14%2C387.06L419.84%2C386.59L419.32%2C386.03L418.81%2C385.73L418.68%2C385.81L418.55%2C385.24L418.29%2C384.91L417.92%2C384.77L417.87%2C384.82L417.92%2C385.08L417.67%2C385.14L417.72%2C385.22L417.67%2C385.3L417.44%2C384.84L417.3%2C384.85L417.2%2C384.78L417.27%2C384.62L417.52%2C384.47L417.21%2C384.34L417.42%2C384.08L417.39%2C383.89L417.21%2C383.95L417.15%2C383.85L417.14%2C384.02L417.05%2C384.02L417.05%2C383.88L417.12%2C383.79L417.17%2C383.75L417.17%2C383.65L417.07%2C383.71L417.01%2C383.58L417.39%2C383.33L417.55%2C383.13L417.44%2C382.87L417.15%2C382.56L417.05%2C382.5L417.05%2C382.69L416.74%2C382.73L416.51%2C382.86L416.08%2C382.89L416.08%2C383.05L416.01%2C383.09L416.34%2C383.59L416.18%2C383.53L415.98%2C383.13L415.79%2C382.93L415.69%2C382.87L415.4%2C382.9L415.59%2C390.72L414.37%2C392.11L412.45%2C393.51L411.05%2C395.95L410.7%2C399.09L410%2C402.76L410.11%2C405.77L410.73%2C406.06L410.91%2C406.24L411.2%2C406.4L411.33%2C406.57L411.42%2C406.58L411.5%2C406.71L412.06%2C406.9L412.24%2C407.18L412.36%2C407.61L412.73%2C407.8L412.97%2C408.11L413.27%2C408.27L413.38%2C408.37L413.43%2C408.52L413.55%2C408.58L413.5%2C408.75L413.59%2C408.82L413.67%2C409.05L413.77%2C409.12L413.94%2C409.08L414.03%2C409.21L414.28%2C409.22L414.59%2C409.42L414.6%2C409.76L414.54%2C409.89L414.82%2C410.26L414.92%2C410.25L415.23%2C410.38L415.29%2C410.58L415.84%2C410.78L416.01%2C411.03L416.45%2C411.3L416.53%2C411.49L416.75%2C411.55L416.88%2C411.66L416.94%2C411.82L417.24%2C412.05L417.26%2C412.13L417.51%2C412.19L417.64%2C412.52L417.9%2C412.74L417.79%2C412.93L417.84%2C413.13L418.02%2C413.23L418.16%2C413.27L418.24%2C413.7L418.38%2C413.97L418.72%2C414.21L418.81%2C414.4L418.76%2C414.65L418.91%2C414.91L419.15%2C415.83L419.1%2C416.03L419.17%2C416.22L419.12%2C416.32L419.16%2C416.5L419.37%2C416.88L419.46%2C416.88L419.53%2C416.99L419.5%2C417.1L419.36%2C417.15L419.31%2C417.23L419.35%2C417.67L419.82%2C418.01L419.81%2C418.14L419.91%2C418.23L419.92%2C418.4L419.81%2C418.43L419.79%2C418.71L419.86%2C418.85L420.07%2C418.98L420.16%2C419.11L420.24%2C419.14L420.27%2C419.45L420.46%2C419.71L420.38%2C419.92L420.23%2C419.95L420.33%2C420.09L420.29%2C420.3L420.16%2C420.53L420.33%2C420.72L420.26%2C420.85L420.36%2C420.89L420.36%2C421.06L420.52%2C421.42L420.43%2C421.46L420.29%2C421.27L420.28%2C421.44L420.31%2C421.51L420.47%2C421.54L420.73%2C421.8L420.79%2C422.1L420.92%2C422.33L420.84%2C422.67L420.94%2C422.67L420.98%2C422.82L421.18%2C422.85L421.18%2C422.95L421.17%2C423.04L421.19%2C423.18L421.08%2C423.26L421.11%2C423.46L421.26%2C423.65L421.17%2C423.76L421.21%2C423.95L421.14%2C424.05L421.26%2C424.2L421.24%2C424.43L421.36%2C424.53L421.28%2C424.66L421.28%2C424.77L421.37%2C424.87L421.36%2C425.28L421.49%2C425.31L421.53%2C425.41L421.53%2C425.41L416.16%2C425.6L412.22%2C427.94L407.94%2C429.11L399.91%2C434.05L393.28%2C434.15L388.12%2C435.13L388.12%2C435.13L388.12%2C435.13L388.12%2C435.13z%22%2F%3E%0A%09%09%3Cpath%20fill%3D%22white%22%20stroke%3D%22none%22%20id%3D%22EG-WAD%22%20title%3D%22Al%20W%C4%81d%C4%AB%20al%20Jad%C4%ABd%22%20%20d%3D%22M243.36%2C499.36L333.49%2C499.54L333.58%2C501.49L333.58%2C501.49L332.54%2C501.59L332.45%2C503.83L333.23%2C504.61L333.4%2C506.55L334.43%2C507.02L334.88%2C509.57L335.83%2C511.61L337.22%2C513.46L337.74%2C515.6L338.87%2C517.25L340.26%2C518.03L344.2%2C521.88L346.31%2C523.76L347.3%2C524.29L349.46%2C524.53L351.11%2C524.92L353.8%2C526.47L355.51%2C529.28L357.31%2C532.99L359.15%2C537.28L361.39%2C540.99L361.39%2C540.99L361.91%2C542.82L364.43%2C546.08L367.43%2C549.54L369.94%2C550.01L371.95%2C551.54L373.04%2C553.41L375.17%2C556.46L377.12%2C559.39L379.33%2C562.23L379.47%2C562.5L380.54%2C563.74L382.86%2C567.21L385.73%2C570.97L387.17%2C572.56L388.07%2C572.94L389.69%2C575.29L390.5%2C576.28L390.5%2C576.28L392.91%2C579.21L392.91%2C579.21L397.77%2C583.45L399.37%2C584.08L404.19%2C583.95L405.62%2C583.51L407.69%2C583.13L409.53%2C583L411.42%2C582.36L412.57%2C581.66L416.76%2C579.95L418.66%2C578.55L421.24%2C577.53L423.82%2C577.66L424.74%2C578.42L425.96%2C580.69L426.21%2C582.95L424.88%2C584.92L423.33%2C587.65L422.82%2C589.23L422.82%2C591.9L422.13%2C593.42L420.46%2C595.39L417.82%2C597.86L415.18%2C599L413.4%2C600.83L412.48%2C602.86L412.37%2C605.2L413.01%2C606.28L414.16%2C608.77L414.31%2C611.89L415.08%2C613.41L414.89%2C614.96L415.31%2C617.95L416.53%2C621.15L417.79%2C622.12L420.25%2C624.31L422.69%2C625.51L422.69%2C625.51L426.18%2C627.13L428.86%2C629.65L430.46%2C631.66L430.85%2C633.51L430.82%2C636.11L430.88%2C638.28L432.05%2C641.84L432.61%2C644.03L434.41%2C647.51L433.85%2C650.83L433.85%2C653.71L433.19%2C657.2L432.44%2C660.68L432.42%2C664.1L431.83%2C668.3L431.83%2C671.26L431.44%2C677.71L427.7%2C681.62L425.86%2C682.54L424.58%2C683.03L423.19%2C684.42L423.36%2C687.56L425.47%2C689.6L426.96%2C690.81L427.28%2C692.07L425.16%2C693.79L423.15%2C694.35L420.96%2C695.26L418.67%2C696.62L417.11%2C697.64L415.7%2C699.65L413.99%2C705.58L413.63%2C708.86L415.02%2C710.51L420.2%2C711.74L422.88%2C712.1L424.6%2C711.71L426.67%2C711.6L427.15%2C713.58L426.85%2C714.54L425.43%2C716.9L423.74%2C719.43L422.2%2C722.67L420.88%2C724.94L419.19%2C727.64L417.94%2C730.44L417.15%2C732.81L415.92%2C734.99L414.97%2C737L413.27%2C740.32L411.63%2C741.24L410.13%2C740.58L408.19%2C739.36L405.62%2C738.85L403.03%2C738.59L402.05%2C738.21L396.56%2C739.83L387.92%2C742.25L385.66%2C742.99L384.05%2C743.22L382%2C742.99L379.23%2C743.01L378.06%2C743.51L376.59%2C745.25L375.75%2C747.08L375.96%2C749.3L375.96%2C753.63L376.19%2C755.23L375.71%2C756.81L374.88%2C758.38L372.96%2C760.54L370%2C763.27L366%2C763.15L362.99%2C764.06L358.67%2C766.29L357.89%2C769.04L359.4%2C771.26L362.07%2C771L362.07%2C771L363%2C771.08L363.18%2C773.24L362.77%2C774.14L362.7%2C775L361.46%2C778.47L358.83%2C778.41L348.78%2C778.45L346.14%2C778.37L339.76%2C778.46L339.28%2C778.39L302.21%2C778.53L302.21%2C778.82L296.7%2C778.56L287.22%2C778.51L271.53%2C778.57L271.29%2C778.49L268.4%2C778.52L246.82%2C778.41L242.7%2C778.46L217.98%2C778.42L217.15%2C778.49L215.11%2C778.51L213.22%2C778.42L203.28%2C778.44L201.74%2C778.39L197.73%2C778.47L195.9%2C778.41L165.05%2C778.53L146.46%2C778.44L144.74%2C778.49L143.87%2C778.43L139.35%2C778.5L83.8%2C778.57L77.54%2C778.82L77.54%2C499.49L77.54%2C499.49L78.35%2C499.48L78.35%2C499.48L184.45%2C499.5L184.45%2C499.5L185.13%2C499.5L185.13%2C499.5z%22%2F%3E%0A%09%3C%2Fg%3E%0A%3C%2Fsvg%3E)
Choropleth Map of Egypt (مصر)
Regionify is a choropleth map tool that turns regional data into clear, publish-ready visualizations. Color administrative divisions by any numeric metric — GDP per capita, population density, election results, or your own dataset — then export as PNG, SVG, animated GIF, or an embeddable iframe. No GIS expertise required.
Create your map of EgyptWhat you can create for Egypt with Regionify
From static maps to animated time-series — every format, ready to export.
Egypt choropleth map
Visualize Egypt's 29 governorates as a choropleth map. Color regions by any numeric dataset — population, GDP, unemployment, health outcomes, and more. Export as PNG, JPEG, or PDF.
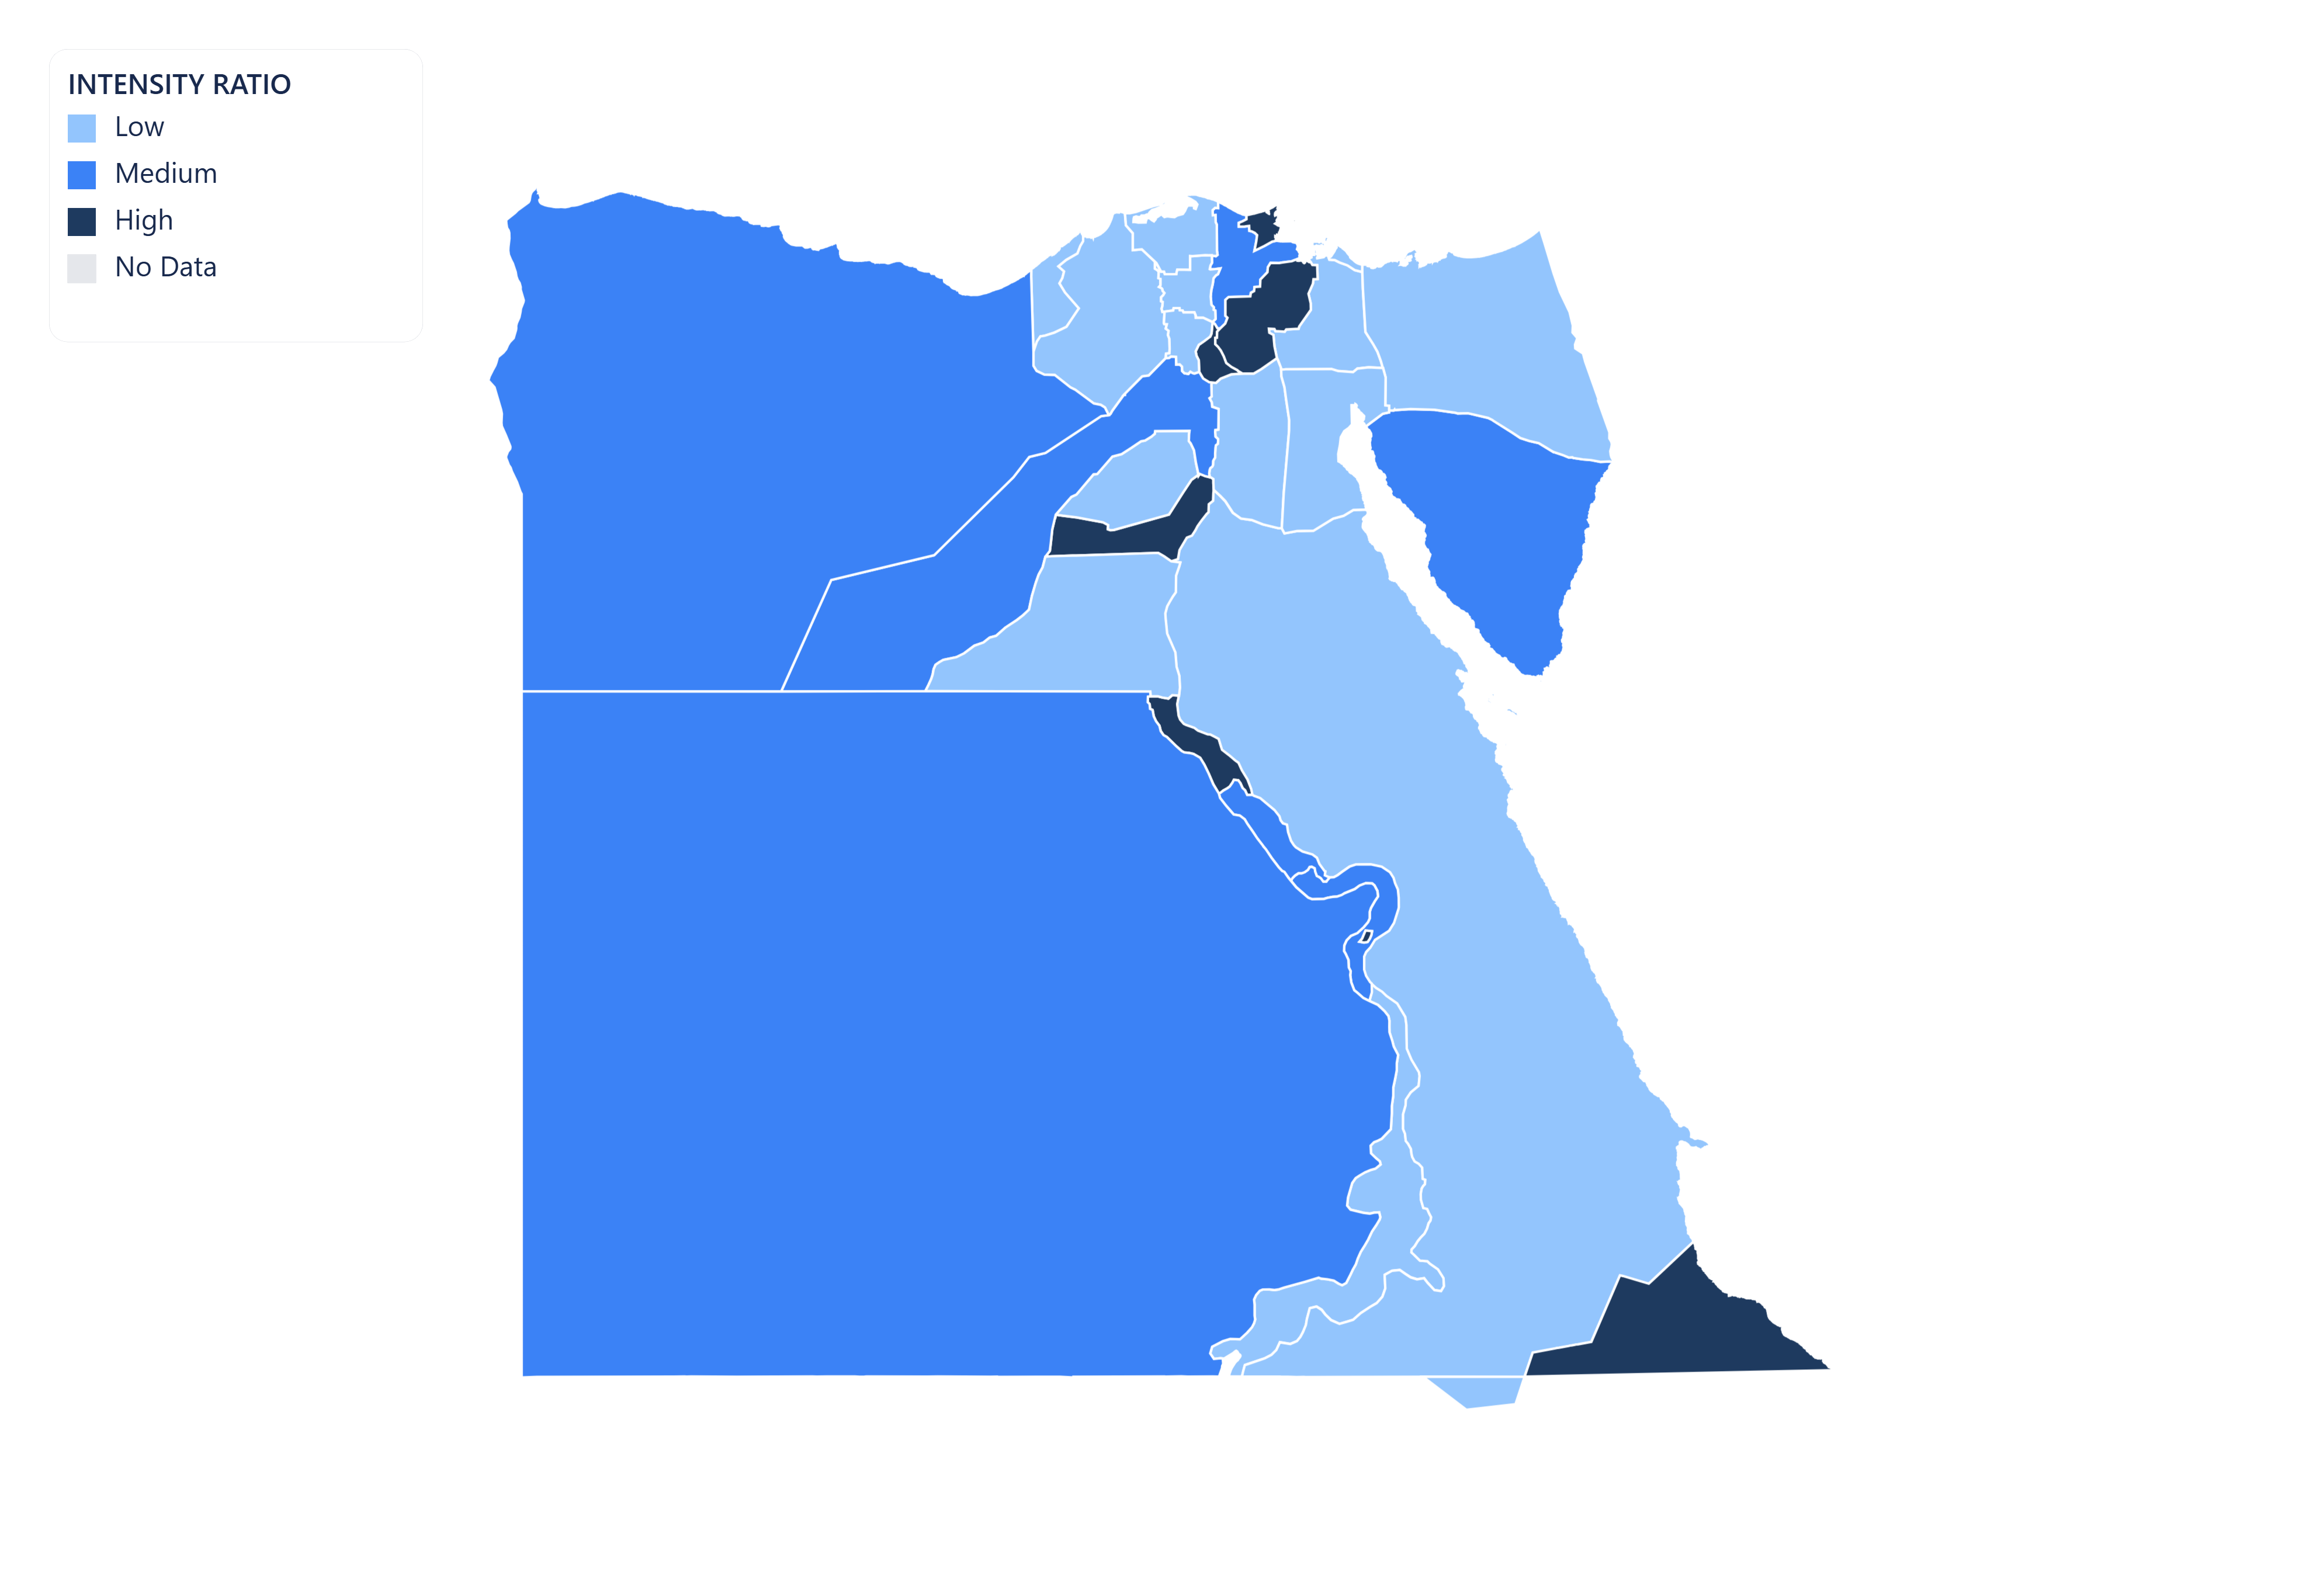
Vector SVG export
Export your Egypt map as a scalable vector graphic (SVG). Ideal for print publications, editorial illustrations, and web use — scales to any resolution without quality loss.

Animated GIF
Bring your Egypt data to life. Import historical time-series data and export a looping animated GIF showing how regional values changed over time.
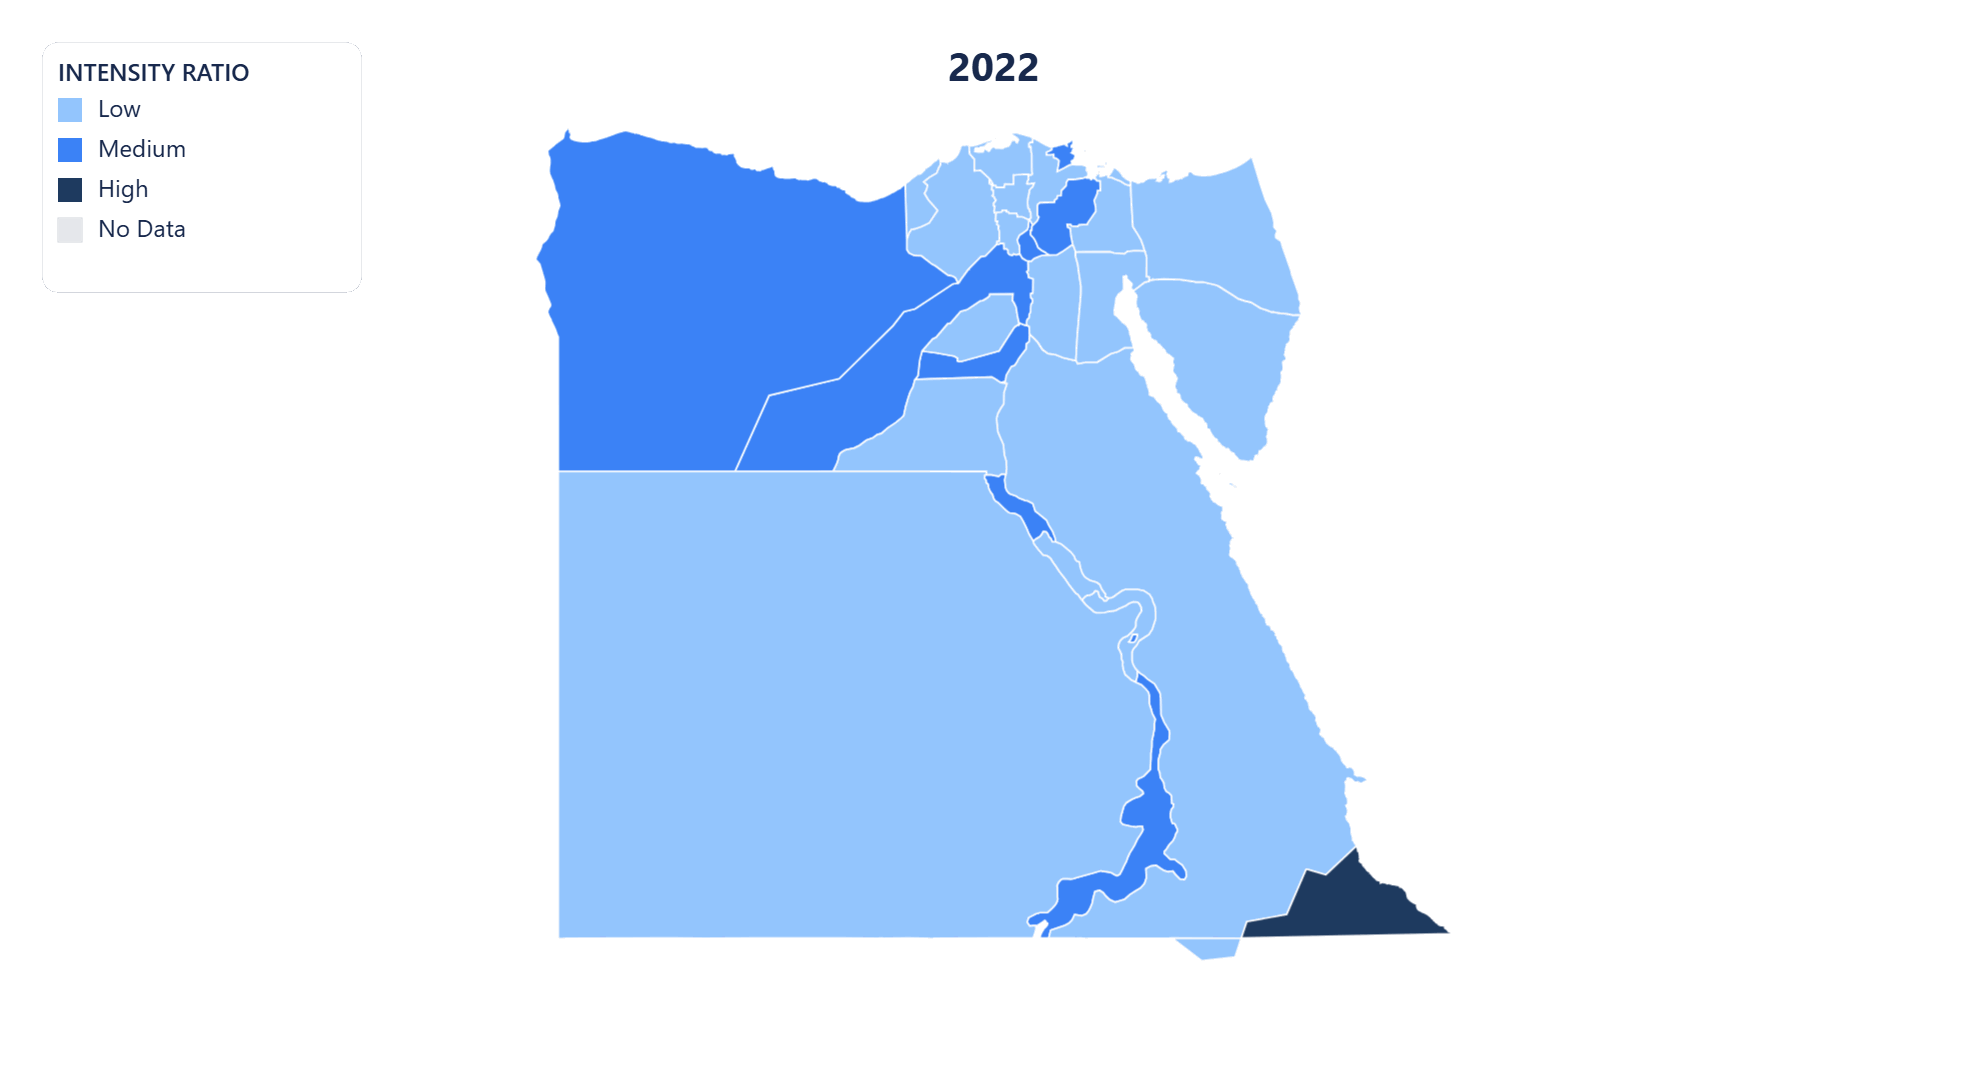
MP4 video export
Export your Egypt time-series map as an MP4 video. Perfect for presentations, reports, and social media posts where motion communicates change more clearly than static images.
Public share page
Share your Egypt choropleth map with a public link. Anyone with the URL can view the full interactive map — no account or login required.
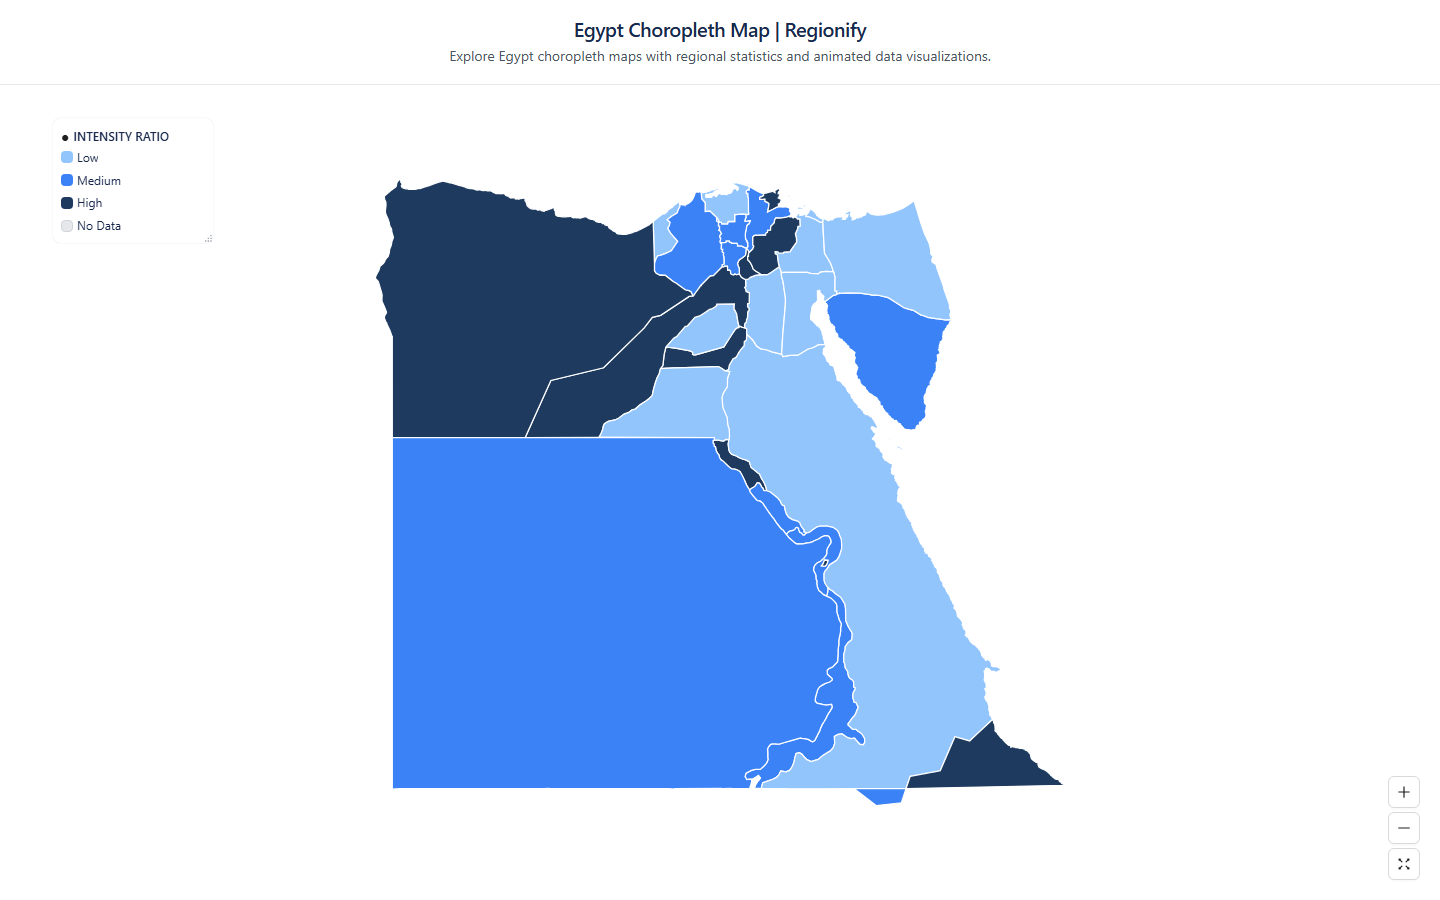
Embeddable iframe
Embed your Egypt choropleth map anywhere with a single line of HTML. The iframe stays live — viewers always see the latest version of your map, no re-publishing needed.
AI-powered data import for Egypt maps
No spreadsheet? No problem. Regionify's AI Agent turns a plain-text description or raw pasted data into a ready-to-visualize dataset in seconds.
AI Generator
Generate Egypt data from a prompt
Describe the dataset you need in plain English — for example "GDP per capita of Egypt's 29 governorates in 2023" or "election results by governorates" — and the AI generates a plausible, structured dataset that maps directly onto Egypt's administrative boundaries. Edit any values in the table view before saving.
- ✓ Works for population, GDP, health, election, and custom metrics
- ✓ Supports time-series prompts for animated maps
- ✓ Output pre-matched to Egypt's 29 governorates
AI Parser
Clean and import messy Egypt data
Paste raw text, a copied Wikipedia table, or an unstructured CSV with regional figures for Egypt. The AI parser normalises region names, strips noise, resolves mismatched spelling across Egypt's governorates, and outputs a clean id–label–value table ready to visualise.
- ✓ Handles inconsistent or misspelled governorates names
- ✓ Auto-detects time columns for historical data
- ✓ Streams results in real time as AI processes
AI Agent is available on the Chronographer plan.
Governorates of Egypt
- Al Iskandarīyah
- Aswān
- Asyūţ
- Al Baḩr al Aḩmar
- Al Buḩayrah
- Banī Suwayf
- Al Qāhirah
- Ad Daqahlīyah
- Dumyāţ
- Al Fayyūm
- Al Gharbīyah
- Al Jīzah
- Al Ismāٰīlīyah
- Janūb Sīnā'
- Al Qalyūbīyah
- Kafr ash Shaykh
- Qinā
- Al Uqşur
- Al Minyā
- Al Minūfīyah
- Maţrūḩ
- Būr Saٰīd
- Sūhāj
- Ash Sharqīyah
- Shamāl Sīnā'
- Disputed Territory
- Hala'Ib Triangle
- As Suways
- Al Wādī al Jadīd
Build your own Egypt choropleth map — free
Upload any dataset, color Egypt's governorates by any numeric metric, and export as PNG, SVG, GIF, or MP4. No design skills required — start in seconds, publish anywhere.