%20ammap.com%20%7C%20SVG%20map%20of%20Iraq%20-%20High%20--%3E%0A%3Csvg%20xmlns%3D%22http%3A%2F%2Fwww.w3.org%2F2000%2Fsvg%22%20xmlns%3Aamcharts%3D%22http%3A%2F%2Famcharts.com%2Fammap%22%20xmlns%3Axlink%3D%22http%3A%2F%2Fwww.w3.org%2F1999%2Fxlink%22%20version%3D%221.1%22%20viewBox%3D%220%200%20820%201250%22%20width%3D%22100%25%22%20height%3D%22100%25%22%20preserveAspectRatio%3D%22xMidYMid%20slice%22%3E%0A%09%3Cdefs%3E%0A%09%09%0A%0A%09%09%3Camcharts%3Aammap%20projection%3D%22mercator%22%20leftLongitude%3D%2238.793603%22%20topLatitude%3D%2237.380645%22%20rightLongitude%3D%2248.575916%22%20bottomLatitude%3D%2229.061208%22%3E%3C%2Famcharts%3Aammap%3E%0A%0A%09%09%3C!--%20All%20areas%20are%20listed%20in%20the%20line%20below.%20You%20can%20use%20this%20list%20in%20your%20script.%20--%3E%09%09%3C!--%7Bid%3A%22IQ-BB%22%7D%2C%7Bid%3A%22IQ-AN%22%7D%2C%7Bid%3A%22IQ-DI%22%7D%2C%7Bid%3A%22IQ-SU%22%7D%2C%7Bid%3A%22IQ-WA%22%7D%2C%7Bid%3A%22IQ-MA%22%7D%2C%7Bid%3A%22IQ-DQ%22%7D%2C%7Bid%3A%22IQ-QA%22%7D%2C%7Bid%3A%22IQ-MU%22%7D%2C%7Bid%3A%22IQ-BA%22%7D%2C%7Bid%3A%22IQ-BG%22%7D%2C%7Bid%3A%22IQ-KA%22%7D%2C%7Bid%3A%22IQ-NA%22%7D%2C%7Bid%3A%22IQ-SD%22%7D%2C%7Bid%3A%22IQ-NI%22%7D%2C%7Bid%3A%22IQ-AR%22%7D%2C%7Bid%3A%22IQ-KI%22%7D%2C%7Bid%3A%22IQ-DA%22%7D--%3E%0A%0A%09%3C%2Fdefs%3E%0A%09%3Cg%3E%0A%09%09%3Cpath%20fill%3D%22white%22%20stroke%3D%22none%22%20id%3D%22IQ-BB%22%20title%3D%22Babil%22%20%20d%3D%22M445.01%2C424.36L443.22%2C423.81L438%2C420.71L435.97%2C420.1L434%2C419.82L426.23%2C419.77L419%2C417.85L415.3%2C417.36L412.53%2C417.74L412.94%2C419.8L414.03%2C421.17L418.06%2C422.17L426%2C426.19L428.49%2C428.69L430.45%2C434.47L431.9%2C441.77L432.91%2C444.39L435.15%2C446.95L438.71%2C449.44L437.79%2C458.68L440.05%2C459.02L442.9%2C459.8L443.33%2C459.86L443.71%2C459.8L444.59%2C459.31L445.02%2C459.13L445.4%2C459.11L445.9%2C459.31L446.46%2C459.73L448.44%2C461.75L448.77%2C462.52L448.79%2C463.09L448.84%2C464.19L448.08%2C465L445.2%2C475.52L445.38%2C479.15L446.73%2C482.44L451.33%2C489.19L451.91%2C491.13L451.13%2C493.06L450.73%2C494.65L451.33%2C496.67L453.03%2C500.02L453.29%2C501.07L454.45%2C505.7L455.01%2C506.62L455.51%2C507.13L455.18%2C508.79L453.21%2C509.9L452.61%2C510.88L452.74%2C511.93L453.38%2C513.72L454.93%2C516.21L455.46%2C516.83L456.07%2C517.77L456.47%2C518.59L457.71%2C520.25L460.62%2C517.47L462.31%2C516.31L462.69%2C516.33L463.36%2C516.19L463.99%2C516.26L468.01%2C513.37L470.24%2C514.56L472.06%2C516.1L474.49%2C517.5L478.64%2C518.86L481.09%2C519.64L485.61%2C522.39L486.67%2C522.79L487.65%2C522.78L488.42%2C522.52L489.1%2C522.14L489.65%2C521.63L491.22%2C519.69L491.7%2C519.3L492.93%2C518.56L493.37%2C518.2L493.72%2C517.67L493.78%2C516.96L493.67%2C516.08L493.02%2C515.49L492.66%2C515.08L492.53%2C514.63L492.76%2C513.96L493.24%2C513.11L494.03%2C512.26L494.63%2C511.98L495.12%2C512.03L495.59%2C512.42L496.52%2C513.37L497.03%2C513.62L497.58%2C513.3L499.98%2C511.03L503.56%2C508.28L508.81%2C506.13L515.83%2C501.43L516.39%2C500.91L517.38%2C499.69L518.36%2C498.96L522.01%2C496.74L523.16%2C496.29L523.87%2C496.1L525.06%2C496.16L524.93%2C494.15L524.7%2C491.12L523.65%2C491.1L518.77%2C490.88L517.4%2C490.49L516.08%2C489.57L514.51%2C487.99L513.09%2C486.18L509.9%2C478.97L506.4%2C467.35L505.9%2C466.3L504.79%2C465.08L503.63%2C464.15L501.53%2C462.96L498.88%2C461.83L498.44%2C461.09L497.74%2C460.85L494.76%2C460.57L490.63%2C459.26L485.44%2C456.28L484.88%2C456.14L473.32%2C455.32L472.82%2C455.13L472.43%2C454.83L471.87%2C454.3L471.33%2C452.76L470.83%2C450.36L470.55%2C440.5L469.94%2C437.6L471.3%2C436.82L471.78%2C435.46L471.82%2C431.67L471.51%2C429.61L470.87%2C427.21L469.41%2C423.47L468.39%2C421.4L468.43%2C420.25L468.42%2C420.25L454.87%2C419.56L452.78%2C418.97L451.73%2C418.8L450.66%2C418.96L448.22%2C422.4L446.73%2C423.87L445.01%2C424.36z%22%2F%3E%0A%09%09%3Cpath%20fill%3D%22white%22%20stroke%3D%22none%22%20id%3D%22IQ-AN%22%20title%3D%22Al-Anbar%22%20%20d%3D%22M267.91%2C244.29L262.6%2C243.94L251.81%2C239.71L229.45%2C230.42L223.97%2C229.54L210.17%2C225.57L199.68%2C224.58L197.93%2C224.53L198.4%2C240.98L199.09%2C258.38L198.9%2C260.98L198.2%2C263.43L184.18%2C290.64L184.18%2C290.65L181.25%2C297.16L179.39%2C299.8L177%2C301.36L156.95%2C306.76L144.97%2C314.02L135.94%2C319.5L126.91%2C324.96L117.88%2C330.43L114.7%2C332.35L108.85%2C335.89L99.82%2C341.35L90.8%2C346.8L81.76%2C352.24L72.74%2C357.69L63.71%2C363.13L54.67%2C368.57L45.64%2C374L36.61%2C379.43L27.58%2C384.86L18.55%2C390.29L9.52%2C395.71L0.49%2C401.13L4.29%2C415.07L7.68%2C427.59L10.51%2C437.95L14.23%2C451.77L18.09%2C466.02L23.57%2C486.28L17.27%2C488.27L17.16%2C488.3L17.13%2C488.37L17.16%2C488.49L17.27%2C488.65L21.25%2C502.55L21.86%2C504L22.69%2C504.47L38.16%2C500.18L39.84%2C501.17L41.04%2C504.14L42.75%2C510.65L40.66%2C513.71L30.84%2C522.1L30.86%2C522.84L31.09%2C522.77L31.33%2C522.69L31.56%2C522.61L31.79%2C522.53L47.94%2C525.31L64.09%2C528.09L80.23%2C530.87L96.37%2C533.64L102.92%2C534.76L102.93%2C534.76L102.94%2C534.76L102.96%2C534.77L130.8%2C540.15L135.2%2C541.87L139.75%2C544.54L148.14%2C549.58L155.3%2C553.88L162.48%2C558.16L169.64%2C562.46L176.8%2C566.75L183.96%2C571.04L191.13%2C575.32L198.29%2C579.6L205.46%2C583.89L212.62%2C588.16L219.77%2C592.44L226.94%2C596.72L234.11%2C600.99L241.27%2C605.26L248.43%2C609.53L255.6%2C613.79L262.76%2C618.06L270.04%2C622.39L275.45%2C627.1L282.36%2C633.1L289.26%2C639.09L296.15%2C645.08L303.06%2C651.06L310.8%2C657.81L318.53%2C664.55L326.27%2C671.29L327.86%2C672.67L328.47%2C671.71L330.59%2C666.62L335.89%2C656.71L338.32%2C650.85L339.36%2C647.52L340.36%2C639.13L340.64%2C638.19L341.25%2C636.76L344.06%2C631.94L348.66%2C625.42L349.26%2C624.11L349.8%2C622.11L350.35%2C617.44L350.62%2C616.25L353.84%2C607.75L354.18%2C605.7L354.12%2C604.29L353.81%2C603.6L353.66%2C602.79L353.66%2C601.53L353.89%2C599.88L354.65%2C597.56L363.32%2C578.93L364.52%2C575.38L364.98%2C572.7L365.08%2C569.64L366.24%2C567.53L378.95%2C548.63L381.31%2C546.06L382.82%2C544.9L384.15%2C544.28L385.85%2C544.12L386.48%2C543.97L388.91%2C542.36L389.88%2C541.95L395.08%2C541.14L396.4%2C540.65L397.49%2C539.97L399.57%2C538.29L407.17%2C534.06L408.57%2C532.72L410.01%2C530.98L410.44%2C528.09L410.53%2C526.19L401.94%2C517.99L397.99%2C514.62L384.53%2C504.5L365.29%2C484.97L363.32%2C482.01L362.75%2C479.07L367.1%2C476.77L370.93%2C475.31L380.93%2C473.89L382.67%2C473.64L383.56%2C473.39L385.77%2C471.93L401.05%2C458.39L407.52%2C455.22L414.44%2C454.35L423.79%2C454.35L437.79%2C458.68L438.71%2C449.44L435.15%2C446.95L432.91%2C444.39L431.9%2C441.77L430.45%2C434.47L428.49%2C428.69L426%2C426.19L418.06%2C422.17L414.03%2C421.17L412.94%2C419.8L412.53%2C417.74L415.3%2C417.36L419%2C417.85L426.23%2C419.77L434%2C419.82L435.97%2C420.1L438%2C420.71L443.22%2C423.81L445.01%2C424.36L446.73%2C423.87L448.22%2C422.4L450.66%2C418.96L449.71%2C417.93L447.52%2C416.55L446.57%2C415.6L445.76%2C413.92L445.37%2C411.93L445.35%2C409.88L445.68%2C408L446.65%2C406.08L449.23%2C403.3L450.01%2C401.39L450%2C400.89L449.89%2C400.46L449.65%2C400.53L447.19%2C395.1L441.17%2C394.74L438.4%2C392.81L435.37%2C391.91L438.1%2C389.77L437.29%2C388.87L435.5%2C385.77L432.94%2C379.35L431.44%2C376.55L430.17%2C375.15L427.32%2C372.55L424.85%2C371.81L411.15%2C372.15L403.75%2C369.69L393.72%2C365.65L384.95%2C364.17L380.63%2C362.56L369.4%2C352.72L356.31%2C339.52L350.71%2C332.02L346.43%2C321.59L345.62%2C316.37L344.38%2C311.09L342.29%2C308.07L341.65%2C305.11L341.27%2C298.96L339.73%2C290.49L329.96%2C296.08L327.35%2C295.72L323.81%2C293.7L307.96%2C280.63L304.7%2C266.25L304.58%2C244.5L304%2C243.1L286.2%2C245.52L283.73%2C244.45L280.87%2C243.1L279.39%2C242.78L267.91%2C244.29z%22%2F%3E%0A%09%09%3Cpath%20fill%3D%22white%22%20stroke%3D%22none%22%20id%3D%22IQ-DI%22%20title%3D%22Diyala%22%20%20d%3D%22M573.88%2C250.04L573.88%2C250.04L573.36%2C248.93L572.58%2C239.79L572.68%2C239.11L572.87%2C238.94L573.1%2C238.98L573.73%2C238.92L574.06%2C238.96L574.42%2C239.1L574.74%2C239.16L575.14%2C239.15L575.51%2C239.06L575.83%2C238.95L576.08%2C238.78L575.2%2C237.35L569.62%2C231.4L569.16%2C230.68L568.78%2C230.28L568.16%2C229.75L567.62%2C229.41L567.09%2C229.42L566.6%2C229.73L565.88%2C230.52L565.77%2C231.03L565.7%2C231.71L565.4%2C232.22L564.96%2C232.84L564.08%2C233.87L563.66%2C234.52L563.32%2C235.33L563.1%2C235.7L562.44%2C236.02L562.22%2C236.16L561.98%2C236.38L561.78%2C236.49L561.65%2C236.43L561.63%2C236.22L561.65%2C235.94L561.58%2C235.72L561.4%2C235.53L561.13%2C235.64L560.81%2C235.96L560.32%2C236.87L560.11%2C237.4L560.16%2C238.19L560.37%2C238.42L560.59%2C238.47L560.86%2C238.36L561.04%2C238.31L561.17%2C238.48L561.08%2C238.8L560.72%2C239.54L560.03%2C239.97L559.7%2C240.39L559.42%2C241.82L558.62%2C242.53L558.8%2C243.12L559.03%2C243.19L559.81%2C243.25L560.11%2C243.31L560.36%2C243.43L560.49%2C243.61L560.51%2C243.83L560.49%2C244.11L560.49%2C244.37L560.28%2C245.01L559.85%2C245.92L557.97%2C248.95L557.3%2C249.85L555.2%2C251.77L554.96%2C251.79L554.69%2C251.73L554.43%2C251.77L554.22%2C251.97L554.16%2C252.5L554%2C252.99L553.64%2C253.61L552.84%2C254.48L552.22%2C256L551.94%2C257.16L551.26%2C258.99L551.14%2C259.41L550.97%2C259.72L550.48%2C259.95L550.09%2C260.27L549.71%2C260.78L548.64%2C263.6L547.75%2C265.2L547.45%2C265.93L547.28%2C266.47L547.27%2C266.77L547.18%2C267.18L547.17%2C267.54L547.19%2C267.88L547.27%2C268.14L547.32%2C268.41L547.28%2C268.69L547.07%2C269.44L546.86%2C269.92L545.93%2C271.54L545.66%2C272.46L545.63%2C272.75L545.56%2C273.01L545.16%2C273.52L544.58%2C274L543.06%2C274.86L542.22%2C275.2L541.5%2C275.37L541%2C275.38L540.18%2C275.56L539.88%2C275.59L539.27%2C275.54L538.18%2C276.49L529.28%2C287.22L526.61%2C288.81L526.38%2C287.27L526.23%2C286.81L526.02%2C286.5L525.69%2C286.44L525.43%2C286.44L525.14%2C286.4L524.51%2C286.19L524.27%2C285.99L524.08%2C285.56L524.07%2C285.17L524.66%2C284.08L524.89%2C283.43L525.01%2C282.82L525.03%2C282.28L524.96%2C281.78L524.47%2C280.3L524.37%2C279.7L524.35%2C279.12L524.46%2C278.66L524.68%2C278.22L525.81%2C276.95L526.18%2C276.43L526.3%2C276.05L526.3%2C275.62L525.38%2C273.09L524.93%2C270.83L524.85%2C270.15L524.84%2C269.68L524.89%2C269.2L524.88%2C268.58L524.53%2C266.34L524.3%2C262.83L524.03%2C261.92L523.34%2C260.86L522.71%2C260.07L521.6%2C259.13L520.79%2C258.7L519.77%2C258.37L518.03%2C258.16L517.1%2C258.26L516.37%2C258.46L514.46%2C259.59L513.99%2C259.73L513.43%2C259.61L512.91%2C259.21L512.13%2C258.15L510.43%2C256.45L506.08%2C253.58L502.22%2C257.14L499.53%2C258.53L497.41%2C259.36L496.45%2C260.13L495.92%2C260.91L495.87%2C261.56L495.96%2C262.2L496.02%2C263.03L495.68%2C264.13L494.59%2C265.96L493.01%2C267.59L491.84%2C268.54L490.84%2C268.98L488.54%2C269.66L486.87%2C270.61L486.08%2C271.33L485.69%2C271.98L485.69%2C272.56L485.86%2C273.17L486.21%2C273.8L486.6%2C274.39L486.87%2C275.55L486.74%2C277.01L485.46%2C279.75L484.43%2C281.16L483.26%2C282.29L481.92%2C283.2L480.53%2C284.4L479.62%2C285.48L479.09%2C286.47L478.68%2C287.66L478.43%2C287.69L478%2C287.43L475.02%2C284.73L474.14%2C284.14L473.42%2C283.8L472.16%2C283.5L470.54%2C282.82L469.82%2C282.41L469.48%2C282.59L468.53%2C283.84L468.35%2C284.38L468.27%2C284.76L468.22%2C285.69L469.46%2C288.9L469.43%2C289.45L469.23%2C290.2L468.25%2C291.09L468.15%2C291.35L468.25%2C291.46L468.47%2C291.45L468.77%2C291.58L469.07%2C291.9L469.44%2C292.68L469.35%2C293.06L469.07%2C293.32L468.29%2C293.57L467.97%2C293.6L467.59%2C293.68L467.27%2C293.94L466.89%2C294.62L466.83%2C294.98L466.89%2C295.14L467.04%2C295.05L467.24%2C294.89L467.45%2C294.82L467.72%2C294.99L467.67%2C295.22L467.5%2C295.49L467.12%2C295.95L467.12%2C296.23L467.29%2C296.41L467.6%2C296.48L467.87%2C296.41L468.32%2C296.13L468.58%2C296.09L468.82%2C296.28L468.77%2C296.55L468.62%2C296.89L468.34%2C297.81L468.15%2C298.13L467.6%2C298.71L467.69%2C299.06L467.88%2C299.55L468.16%2C300.53L468.12%2C301.33L467.57%2C303.18L466.76%2C304.94L466.13%2C305.94L466.13%2C306.37L466.36%2C306.93L466.81%2C307.6L467.56%2C308.46L468.19%2C308.96L468.77%2C309.29L469.72%2C310.47L468.6%2C311.21L468.82%2C313.17L468.75%2C313.56L468.47%2C313.81L468.06%2C313.95L467.45%2C314.36L467.29%2C314.91L467.31%2C316.71L467.14%2C317.12L466.91%2C317.21L466.66%2C317.01L466.2%2C316.5L465.95%2C316.45L465.61%2C316.64L465.29%2C316.9L465.01%2C317.06L464.73%2C317.11L463.79%2C317.16L463.07%2C317.42L462.74%2C317.64L461.05%2C320.15L460.72%2C320.87L460.52%2C321.67L460.34%2C321.97L460.09%2C322.12L459.82%2C322.1L459.67%2C321.99L459.65%2C321.84L459.85%2C321.38L459.82%2C321.09L459.67%2C320.88L459.19%2C320.96L458.91%2C321.31L458.58%2C321.86L458.35%2C322.49L458.01%2C322.79L457.66%2C322.93L456.67%2C322.88L455.92%2C323.05L455.63%2C323.26L455.64%2C323.5L455.82%2C323.76L455.98%2C324.12L456.06%2C326.46L455.96%2C326.73L455.78%2C326.85L454.82%2C326.88L454.14%2C327.04L453.82%2C327.32L453.66%2C327.67L453.76%2C328.05L454.36%2C329.1L454.47%2C329.44L454.47%2C329.86L454.27%2C330.48L453.95%2C330.8L452.2%2C332.02L452.07%2C332.35L452.5%2C333.02L452.61%2C333.51L452.02%2C335.14L451.8%2C336.36L450.89%2C337.67L450.84%2C338.15L450.85%2C338.97L451.11%2C339.22L451.49%2C339.31L452.08%2C339.24L452.74%2C339.05L454.97%2C338.78L457.15%2C339.11L457.65%2C339.32L458.38%2C339.64L462.16%2C343.07L463.13%2C344.3L463.77%2C345.83L464.03%2C347.72L463.95%2C349.55L463.47%2C351.27L460.68%2C355.66L459.16%2C359.87L459%2C360.76L458.99%2C361.66L459.19%2C362.55L459.61%2C363.38L460.16%2C364.08L461.78%2C365.72L461.98%2C366.13L461.98%2C366.55L460.84%2C368.38L460.51%2C369.1L459.3%2C374.4L460.24%2C376.66L459.98%2C379.09L459.3%2C381.63L456.09%2C384.51L454.67%2C385.55L452.76%2C387.33L451.55%2C388.79L447.19%2C395.1L449.65%2C400.53L449.89%2C400.46L454.14%2C399.3L455.21%2C395.86L455.76%2C395.18L456.24%2C395.27L462.09%2C395.51L462.9%2C395.68L464.53%2C396.57L464.53%2C396.57L467.57%2C399.27L470.14%2C397.3L470.42%2C397.57L470.75%2C398.02L470.87%2C399.12L471.07%2C400.01L471.51%2C401.38L471.56%2C401.66L471.51%2C401.81L471.46%2C402.04L471.39%2C403.22L470.97%2C404.17L471.08%2C407.06L471.18%2C410.02L470.98%2C410.74L470.73%2C411.39L470.34%2C411.63L470.04%2C411.61L470.02%2C411.34L470.22%2C411.04L470.22%2C410.15L469.66%2C411.71L469.84%2C412.53L470.16%2C413.22L470.2%2C413.63L470.1%2C414.01L469.59%2C414.62L469.34%2C414.87L468.55%2C416.03L468.43%2C420.25L468.39%2C421.4L469.41%2C423.47L470.87%2C427.21L471.51%2C429.61L471.82%2C431.67L471.78%2C435.46L471.3%2C436.82L473.12%2C437.38L473.34%2C437.26L473.7%2C437L474.01%2C436.41L474.41%2C435.46L475.22%2C434.1L476.03%2C431.56L476.61%2C430.18L477.19%2C429.88L477.69%2C430.8L478.4%2C432.71L478.83%2C433.59L479.35%2C434.31L479.99%2C434.89L480.74%2C435.4L481.58%2C435.83L482.5%2C436.13L483.43%2C436.17L484.29%2C435.83L485.22%2C435.06L485.59%2C434.9L485.12%2C433.44L484.86%2C432.98L484.4%2C431.91L485.16%2C430.75L486.61%2C429.31L490.16%2C426.57L491.95%2C423.91L493.77%2C421.69L495.36%2C420.41L497.81%2C420.54L507.22%2C422.84L510.09%2C423.06L518.02%2C422.18L543.61%2C429.57L548.36%2C430.97L549.02%2C430.7L549.96%2C430.18L550.98%2C428.84L552.3%2C427.43L555.43%2C424.77L556%2C424.17L557.87%2C421.34L560%2C418.73L561.09%2C417.12L561.85%2C415.06L562.18%2C413.7L562.71%2C412.64L563.5%2C411.5L566.35%2C408.07L567.26%2C406.67L567.73%2C406.17L568.1%2C405.99L568.44%2C406.08L568.77%2C406.23L569.09%2C406.31L569.44%2C406.27L570.68%2C405.7L571.64%2C405.1L572.33%2C404.44L573.2%2C403.38L577.02%2C400.56L577.67%2C400.25L578.16%2C400.07L578.61%2C400.05L579.3%2C399.87L580.28%2C399.48L582.2%2C398.31L583.08%2C397.62L583.67%2C396.88L584.65%2C393.37L584.95%2C392.75L586.25%2C390.52L587.62%2C388.97L587.62%2C388.97L587.52%2C388.91L587.1%2C388.83L586.69%2C388.91L586.29%2C389.14L584.78%2C390.58L582.31%2C390.9L579.88%2C390.33L578.48%2C389.13L579.76%2C387.44L583.63%2C385.07L584.64%2C383.59L584.06%2C381.43L582.33%2C380.23L580.89%2C378.76L581.21%2C375.75L579.44%2C376.19L575.48%2C376.25L573.99%2C376.89L571.61%2C379.18L570.27%2C380.08L568.84%2C380.43L568.29%2C379.75L568.31%2C376.26L568.03%2C375.54L567.75%2C374.78L563.9%2C372.01L562.66%2C370.77L561.54%2C369.17L560.73%2C367.58L560.16%2C365.84L559.81%2C363.86L559.22%2C362.23L558.15%2C361.04L556.89%2C359.98L555.8%2C358.76L548.53%2C345.51L548.38%2C345.38L548.2%2C345.29L548%2C345.26L545.58%2C345.64L543.46%2C345.5L541.61%2C344.45L539.92%2C342.08L541.67%2C341.28L542.46%2C340.74L543.14%2C340.04L543.15%2C340.04L543.15%2C340.03L544.4%2C337.29L545.09%2C334.78L546.01%2C332.59L548%2C330.84L549.2%2C329.55L552.5%2C326.84L553.33%2C325.72L553.33%2C324.62L552.86%2C323.77L552.26%2C322.92L551.87%2C321.79L552.03%2C320.88L553.18%2C319.01L553.59%2C318.12L554.67%2C313.37L554.84%2C310.93L554.39%2C308.69L553.14%2C306.75L551.45%2C305.67L549.63%2C305.68L548%2C306.99L546.49%2C305.87L545.44%2C303.73L542.92%2C295.59L543.71%2C294.29L548%2C293.32L548.59%2C292.78L549.12%2C292.16L549.59%2C291.44L549.97%2C290.65L550.09%2C287.72L549.41%2C283.71L549.75%2C280.99L552.93%2C281.92L555.73%2C283.41L558.25%2C284.02L563.87%2C284.46L565.66%2C285.1L566.15%2C284.99L566.48%2C284.35L566.7%2C283.3L566.72%2C282.24L566.48%2C281.59L565.57%2C280.3L565.31%2C278.62L565.27%2C276.76L565.01%2C274.88L564.68%2C274.19L564.26%2C273.7L563.86%2C273.1L563.6%2C272.04L563.32%2C271.23L562.72%2C270.51L561.98%2C269.94L561.31%2C269.55L560.09%2C268.17L560.72%2C266.56L562.99%2C263.95L563.24%2C262.81L563.05%2C260.8L563.31%2C259.61L564.11%2C258.48L565.14%2C258.05L567.47%2C257.8L569.73%2C256.22L570.14%2C253.79L569.98%2C251.27L570.52%2C249.35L572.41%2C249.26L573.88%2C250.04z%22%2F%3E%0A%09%09%3Cpath%20fill%3D%22white%22%20stroke%3D%22none%22%20id%3D%22IQ-SU%22%20title%3D%22As-Sulaymaniyah%22%20%20d%3D%22M517.91%2C99.34L515.7%2C98.3L514.76%2C97.22L514.46%2C96.3L514.32%2C95.3L513.93%2C93.98L513.28%2C93.01L512.58%2C92.33L512.05%2C91.49L511.98%2C90.06L510.93%2C88.92L509.64%2C87.8L509.64%2C87.81L509.31%2C88.78L508.86%2C89.78L507.75%2C91.46L506.84%2C92.11L505.67%2C92.55L502.85%2C92.35L499.36%2C91.48L497.69%2C91.52L495.89%2C91.92L491.65%2C94.06L488.08%2C95.01L484.35%2C95.6L482.01%2C94.91L480.66%2C94.72L478.96%2C95.28L476.46%2C97.18L474.89%2C99.02L473.98%2C100.36L471.29%2C102.75L471.26%2C104.9L471.72%2C106.08L476.42%2C113.27L477.21%2C112.36L477.74%2C111.97L478.6%2C112.01L479.41%2C112.69L483.51%2C117.66L483.97%2C118.42L484.2%2C119.26L483.44%2C120.12L481.54%2C121.01L480.91%2C121.49L480.48%2C122.31L480.03%2C123L479.4%2C123.64L477.64%2C125.06L478%2C126.34L478.43%2C127.27L486.62%2C133.12L488.49%2C133.92L489.46%2C134.56L490.24%2C135.21L496.22%2C142.46L498.8%2C144.88L500.82%2C146.3L506.35%2C149.06L506.89%2C149.73L507.01%2C150.02L507.04%2C150.29L506.99%2C150.52L506.87%2C150.75L506.69%2C151.35L506.53%2C151.63L506.01%2C152.06L505.42%2C152.27L504.56%2C152.39L502.69%2C152.34L501.91%2C152.12L501.48%2C151.84L501.33%2C151.62L501.15%2C151.5L500.97%2C151.36L500.59%2C150.96L500.31%2C150.79L499.91%2C150.72L499.04%2C150.85L498.76%2C150.81L498.25%2C150.59L497.96%2C150.56L497.31%2C150.69L497.08%2C150.83L497.03%2C151.1L497.91%2C152.74L498%2C152.99L497.54%2C153.62L496.29%2C154.06L495.51%2C154.85L495.26%2C154.93L495.06%2C154.79L494.89%2C154.24L494.81%2C152.74L494.66%2C152.46L494.4%2C152.26L494.1%2C152.15L493.84%2C152.16L493.5%2C152.49L493.27%2C152.81L493.14%2C153.13L493.06%2C153.8L492.99%2C154.13L492.74%2C154.35L492.36%2C154.31L491.7%2C153.78L491.4%2C153.33L491.04%2C152.93L490.68%2C152.78L490.17%2C152.74L489.47%2C153L489.03%2C153.29L488.56%2C153.47L488.13%2C153.43L487.66%2C153.03L487.25%2C152.35L486.82%2C152.23L486.19%2C152.19L484.24%2C152.8L483.77%2C152.87L483.36%2C152.8L483.06%2C152.38L483.03%2C152.09L483.05%2C151.84L483.03%2C151.6L482.88%2C151.38L482.65%2C151.23L482.29%2C151.22L481.4%2C151.74L481.09%2C151.79L480.76%2C151.46L480.54%2C151.13L480.16%2C150.95L479.92%2C150.91L478.43%2C151.61L482.93%2C161.55L485.01%2C163.82L486.87%2C166.38L490.66%2C169.76L491.34%2C171.75L491.41%2C173.43L490.03%2C175.92L489.7%2C176.98L489.52%2C179.55L489.19%2C180.72L488.94%2C184.33L488.65%2C187.22L488.85%2C188.2L489.41%2C189.21L491.14%2C191.17L492.71%2C193.33L492.81%2C194.48L492.38%2C195.88L491.55%2C197.56L488.57%2C201.62L487.95%2C203.57L488.19%2C205.06L488.7%2C206.75L489.02%2C208.24L488.67%2C209.79L487.79%2C211.91L487.56%2C213.25L487.33%2C213.87L487.04%2C214.31L486.43%2C214.5L485.68%2C214.92L484.7%2C215.61L483.86%2C216.87L483.54%2C217.78L483.49%2C218.63L483.62%2C219.37L484.17%2C220.75L483.95%2C221.59L483.08%2C222.43L476.72%2C224.44L473.1%2C227.51L481.34%2C236.19L482.68%2C236.83L484.52%2C237.33L485.92%2C236.83L494.86%2C237.21L497.91%2C237.77L504.93%2C242.7L505.92%2C243.9L506.12%2C244.33L506.2%2C244.71L506.15%2C245.16L505.88%2C246.5L506.08%2C253.58L510.43%2C256.45L512.13%2C258.15L512.91%2C259.21L513.43%2C259.61L513.99%2C259.73L514.46%2C259.59L516.37%2C258.46L517.1%2C258.26L518.03%2C258.16L519.77%2C258.37L520.79%2C258.7L521.6%2C259.13L522.71%2C260.07L523.34%2C260.86L524.03%2C261.92L524.3%2C262.83L524.53%2C266.34L524.88%2C268.58L524.89%2C269.2L524.84%2C269.68L524.85%2C270.15L524.93%2C270.83L525.38%2C273.09L526.3%2C275.62L526.3%2C276.05L526.18%2C276.43L525.81%2C276.95L524.68%2C278.22L524.46%2C278.66L524.35%2C279.12L524.37%2C279.7L524.47%2C280.3L524.96%2C281.78L525.03%2C282.28L525.01%2C282.82L524.89%2C283.43L524.66%2C284.08L524.07%2C285.17L524.08%2C285.56L524.27%2C285.99L524.51%2C286.19L525.14%2C286.4L525.43%2C286.44L525.69%2C286.44L526.02%2C286.5L526.23%2C286.81L526.38%2C287.27L526.61%2C288.81L529.28%2C287.22L538.18%2C276.49L539.27%2C275.54L539.88%2C275.59L540.18%2C275.56L541%2C275.38L541.5%2C275.37L542.22%2C275.2L543.06%2C274.86L544.58%2C274L545.16%2C273.52L545.56%2C273.01L545.63%2C272.75L545.66%2C272.46L545.93%2C271.54L546.86%2C269.92L547.07%2C269.44L547.28%2C268.69L547.32%2C268.41L547.27%2C268.14L547.19%2C267.88L547.17%2C267.54L547.18%2C267.18L547.27%2C266.77L547.28%2C266.47L547.45%2C265.93L547.75%2C265.2L548.64%2C263.6L549.71%2C260.78L550.09%2C260.27L550.48%2C259.95L550.97%2C259.72L551.14%2C259.41L551.26%2C258.99L551.94%2C257.16L552.22%2C256L552.84%2C254.48L553.64%2C253.61L554%2C252.99L554.16%2C252.5L554.22%2C251.97L554.43%2C251.77L554.69%2C251.73L554.96%2C251.79L555.2%2C251.77L557.3%2C249.85L557.97%2C248.95L559.85%2C245.92L560.28%2C245.01L560.49%2C244.37L560.49%2C244.11L560.51%2C243.83L560.49%2C243.61L560.36%2C243.43L560.11%2C243.31L559.81%2C243.25L559.03%2C243.19L558.8%2C243.12L558.62%2C242.53L559.42%2C241.82L559.7%2C240.39L560.03%2C239.97L560.72%2C239.54L561.08%2C238.8L561.17%2C238.48L561.04%2C238.31L560.86%2C238.36L560.59%2C238.47L560.37%2C238.42L560.16%2C238.19L560.11%2C237.4L560.32%2C236.87L560.81%2C235.96L561.13%2C235.64L561.4%2C235.53L561.58%2C235.72L561.65%2C235.94L561.63%2C236.22L561.65%2C236.43L561.78%2C236.49L561.98%2C236.38L562.22%2C236.16L562.44%2C236.02L563.1%2C235.7L563.32%2C235.33L563.66%2C234.52L564.08%2C233.87L564.96%2C232.84L565.4%2C232.22L565.7%2C231.71L565.77%2C231.03L565.88%2C230.52L566.6%2C229.73L567.09%2C229.42L567.62%2C229.41L568.16%2C229.75L568.78%2C230.28L569.16%2C230.68L569.62%2C231.4L575.2%2C237.35L576.08%2C238.78L575.83%2C238.95L575.51%2C239.06L575.14%2C239.15L574.74%2C239.16L574.42%2C239.1L574.06%2C238.96L573.73%2C238.92L573.1%2C238.98L572.87%2C238.94L572.68%2C239.11L572.58%2C239.79L573.36%2C248.93L573.88%2C250.04L573.88%2C250.04L574.85%2C250.56L577.05%2C251.33L578.29%2C249.67L578.91%2C247.23L579.61%2C245.41L579.82%2C243.54L579.07%2C240.96L579.07%2C240.94L578.83%2C239.58L578.85%2C238.26L579.24%2C237.11L580.11%2C236.25L580.64%2C236.07L581.79%2C235.96L582.28%2C235.71L582.45%2C235.24L582.22%2C234.01L582.31%2C233.54L583.43%2C231.67L584%2C231.44L585.21%2C231.86L586.93%2C232.98L587.77%2C233.33L588.83%2C233.25L591.27%2C234.31L592.57%2C233.97L593.77%2C232.85L595.96%2C231.53L596.78%2C231.44L598.24%2C231.82L600.32%2C231.13L601.33%2C230.93L602.21%2C230.46L602.86%2C229.25L601.17%2C227.27L602.27%2C224.46L604.03%2C221.43L604.34%2C218.8L603.11%2C217.76L599.95%2C217.79L598.81%2C217L598.59%2C215.42L599.31%2C214.15L600.32%2C212.93L600.75%2C211.92L600.92%2C211.52L600.33%2C208.57L598.38%2C206.3L593.87%2C202.26L588.64%2C193.86L587.58%2C190.97L587.55%2C190.04L587.75%2C189.24L588.18%2C188.58L588.83%2C188.08L589.15%2C187.68L589.26%2C187.27L589.14%2C186.84L588.83%2C186.42L587.91%2C184.52L587.2%2C182.49L587.57%2C182.38L587.96%2C182.38L590.46%2C183.15L590.69%2C181.76L589.89%2C177.9L589.9%2C176.24L590.18%2C174.48L590.83%2C172.89L591.87%2C171.74L593.55%2C171.15L599.26%2C171.32L600.94%2C170.94L605.03%2C168.75L608.24%2C168.93L609.95%2C168.74L611.22%2C167.51L612.33%2C165.86L614.82%2C164.28L616.11%2C163.11L617.07%2C161.46L617.23%2C159.89L616.62%2C158.54L615.26%2C157.57L613.5%2C157.39L612.04%2C158.11L610.64%2C159.09L609.09%2C159.66L605.63%2C160.42L603.87%2C160.49L602.23%2C159.78L601.56%2C159.23L601.06%2C158.67L600.71%2C157.98L600.31%2C155.92L599.92%2C155.56L599.32%2C155.46L596.81%2C154.5L595.46%2C154.47L594.14%2C154.97L592.56%2C155.88L590.92%2C156.41L585.72%2C156.18L583.1%2C157.09L582.26%2C157L581.42%2C156.73L580.58%2C156.69L578.61%2C158.39L577.03%2C159.18L575.35%2C159.3L574.02%2C158.39L573.11%2C158.2L570.03%2C159.13L568.56%2C158.72L567.55%2C157.39L565.47%2C152.19L561.68%2C146.82L559.25%2C144.57L557.03%2C144.15L555.97%2C143.48L552.96%2C140.68L549.81%2C139.53L548%2C138.86L545.86%2C138.9L543.15%2C140.25L541.7%2C140.66L541.69%2C140.67L541.68%2C140.68L541.66%2C140.68L541.65%2C140.68L540.04%2C141.8L538.23%2C142.41L536.47%2C142.17L535.04%2C140.68L535.02%2C140.68L535.01%2C140.67L535.01%2C140.67L535.01%2C140.65L534.48%2C139.03L534.96%2C136.94L535.96%2C134.87L536.97%2C133.26L537.31%2C131.24L536.27%2C129.2L533.74%2C125.89L533.32%2C123.77L533.52%2C119.1L533.14%2C117.16L531.95%2C115.98L530.44%2C114.78L529.97%2C113.56L531.95%2C112.28L530.41%2C110.32L529.85%2C108.55L529.64%2C104.19L529.25%2C101.84L528.37%2C99.29L526.93%2C97.48L524.87%2C97.32L520.29%2C99.15L517.91%2C99.34z%22%2F%3E%0A%09%09%3Cpath%20fill%3D%22white%22%20stroke%3D%22none%22%20id%3D%22IQ-WA%22%20title%3D%22Wasit%22%20%20d%3D%22M597.8%2C426.13L599.13%2C425.87L600.85%2C424.56L603.05%2C422.37L604.17%2C420.99L604.76%2C419.74L604.71%2C418.86L603.76%2C418.26L603.4%2C417.35L603.45%2C416.55L603.95%2C414.68L603.93%2C413.67L603.2%2C412.03L602.06%2C410.87L599.46%2C408.76L596.21%2C404.15L593.48%2C401.5L593.06%2C400.08L593.01%2C398.44L592.76%2C396.46L592.1%2C394.61L591.18%2C392.92L588.43%2C389.48L588.18%2C389.29L587.93%2C389.14L587.62%2C388.97L587.62%2C388.97L586.25%2C390.52L584.95%2C392.75L584.65%2C393.37L583.67%2C396.88L583.08%2C397.62L582.2%2C398.31L580.28%2C399.48L579.3%2C399.87L578.61%2C400.05L578.16%2C400.07L577.67%2C400.25L577.02%2C400.56L573.2%2C403.38L572.33%2C404.44L571.64%2C405.1L570.68%2C405.7L569.44%2C406.27L569.09%2C406.31L568.77%2C406.23L568.44%2C406.08L568.1%2C405.99L567.73%2C406.17L567.26%2C406.67L566.35%2C408.07L563.5%2C411.5L562.71%2C412.64L562.18%2C413.7L561.85%2C415.06L561.09%2C417.12L560%2C418.73L557.87%2C421.34L556%2C424.17L555.43%2C424.77L552.3%2C427.43L550.98%2C428.84L549.96%2C430.18L549.02%2C430.7L548.36%2C430.97L543.61%2C429.57L518.02%2C422.18L510.09%2C423.06L507.22%2C422.84L497.81%2C420.54L495.36%2C420.41L493.77%2C421.69L491.95%2C423.91L490.16%2C426.57L486.61%2C429.31L485.16%2C430.75L484.4%2C431.91L484.86%2C432.98L485.12%2C433.44L485.59%2C434.9L485.22%2C435.06L484.29%2C435.83L483.43%2C436.17L482.5%2C436.13L481.58%2C435.83L480.74%2C435.4L479.99%2C434.89L479.35%2C434.31L478.83%2C433.59L478.4%2C432.71L477.69%2C430.8L477.19%2C429.88L476.61%2C430.18L476.03%2C431.56L475.22%2C434.1L474.41%2C435.46L474.01%2C436.41L473.7%2C437L473.34%2C437.26L473.12%2C437.38L471.3%2C436.82L469.94%2C437.6L470.55%2C440.5L470.83%2C450.36L471.33%2C452.76L471.87%2C454.3L472.43%2C454.83L472.82%2C455.13L473.32%2C455.32L484.88%2C456.14L485.44%2C456.28L490.63%2C459.26L494.76%2C460.57L497.74%2C460.85L498.44%2C461.09L498.88%2C461.83L501.53%2C462.96L503.63%2C464.15L504.79%2C465.08L505.9%2C466.3L506.4%2C467.35L509.9%2C478.97L513.09%2C486.18L514.51%2C487.99L516.08%2C489.57L517.4%2C490.49L518.77%2C490.88L523.65%2C491.1L524.7%2C491.12L524.93%2C494.15L525.06%2C496.16L529.79%2C496.81L530.31%2C498.34L532.36%2C499.22L538.13%2C499.92L539.07%2C501.36L540.86%2C501.9L541.16%2C502.7L541.02%2C503.61L539.94%2C506.21L539.74%2C507.58L540.18%2C509.03L541.4%2C510.46L549.52%2C518.15L551.02%2C520.16L552.02%2C521.97L552.81%2C523.16L554.1%2C524.01L559.25%2C525.92L564.88%2C527.59L565.14%2C528.75L564.54%2C529.27L564.23%2C529.71L564.27%2C530.32L568.12%2C539.25L576.31%2C539.78L581.31%2C537.68L581.75%2C537.68L582.13%2C537.99L582.45%2C537.97L582.77%2C537.79L583.14%2C537.38L583.36%2C537.28L583.57%2C537.37L583.79%2C537.61L584.19%2C537.91L584.58%2C537.83L587.41%2C535.7L588.08%2C535.49L588.8%2C535.55L589.56%2C535.78L590.83%2C536.03L591.42%2C536.01L591.78%2C535.82L592.08%2C535.09L592.51%2C534.71L595.22%2C533.78L616.44%2C533.7L626.63%2C533.32L629.89%2C533.71L632.82%2C535.23L635.9%2C536.02L637.62%2C535.81L639.82%2C521.34L638.84%2C519.55L637.24%2C517.15L627.29%2C512.83L625.77%2C511.62L625.52%2C510.17L625.98%2C508.43L629.41%2C498.54L629.53%2C497.71L629.21%2C496.93L628.83%2C496.35L627.5%2C495.26L626.78%2C494.5L626.86%2C493.64L627.37%2C492.54L628.5%2C490.76L628.75%2C490.15L629.02%2C488.76L629.3%2C487.78L629.4%2C486.74L629.3%2C480.84L629.81%2C476.2L635.12%2C460.06L635.73%2C459.13L637.54%2C457.85L638.3%2C456.9L639.57%2C454.66L639.57%2C454.66L631.95%2C450.24L629.66%2C447.93L621.52%2C444.04L612.85%2C441.34L603.22%2C442.43L598.44%2C441.85L596.7%2C437.95L596.7%2C437.94L597.71%2C436.75L599.07%2C435.64L600.28%2C434.38L600.82%2C432.73L600.35%2C431.39L599.18%2C430.34L597.64%2C429.68L594.05%2C429.27L592.91%2C428.29L592.99%2C427.11L594.64%2C426.19L596.43%2C426.02L597.8%2C426.13z%22%2F%3E%0A%09%09%3Cpath%20fill%3D%22white%22%20stroke%3D%22none%22%20id%3D%22IQ-MA%22%20title%3D%22Maysan%22%20%20d%3D%22M676.95%2C486.48L652.36%2C464.99L648.98%2C461.13L643.63%2C457.89L639.88%2C454.84L639.57%2C454.66L639.57%2C454.66L638.3%2C456.9L637.54%2C457.85L635.73%2C459.13L635.12%2C460.06L629.81%2C476.2L629.3%2C480.84L629.4%2C486.74L629.3%2C487.78L629.02%2C488.76L628.75%2C490.15L628.5%2C490.76L627.37%2C492.54L626.86%2C493.64L626.78%2C494.5L627.5%2C495.26L628.83%2C496.35L629.21%2C496.93L629.53%2C497.71L629.41%2C498.54L625.98%2C508.43L625.52%2C510.17L625.77%2C511.62L627.29%2C512.83L637.24%2C517.15L638.84%2C519.55L639.82%2C521.34L637.62%2C535.81L635.9%2C536.02L632.82%2C535.23L629.89%2C533.71L626.63%2C533.32L616.44%2C533.7L618.26%2C535.53L619.27%2C536.85L619.4%2C537.66L618.06%2C538.01L616.7%2C538.83L615.91%2C540.44L618.04%2C545.01L624.36%2C555.5L624.25%2C557.76L623.97%2C559.05L625.85%2C563.91L629.05%2C567.52L631.58%2C568.99L632.07%2C569.53L634.61%2C573.63L635.95%2C575L638.58%2C577.2L639.45%2C578.25L640.05%2C579.77L640.26%2C581.26L639.95%2C583.19L639.51%2C584.37L638.66%2C586.11L638.56%2C587.35L638.61%2C588.24L639.93%2C592.19L647.2%2C596.73L648.19%2C597.51L649.12%2C598.44L650.16%2C599.84L650.65%2C600.81L650.91%2C601.66L650.99%2C602.51L650.96%2C603.57L650.6%2C606.97L650.59%2C607.98L650.69%2C608.89L650.87%2C609.68L651.16%2C610.36L651.73%2C611.11L655.26%2C613.97L656.39%2C615.06L659.59%2C616.74L668.18%2C616.61L682.48%2C617.63L683.38%2C611.76L684.91%2C609.38L686.57%2C607.97L689.41%2C606.64L700.74%2C603.67L704.42%2C603.37L716.07%2C604.53L727.39%2C607.43L727.42%2C607.44L727.62%2C591.06L740.07%2C557.13L740.55%2C554.96L740.32%2C552.91L739.2%2C551.2L735.99%2C548.77L734.67%2C547.3L734.38%2C546.58L733.96%2C544.89L733.5%2C544.02L732.88%2C543.44L731.4%2C542.47L730.85%2C541.7L727.93%2C536.45L727.54%2C534.75L727.54%2C534.74L726.74%2C533.03L723.88%2C531.63L722.63%2C530.19L720.77%2C526L719.56%2C524.25L719.38%2C524L717.81%2C523.34L716.57%2C523.19L715.85%2C522.36L715.19%2C521.37L714.14%2C520.7L712.86%2C520.34L712.3%2C519.9L712.23%2C519.14L712.4%2C517.79L712.72%2C516.75L713.2%2C515.9L713.64%2C514.96L713.76%2C513.62L713.34%2C512.37L711.75%2C511.15L711.31%2C509.92L710.51%2C509.53L709.99%2C508.98L708.55%2C506.97L708.24%2C506.43L707.86%2C505.9L705.42%2C503.57L705.05%2C503.02L704.5%2C501.71L704.51%2C501.23L704.84%2C500.87L705.56%2C499.07L706.02%2C498.54L706.31%2C497.91L706.18%2C496.79L705.73%2C496.08L703.55%2C494.41L702.18%2C492.65L701.26%2C491.16L700.22%2C489.95L698.47%2C489.02L693.85%2C487.43L692.7%2C487.36L688.96%2C489.43L687.52%2C489.98L684.64%2C490.29L682.06%2C489.72L679.58%2C488.41L676.97%2C486.49L676.97%2C486.48L676.95%2C486.48z%22%2F%3E%0A%09%09%3Cpath%20fill%3D%22white%22%20stroke%3D%22none%22%20id%3D%22IQ-DQ%22%20title%3D%22Dhi-Qar%22%20%20d%3D%22M659.59%2C616.74L656.39%2C615.06L655.26%2C613.97L651.73%2C611.11L651.16%2C610.36L650.87%2C609.68L650.69%2C608.89L650.59%2C607.98L650.6%2C606.97L650.96%2C603.57L650.99%2C602.51L650.91%2C601.66L650.65%2C600.81L650.16%2C599.84L649.12%2C598.44L648.19%2C597.51L647.2%2C596.73L639.93%2C592.19L638.61%2C588.24L638.56%2C587.35L638.66%2C586.11L639.51%2C584.37L639.95%2C583.19L640.26%2C581.26L640.05%2C579.77L639.45%2C578.25L638.58%2C577.2L635.95%2C575L634.61%2C573.63L632.07%2C569.53L631.58%2C568.99L629.05%2C567.52L625.85%2C563.91L623.97%2C559.05L624.25%2C557.76L624.36%2C555.5L618.04%2C545.01L615.91%2C540.44L616.7%2C538.83L618.06%2C538.01L619.4%2C537.66L619.27%2C536.85L618.26%2C535.53L616.44%2C533.7L595.22%2C533.78L592.51%2C534.71L592.08%2C535.09L591.78%2C535.82L591.42%2C536.01L590.83%2C536.03L589.56%2C535.78L588.8%2C535.55L588.08%2C535.49L587.41%2C535.7L584.58%2C537.83L584.19%2C537.91L583.79%2C537.61L583.57%2C537.37L583.36%2C537.28L583.14%2C537.38L582.77%2C537.79L582.45%2C537.97L582.13%2C537.99L581.75%2C537.68L581.31%2C537.68L576.31%2C539.78L568.12%2C539.25L567.57%2C541.62L567.45%2C543L567.52%2C544.98L570.78%2C555.01L573.03%2C567.72L575.61%2C570.7L576.06%2C572.11L575.96%2C572.57L575.91%2C573.91L576.03%2C575.19L575.96%2C575.89L575.78%2C576.36L575.46%2C576.48L575.1%2C576.4L574.28%2C575.75L573.85%2C575.48L573.4%2C575.31L572.93%2C575.67L572.53%2C576.41L572.01%2C578.48L572.04%2C579.34L572.32%2C579.9L572.75%2C580.07L573.22%2C580.18L573.68%2C580.81L574.12%2C581.9L574.67%2C584.83L574.77%2C586.09L574.5%2C587.2L568.87%2C594.27L567.97%2C596.04L568.18%2C597.37L570.47%2C597.78L574.97%2C597.97L570.28%2C609.09L569.36%2C612.16L569.55%2C613.18L571.13%2C613.83L571.44%2C614.18L572.41%2C614.96L573.07%2C615.26L573.56%2C615.5L573.83%2C616.47L573.73%2C618.14L573.25%2C621.07L572.67%2C622.05L571.67%2C622.21L570.02%2C621.62L568.78%2C621.76L568.16%2C623.05L567.77%2C625.49L567.32%2C627.25L566.98%2C630.08L566.51%2C632.16L567.64%2C645.46L607.72%2C650.72L620.85%2C655.35L628.34%2C667.77L631.72%2C674.73L632.59%2C675.96L633.66%2C676.78L634.75%2C676.82L637.45%2C676.18L664.11%2C668.85L665.6%2C668.91L676.93%2C670.97L679.4%2C670.51L679.9%2C667.85L679.45%2C660.92L679.57%2C658.8L680.08%2C656.1L682.15%2C645.34L683.18%2C625.53L682.48%2C617.63L668.18%2C616.61L659.59%2C616.74z%22%2F%3E%0A%09%09%3Cpath%20fill%3D%22white%22%20stroke%3D%22none%22%20id%3D%22IQ-QA%22%20title%3D%22Al-Qadisiyah%22%20%20d%3D%22M525.06%2C496.16L523.87%2C496.1L523.16%2C496.29L522.01%2C496.74L518.36%2C498.96L517.38%2C499.69L516.39%2C500.91L515.83%2C501.43L508.81%2C506.13L503.56%2C508.28L499.98%2C511.03L497.58%2C513.3L497.03%2C513.62L496.52%2C513.37L495.59%2C512.42L495.12%2C512.03L494.63%2C511.98L494.03%2C512.26L493.24%2C513.11L492.76%2C513.96L492.53%2C514.63L492.66%2C515.08L493.02%2C515.49L493.67%2C516.08L493.78%2C516.96L493.72%2C517.67L493.37%2C518.2L492.93%2C518.56L491.7%2C519.3L491.22%2C519.69L489.65%2C521.63L489.1%2C522.14L488.42%2C522.52L487.65%2C522.78L486.67%2C522.79L485.61%2C522.39L481.09%2C519.64L478.64%2C518.86L477.44%2C522.74L477.17%2C523.13L476.82%2C523.53L476.43%2C523.54L475.93%2C523.65L475.1%2C524.17L474.89%2C524.67L474.9%2C525.26L475.2%2C525.9L475.58%2C526.5L476.08%2C526.98L476.8%2C527.56L477.29%2C528.19L477.27%2C528.62L476.84%2C528.92L474.48%2C529.82L471.51%2C531.81L469.91%2C532.45L469.25%2C533.43L468.57%2C535.76L467.99%2C538.78L470.73%2C552.4L470.4%2C555.52L470.35%2C561.58L471.44%2C568.75L469.84%2C571.03L468.44%2C570.21L466.2%2C569.34L464.47%2C569.76L462.66%2C571.82L462.26%2C574.07L464.02%2C577.32L469.34%2C583.62L470.86%2C584.61L486.56%2C591.1L500.47%2C601.38L507.09%2C604.95L508.81%2C595L513.93%2C580.97L516.47%2C575.97L517.73%2C572.52L517.86%2C571.09L516.05%2C570.25L515.5%2C569.29L515.12%2C568.18L514.62%2C567.33L514.06%2C566.99L512.61%2C566.45L511.82%2C566.02L510.89%2C565.06L512.78%2C564.84L526%2C561.67L526.84%2C560.22L532.71%2C560.42L552.64%2C564.34L567.09%2C569.09L570.58%2C569.05L572.35%2C568.45L573.03%2C567.72L570.78%2C555.01L567.52%2C544.98L567.45%2C543L567.57%2C541.62L568.12%2C539.25L564.27%2C530.32L564.23%2C529.71L564.54%2C529.27L565.14%2C528.75L564.88%2C527.59L559.25%2C525.92L554.1%2C524.01L552.81%2C523.16L552.02%2C521.97L551.02%2C520.16L549.52%2C518.15L541.4%2C510.46L540.18%2C509.03L539.74%2C507.58L539.94%2C506.21L541.02%2C503.61L541.16%2C502.7L540.86%2C501.9L539.07%2C501.36L538.13%2C499.92L532.36%2C499.22L530.31%2C498.34L529.79%2C496.81L525.06%2C496.16z%22%2F%3E%0A%09%09%3Cpath%20fill%3D%22white%22%20stroke%3D%22none%22%20id%3D%22IQ-MU%22%20title%3D%22Al-Muthannia%22%20%20d%3D%22M619.71%2C812.7L623.28%2C811.94L625.42%2C811.49L626.85%2C811.18L630.42%2C810.42L634%2C809.66L636.37%2C807L636.38%2C806.93L636.81%2C804.62L638.59%2C785.76L639.24%2C783.32L640.2%2C781.18L643.21%2C775.94L643.56%2C773.53L643.63%2C761.5L644.65%2C752.01L651.32%2C716.35L651.34%2C713.66L651.09%2C711.23L650.6%2C709.34L649.89%2C707.56L641.86%2C695.84L640.81%2C693.45L640.12%2C690.78L638.81%2C682.03L637.45%2C676.18L634.75%2C676.82L633.66%2C676.78L632.59%2C675.96L631.72%2C674.73L628.34%2C667.77L620.85%2C655.35L607.72%2C650.72L567.64%2C645.46L566.51%2C632.16L566.98%2C630.08L567.32%2C627.25L567.77%2C625.49L568.16%2C623.05L568.78%2C621.76L570.02%2C621.62L571.67%2C622.21L572.67%2C622.05L573.25%2C621.07L573.73%2C618.14L573.83%2C616.47L573.56%2C615.5L573.07%2C615.26L572.41%2C614.96L571.44%2C614.18L571.13%2C613.83L569.55%2C613.18L569.36%2C612.16L570.28%2C609.09L574.97%2C597.97L570.47%2C597.78L568.18%2C597.37L567.97%2C596.04L568.87%2C594.27L574.5%2C587.2L574.77%2C586.09L574.67%2C584.83L574.12%2C581.9L573.68%2C580.81L573.22%2C580.18L572.75%2C580.07L572.32%2C579.9L572.04%2C579.34L572.01%2C578.48L572.53%2C576.41L572.93%2C575.67L573.4%2C575.31L573.85%2C575.48L574.28%2C575.75L575.1%2C576.4L575.46%2C576.48L575.78%2C576.36L575.96%2C575.89L576.03%2C575.19L575.91%2C573.91L575.96%2C572.57L576.06%2C572.11L575.61%2C570.7L573.03%2C567.72L572.35%2C568.45L570.58%2C569.05L567.09%2C569.09L552.64%2C564.34L532.71%2C560.42L526.84%2C560.22L526%2C561.67L512.78%2C564.84L510.89%2C565.06L511.82%2C566.02L512.61%2C566.45L514.06%2C566.99L514.62%2C567.33L515.12%2C568.18L515.5%2C569.29L516.05%2C570.25L517.86%2C571.09L517.73%2C572.52L516.47%2C575.97L513.93%2C580.97L508.81%2C595L507.09%2C604.95L500.47%2C601.38L486.56%2C591.1L480.38%2C624.77L478.41%2C629.34L474.52%2C636.25L470.73%2C639.71L467.55%2C643.46L463.57%2C649.69L463.01%2C650.08L458.09%2C652.16L454.04%2C655.11L452.76%2C656.41L449.41%2C660.79L446.51%2C666.58L431.8%2C709.02L413.88%2C740.48L412.83%2C742.3L418.22%2C746.68L427.58%2C754.28L436.93%2C761.87L446.28%2C769.46L454.06%2C775.76L461.85%2C782.07L469.64%2C788.37L477.41%2C794.66L483.7%2C799.74L484.22%2C799.94L484.74%2C800.14L485.25%2C800.35L485.79%2C800.56L493.26%2C801.23L499.77%2C801.83L506.27%2C802.41L512.77%2C803.01L519.27%2C803.59L527.64%2C804.36L536.01%2C805.11L544.38%2C805.88L552.75%2C806.63L561.11%2C807.39L569.49%2C808.15L577.86%2C808.91L586.22%2C809.67L592.45%2C810.23L598.66%2C810.79L604.89%2C811.36L611.11%2C811.93L619.71%2C812.7z%22%2F%3E%0A%09%09%3Cpath%20fill%3D%22white%22%20stroke%3D%22none%22%20id%3D%22IQ-BA%22%20title%3D%22Al-Basrah%22%20%20d%3D%22M727.42%2C607.44L727.39%2C607.43L716.07%2C604.53L704.42%2C603.37L700.74%2C603.67L689.41%2C606.64L686.57%2C607.97L684.91%2C609.38L683.38%2C611.76L682.48%2C617.63L683.18%2C625.53L682.15%2C645.34L680.08%2C656.1L679.57%2C658.8L679.45%2C660.92L679.9%2C667.85L679.4%2C670.51L676.93%2C670.97L665.6%2C668.91L664.11%2C668.85L637.45%2C676.18L638.81%2C682.03L640.12%2C690.78L640.81%2C693.45L641.86%2C695.84L649.89%2C707.56L650.6%2C709.34L651.09%2C711.23L651.34%2C713.66L651.32%2C716.35L644.65%2C752.01L643.63%2C761.5L643.56%2C773.53L643.21%2C775.94L640.2%2C781.18L639.24%2C783.32L638.59%2C785.76L636.81%2C804.62L636.38%2C806.93L636.37%2C807L648.65%2C793.23L653.77%2C784.6L659%2C778.84L660.21%2C777L662.64%2C770.63L668.74%2C760.5L670.33%2C756.97L670.54%2C756.02L670.85%2C753.18L671.27%2C751.83L674.26%2C746.24L681.2%2C728.46L684%2C724.46L688.28%2C721.55L701.43%2C716.09L706.13%2C715.51L727.23%2C715.51L731.91%2C716.42L749.59%2C725.34L749.63%2C723.11L749.02%2C722.28L749.08%2C721.26L749.43%2C720.12L749.63%2C718.9L749.52%2C717.75L748.52%2C714.67L749.89%2C716.44L750.45%2C719.06L750.73%2C721.91L751.31%2C724.39L756.96%2C721.3L760.07%2C720.47L763.57%2C720.53L767.38%2C721.24L770.93%2C722.47L775.45%2C725.35L778.3%2C726.24L781.23%2C728.41L787.47%2C730.58L796.35%2C731.48L798.5%2C730.93L799.51%2C729.81L799.16%2C728.88L797.18%2C728.9L797.18%2C728.48L797.2%2C728.42L797.2%2C728.42L796.63%2C728.16L794.1%2C727.44L792.89%2C726.7L791.76%2C725.8L791.22%2C725.26L790.84%2C724.64L790.12%2C722.8L789.95%2C721.58L788.46%2C716.89L788.24%2C716.72L787.77%2C715.75L786.14%2C713.91L785.12%2C711.72L784.96%2C711.06L785.14%2C710.01L785.78%2C709.23L786.56%2C708.52L787.16%2C707.7L787.37%2C706.7L787.21%2C705.68L786.8%2C704.72L786.26%2C703.91L783.09%2C701L780.46%2C698.01L778.8%2C695.23L778.04%2C694.58L777.05%2C694.24L776.02%2C694.19L773.04%2C694.69L772.05%2C694.73L771.09%2C694.59L770.18%2C694.18L769.52%2C693.49L769.17%2C692.58L768.5%2C688.42L767.76%2C686.35L766.71%2C684.49L765.35%2C683.01L764.5%2C682.48L763.59%2C682.17L754.95%2C680.93L754.82%2C678.03L754.82%2C678.02L755.1%2C632.26L754.84%2C631.04L753.97%2C630.51L727.13%2C630.51L727.42%2C607.44z%22%2F%3E%0A%09%09%3Cpath%20fill%3D%22white%22%20stroke%3D%22none%22%20id%3D%22IQ-BG%22%20title%3D%22Baghdad%22%20%20d%3D%22M467.57%2C399.27L464.53%2C396.57L464.53%2C396.57L462.9%2C395.68L462.09%2C395.51L456.24%2C395.27L455.76%2C395.18L455.21%2C395.86L454.14%2C399.3L449.89%2C400.46L450%2C400.89L450.01%2C401.39L449.23%2C403.3L446.65%2C406.08L445.68%2C408L445.35%2C409.88L445.37%2C411.93L445.76%2C413.92L446.57%2C415.6L447.52%2C416.55L449.71%2C417.93L450.66%2C418.96L451.73%2C418.8L452.78%2C418.97L454.87%2C419.56L468.42%2C420.25L468.43%2C420.25L468.55%2C416.03L469.34%2C414.87L469.59%2C414.62L470.1%2C414.01L470.2%2C413.63L470.16%2C413.22L469.84%2C412.53L469.66%2C411.71L470.22%2C410.15L470.22%2C411.04L470.02%2C411.34L470.04%2C411.61L470.34%2C411.63L470.73%2C411.39L470.98%2C410.74L471.18%2C410.02L471.08%2C407.06L470.97%2C404.17L471.39%2C403.22L471.46%2C402.04L471.51%2C401.81L471.56%2C401.66L471.51%2C401.38L471.07%2C400.01L470.87%2C399.12L470.75%2C398.02L470.42%2C397.57L470.14%2C397.3L467.57%2C399.27z%22%2F%3E%0A%09%09%3Cpath%20fill%3D%22white%22%20stroke%3D%22none%22%20id%3D%22IQ-KA%22%20title%3D%22Karbala'%22%20%20d%3D%22M437.79%2C458.68L423.79%2C454.35L414.44%2C454.35L407.52%2C455.22L401.05%2C458.39L385.77%2C471.93L383.56%2C473.39L382.67%2C473.64L380.93%2C473.89L370.93%2C475.31L367.1%2C476.77L362.75%2C479.07L363.32%2C482.01L365.29%2C484.97L384.53%2C504.5L397.99%2C514.62L401.94%2C517.99L440%2C507.04L447.62%2C504.65L449.75%2C504.4L450.73%2C505.26L451.41%2C505.68L451.8%2C505.16L452.17%2C504.08L452.3%2C503.49L453.29%2C501.07L453.03%2C500.02L451.33%2C496.67L450.73%2C494.65L451.13%2C493.06L451.91%2C491.13L451.33%2C489.19L446.73%2C482.44L445.38%2C479.15L445.2%2C475.52L448.08%2C465L448.84%2C464.19L448.79%2C463.09L448.77%2C462.52L448.44%2C461.75L446.46%2C459.73L445.9%2C459.31L445.4%2C459.11L445.02%2C459.13L444.59%2C459.31L443.71%2C459.8L443.33%2C459.86L442.9%2C459.8L440.05%2C459.02L437.79%2C458.68z%22%2F%3E%0A%09%09%3Cpath%20fill%3D%22white%22%20stroke%3D%22none%22%20id%3D%22IQ-NA%22%20title%3D%22An-Najaf%22%20%20d%3D%22M457.71%2C520.25L456.47%2C518.59L456.07%2C517.77L455.46%2C516.83L454.93%2C516.21L453.38%2C513.72L452.74%2C511.93L452.61%2C510.88L453.21%2C509.9L455.18%2C508.79L455.51%2C507.13L455.01%2C506.62L454.45%2C505.7L453.29%2C501.07L452.3%2C503.49L452.17%2C504.08L451.8%2C505.16L451.41%2C505.68L450.73%2C505.26L449.75%2C504.4L447.62%2C504.65L440%2C507.04L401.94%2C517.99L410.53%2C526.19L410.44%2C528.09L410.01%2C530.98L408.57%2C532.72L407.17%2C534.06L399.57%2C538.29L397.49%2C539.97L396.4%2C540.65L395.08%2C541.14L389.88%2C541.95L388.91%2C542.36L386.48%2C543.97L385.85%2C544.12L384.15%2C544.28L382.82%2C544.9L381.31%2C546.06L378.95%2C548.63L366.24%2C567.53L365.08%2C569.64L364.98%2C572.7L364.52%2C575.38L363.32%2C578.93L354.65%2C597.56L353.89%2C599.88L353.66%2C601.53L353.66%2C602.79L353.81%2C603.6L354.12%2C604.29L354.18%2C605.7L353.84%2C607.75L350.62%2C616.25L350.35%2C617.44L349.8%2C622.11L349.26%2C624.11L348.66%2C625.42L344.06%2C631.94L341.25%2C636.76L340.64%2C638.19L340.36%2C639.13L339.36%2C647.52L338.32%2C650.85L335.89%2C656.71L330.59%2C666.62L328.47%2C671.71L327.86%2C672.67L334%2C678.01L334.01%2C678.02L334.02%2C678.02L334.03%2C678.03L342.66%2C685.09L349.86%2C690.98L357.05%2C696.85L364.25%2C702.73L371.45%2C708.61L380.8%2C716.23L390.16%2C723.85L399.52%2C731.47L408.87%2C739.08L412.83%2C742.3L413.88%2C740.48L431.8%2C709.02L446.51%2C666.58L449.41%2C660.79L452.76%2C656.41L454.04%2C655.11L458.09%2C652.16L463.01%2C650.08L463.57%2C649.69L467.55%2C643.46L470.73%2C639.71L474.52%2C636.25L478.41%2C629.34L480.38%2C624.77L486.56%2C591.1L470.86%2C584.61L469.34%2C583.62L464.02%2C577.32L462.26%2C574.07L462.66%2C571.82L464.47%2C569.76L466.2%2C569.34L468.44%2C570.21L469.84%2C571.03L471.44%2C568.75L470.35%2C561.58L470.4%2C555.52L470.73%2C552.4L467.99%2C538.78L468.57%2C535.76L469.25%2C533.43L469.91%2C532.45L471.51%2C531.81L474.48%2C529.82L476.84%2C528.92L477.27%2C528.62L477.29%2C528.19L476.8%2C527.56L476.08%2C526.98L475.58%2C526.5L475.2%2C525.9L474.9%2C525.26L474.89%2C524.67L475.1%2C524.17L475.93%2C523.65L476.43%2C523.54L476.82%2C523.53L477.17%2C523.13L477.44%2C522.74L478.64%2C518.86L474.49%2C517.5L472.06%2C516.1L470.24%2C514.56L468.01%2C513.37L463.99%2C516.26L463.36%2C516.19L462.69%2C516.33L462.31%2C516.31L460.62%2C517.47L457.71%2C520.25z%22%2F%3E%0A%09%09%3Cpath%20fill%3D%22white%22%20stroke%3D%22none%22%20id%3D%22IQ-SD%22%20title%3D%22Sala%20ad-Din%22%20%20d%3D%22M374.79%2C194.58L375.45%2C194.39L375.65%2C194.31L375.86%2C193.99L375.95%2C193.46L376.03%2C192.23L376.38%2C190.89L376.48%2C190.25L376.52%2C189.34L376.17%2C181.53L375.88%2C180L375.25%2C178.82L374.74%2C178.27L374.3%2C178.02L373.92%2C177.95L373.54%2C177.8L373.33%2C177.53L373.24%2C177.13L373.47%2C176.48L373.63%2C175.69L373.3%2C174.44L372.9%2C173.47L372.51%2C172.87L372.13%2C172.44L371.91%2C172.11L371.81%2C171.73L372.14%2C171.13L372.31%2C170.69L372.84%2C167.94L372.05%2C168.68L371.88%2C169.43L371.57%2C170.88L370.75%2C171.33L369.66%2C171.42L368.49%2C171.8L367.87%2C172.56L366.64%2C174.77L365.49%2C175.66L363.89%2C176.13L362.33%2C177.23L356.98%2C179.48L347.11%2C186.26L345.7%2C186.37L345.04%2C186.58L344.23%2C187.09L342.33%2C188.7L341.32%2C189.37L339%2C190.42L338.72%2C190.45L338.52%2C190.42L338.38%2C190.46L338.24%2C190.56L338.06%2C190.62L337.81%2C190.58L337.52%2C190.59L337.2%2C190.56L336.98%2C190.68L336.72%2C190.97L336.47%2C191.37L336.19%2C191.95L335.91%2C192.16L335.76%2C192.33L335.72%2C192.47L336.44%2C193.63L337.25%2C195.56L337.43%2C196.25L337.29%2C196.86L336.85%2C197.73L336.5%2C198.26L336.38%2C198.54L336.14%2C199.87L336.19%2C200.54L336.37%2C201.3L336.77%2C201.98L336.8%2C203.28L336.98%2C203.91L339.21%2C206.82L339.85%2C207.43L341.13%2C208.43L341.5%2C208.94L341.9%2C209.65L341.96%2C210.39L342.06%2C211.17L343%2C213.76L343.18%2C213.98L343.38%2C214.08L343.56%2C214.03L343.71%2C213.94L343.85%2C213.97L343.9%2C214.2L343.86%2C214.72L343.53%2C215.48L343.37%2C216.11L343.42%2C216.78L343.15%2C218.44L343.12%2C219.16L343.2%2C219.42L343.3%2C219.57L343.43%2C219.6L343.61%2C219.55L343.81%2C219.56L344.23%2C219.69L344.49%2C220.43L345.15%2C221.6L345.24%2C222.18L345.35%2C222.38L345.58%2C222.49L345.82%2C222.54L345.92%2C222.64L345.92%2C223L346.02%2C223.16L346.18%2C223.22L346.45%2C223.2L346.5%2C223.35L346.48%2C223.59L346.31%2C223.84L346.33%2C224L346.49%2C224.1L346.78%2C224.14L347.12%2C224.14L347.37%2C224.2L347.58%2C224.22L347.88%2C224.2L348%2C224.32L348.2%2C225.24L348.31%2C225.52L348.35%2C225.77L348.53%2C226.38L348.61%2C226.76L348.48%2C227.24L348.08%2C228.32L348.1%2C228.56L348.41%2C229.04L348.59%2C229.51L348.45%2C230.15L347.58%2C230.72L344.54%2C231.13L315.43%2C231.32L306.05%2C233.39L304%2C243.1L304.58%2C244.5L304.7%2C266.25L307.96%2C280.63L323.81%2C293.7L327.35%2C295.72L329.96%2C296.08L339.73%2C290.49L341.27%2C298.96L341.65%2C305.11L342.29%2C308.07L344.38%2C311.09L345.62%2C316.37L346.43%2C321.59L350.71%2C332.02L356.31%2C339.52L369.4%2C352.72L380.63%2C362.56L384.95%2C364.17L393.72%2C365.65L403.75%2C369.69L411.15%2C372.15L424.85%2C371.81L427.32%2C372.55L430.17%2C375.15L431.44%2C376.55L432.94%2C379.35L435.5%2C385.77L437.29%2C388.87L438.1%2C389.77L435.37%2C391.91L438.4%2C392.81L441.17%2C394.74L447.19%2C395.1L451.55%2C388.79L452.76%2C387.33L454.67%2C385.55L456.09%2C384.51L459.3%2C381.63L459.98%2C379.09L460.24%2C376.66L459.3%2C374.4L460.51%2C369.1L460.84%2C368.38L461.98%2C366.55L461.98%2C366.13L461.78%2C365.72L460.16%2C364.08L459.61%2C363.38L459.19%2C362.55L458.99%2C361.66L459%2C360.76L459.16%2C359.87L460.68%2C355.66L463.47%2C351.27L463.95%2C349.55L464.03%2C347.72L463.77%2C345.83L463.13%2C344.3L462.16%2C343.07L458.38%2C339.64L457.65%2C339.32L457.15%2C339.11L454.97%2C338.78L452.74%2C339.05L452.08%2C339.24L451.49%2C339.31L451.11%2C339.22L450.85%2C338.97L450.84%2C338.15L450.89%2C337.67L451.8%2C336.36L452.02%2C335.14L452.61%2C333.51L452.5%2C333.02L452.07%2C332.35L452.2%2C332.02L453.95%2C330.8L454.27%2C330.48L454.47%2C329.86L454.47%2C329.44L454.36%2C329.1L453.76%2C328.05L453.66%2C327.67L453.82%2C327.32L454.14%2C327.04L454.82%2C326.88L455.78%2C326.85L455.96%2C326.73L456.06%2C326.46L455.98%2C324.12L455.82%2C323.76L455.64%2C323.5L455.63%2C323.26L455.92%2C323.05L456.67%2C322.88L457.66%2C322.93L458.01%2C322.79L458.35%2C322.49L458.58%2C321.86L458.91%2C321.31L459.19%2C320.96L459.67%2C320.88L459.82%2C321.09L459.85%2C321.38L459.65%2C321.84L459.67%2C321.99L459.82%2C322.1L460.09%2C322.12L460.34%2C321.97L460.52%2C321.67L460.72%2C320.87L461.05%2C320.15L462.74%2C317.64L463.07%2C317.42L463.79%2C317.16L464.73%2C317.11L465.01%2C317.06L465.29%2C316.9L465.61%2C316.64L465.95%2C316.45L466.2%2C316.5L466.66%2C317.01L466.91%2C317.21L467.14%2C317.12L467.31%2C316.71L467.29%2C314.91L467.45%2C314.36L468.06%2C313.95L468.47%2C313.81L468.75%2C313.56L468.82%2C313.17L468.6%2C311.21L469.72%2C310.47L468.77%2C309.29L468.19%2C308.96L467.56%2C308.46L466.81%2C307.6L466.36%2C306.93L466.13%2C306.37L466.13%2C305.94L466.76%2C304.94L467.57%2C303.18L468.12%2C301.33L468.16%2C300.53L467.88%2C299.55L467.69%2C299.06L467.6%2C298.71L468.15%2C298.13L468.34%2C297.81L468.62%2C296.89L468.77%2C296.55L468.82%2C296.28L468.58%2C296.09L468.32%2C296.13L467.87%2C296.41L467.6%2C296.48L467.29%2C296.41L467.12%2C296.23L467.12%2C295.95L467.5%2C295.49L467.67%2C295.22L467.72%2C294.99L467.45%2C294.82L467.24%2C294.89L467.04%2C295.05L466.89%2C295.14L466.83%2C294.98L466.89%2C294.62L467.27%2C293.94L467.59%2C293.68L467.97%2C293.6L468.29%2C293.57L469.07%2C293.32L469.35%2C293.06L469.44%2C292.68L469.07%2C291.9L468.77%2C291.58L468.47%2C291.45L468.25%2C291.46L468.15%2C291.35L468.25%2C291.09L469.23%2C290.2L469.43%2C289.45L469.46%2C288.9L468.22%2C285.69L468.27%2C284.76L468.35%2C284.38L468.53%2C283.84L469.48%2C282.59L469.82%2C282.41L470.54%2C282.82L472.16%2C283.5L473.42%2C283.8L474.14%2C284.14L475.02%2C284.73L478%2C287.43L478.43%2C287.69L478.68%2C287.66L479.09%2C286.47L479.62%2C285.48L480.53%2C284.4L481.92%2C283.2L483.26%2C282.29L484.43%2C281.16L485.46%2C279.75L486.74%2C277.01L486.87%2C275.55L486.6%2C274.39L486.21%2C273.8L485.86%2C273.17L485.69%2C272.56L485.69%2C271.98L486.08%2C271.33L486.87%2C270.61L488.54%2C269.66L490.84%2C268.98L491.84%2C268.54L493.01%2C267.59L494.59%2C265.96L495.68%2C264.13L496.02%2C263.03L495.96%2C262.2L495.87%2C261.56L495.92%2C260.91L496.45%2C260.13L497.41%2C259.36L499.53%2C258.53L502.22%2C257.14L506.08%2C253.58L505.88%2C246.5L506.15%2C245.16L506.2%2C244.71L506.12%2C244.33L505.92%2C243.9L504.93%2C242.7L497.91%2C237.77L494.86%2C237.21L485.92%2C236.83L484.52%2C237.33L482.68%2C236.83L481.34%2C236.19L473.1%2C227.51L472.07%2C227.54L471.58%2C227.78L470.98%2C228.21L470.21%2C229.16L469.54%2C230.23L469.12%2C232.01L469.21%2C233.41L470.85%2C237.3L470.78%2C238.78L469.99%2C240.02L467.76%2C241.7L466.5%2C242.32L465.5%2C242.96L464.89%2C243.58L463.09%2C246.18L461.34%2C247.94L460.08%2C249.89L459.98%2C250.72L459.91%2C250.95L459.88%2C251.14L459.91%2C251.39L459.9%2C251.71L459.63%2C252.2L459.3%2C252.95L459.27%2C253.21L459.23%2C253.39L459.3%2C253.74L459.24%2C254.07L458.86%2C254.68L458.74%2C254.92L458.74%2C255.19L458.61%2C255.5L458.32%2C255.87L457.38%2C256.39L456.09%2C258.21L455.82%2C259.21L455.53%2C259.77L455.07%2C260.36L454.04%2C261.28L453.79%2C261.66L453.7%2C262.05L453.74%2C263.01L453.67%2C263.55L453.39%2C264.63L453.47%2C265.05L453.77%2C265.69L453.79%2C265.92L453.65%2C266.36L453.67%2C266.6L453.82%2C266.79L454.12%2C266.9L454.97%2C267.01L455.01%2C267.26L454.65%2C267.78L452.8%2C269.99L451.57%2C270.02L450.75%2C269.79L444.54%2C264.99L437.72%2C258.11L432.77%2C255.07L425.84%2C251.97L420.11%2C249.8L414.77%2C246.59L398.47%2C236.79L392.15%2C233.86L390.27%2C232.6L389.5%2C231.4L388.01%2C230.34L385.88%2C229.34L384.8%2C227.76L379.44%2C221.94L378.79%2C221.45L377.97%2C220.33L377.26%2C219.07L376.95%2C218.18L377.3%2C217.09L378.1%2C216.59L379.04%2C216.28L379.74%2C215.79L380.04%2C213.88L378.35%2C213.09L374.16%2C212.38L374.68%2C211.73L374.93%2C211.12L375.22%2C209.65L375.15%2C209.23L374.86%2C208.91L374.69%2C208.52L374.95%2C207.91L375.23%2C207.68L375.52%2C207.58L375.75%2C207.47L375.83%2C207.19L375.34%2C205.92L374.18%2C205.12L371.88%2C204.18L370.96%2C203.38L368.89%2C201.08L368.49%2C200.32L368.31%2C200.07L367.93%2C199.79L367.55%2C199.26L367.38%2C198.3L367.5%2C197.3L367.7%2C196.71L367.75%2C196.15L367.38%2C195.22L367.91%2C193.73L369.15%2C194.16L369.48%2C194.35L369.71%2C194.74L369.76%2C195.07L369.87%2C195.35L370.19%2C195.89L370.26%2C196.34L370.27%2C196.8L370.73%2C197.53L371.22%2C197.73L371.95%2C197.66L373.3%2C195.4L374.79%2C194.58z%22%2F%3E%0A%09%09%3Cpath%20fill%3D%22white%22%20stroke%3D%22none%22%20id%3D%22IQ-NI%22%20title%3D%22Ninawa%22%20%20d%3D%22M413.17%2C37.28L410.6%2C36.66L408.32%2C35.75L402.59%2C34.73L401.66%2C34.46L400.21%2C33.66L399.83%2C33.54L399.48%2C33.52L399.22%2C33.6L398.92%2C33.81L398.57%2C34.19L398.32%2C34.55L397.94%2C35.39L397.86%2C35.67L397.87%2C36.04L397.76%2C36.88L397.46%2C37.7L397.26%2C38.46L397.21%2C38.85L397.23%2C39.21L397.26%2C39.51L397.49%2C40L397.53%2C40.28L397.63%2C40.57L397.84%2C40.9L398.68%2C41.51L399.09%2C41.72L399.58%2C41.86L400.72%2C41.9L401.35%2C42.03L402.04%2C42.4L403.42%2C42.85L403.93%2C42.95L404.38%2C43.15L404.64%2C43.46L404.84%2C43.93L404.94%2C44.44L405.01%2C44.95L404.98%2C45.42L404.84%2C45.92L404.16%2C47.33L403.77%2C47.76L403.4%2C48.01L402.95%2C48.19L402.89%2C48.42L403.05%2C49.02L403.09%2C49.38L403.09%2C49.7L403.1%2C49.95L403.15%2C50.2L403.18%2C50.71L403.25%2C51L403.32%2C51.37L403.3%2C51.9L403.2%2C52.54L402.84%2C53.69L402.57%2C53.97L402.27%2C53.99L401.98%2C53.8L400.59%2C53.33L399.83%2C53.46L399.24%2C53.78L398.97%2C54.15L398.83%2C54.67L398.83%2C55.25L398.75%2C55.74L398.53%2C56.21L397.99%2C56.24L396.82%2C56.01L384.98%2C52.81L382.37%2C51.54L380.92%2C50.19L378.46%2C48.41L377.36%2C47.24L376.09%2C46.21L374.84%2C45.54L371.73%2C45.18L370.42%2C45.62L369.27%2C46.51L368.68%2C47.54L366.17%2C50.59L363.77%2C54.56L363.05%2C56.86L362.31%2C58.68L361.95%2C60.29L360.72%2C61.16L358%2C62.57L354.72%2C62.86L344.03%2C64.33L337.34%2C68.07L336.35%2C67.85L335.15%2C67.85L334.21%2C68.04L333.43%2C68.63L332.76%2C69.87L332.06%2C68.28L331.64%2C67.62L331.03%2C67.09L329.86%2C66.47L329.19%2C66.42L326.31%2C67.87L325.46%2C67.93L324.9%2C67.09L325.1%2C66.31L325.85%2C65.7L327.68%2C65L326.97%2C64.25L326.32%2C64.05L325.67%2C63.99L324.9%2C63.61L323.46%2C62.3L320.98%2C59.49L320.26%2C58.95L319.27%2C58.73L318.54%2C58.94L318.1%2C59.4L317.74%2C59.86L317.34%2C60.06L313.9%2C60L312.59%2C59.32L311.48%2C56.21L310.1%2C55.18L307.56%2C53.86L305.93%2C54.49L305.04%2C53.68L305.42%2C52.61L307.56%2C52.46L306.67%2C50.77L305.98%2C50.01L305.79%2C49.06L306.4%2C46.82L305.04%2C46.49L304.98%2C44.84L305.36%2C42.8L305.33%2C41.24L303.74%2C43.08L302.31%2C43.11L300.85%2C42.02L297.74%2C38.94L296.35%2C36.75L295.22%2C34.33L294.65%2C32.15L292.13%2C34.1L286.9%2C39.09L286.9%2C39.1L286.9%2C39.11L286.88%2C39.11L278.45%2C48.16L262.13%2C65.68L251.13%2C77.46L248.97%2C79.31L246.73%2C80.37L221.4%2C85.78L216.1%2C86.66L213.7%2C87.78L212.06%2C90.04L212.06%2C90.05L212.05%2C90.06L212.05%2C90.07L204.84%2C104.19L204.18%2C106.9L201.54%2C132.3L201.55%2C133.98L201.87%2C135.73L203.97%2C140.65L203.97%2C140.65L203.97%2C140.66L210.29%2C154.43L211.17%2C157.66L211.56%2C160.97L211.91%2C174.8L211.46%2C177.95L210.17%2C180.98L207.41%2C185.14L203.56%2C190.96L203.56%2C190.97L203.55%2C190.97L203.54%2C190.97L202.79%2C193.99L202.07%2C203.76L198.67%2C216.12L197.86%2C222.21L197.93%2C224.53L199.68%2C224.58L210.17%2C225.57L223.97%2C229.54L229.45%2C230.42L251.81%2C239.71L262.6%2C243.94L267.91%2C244.29L279.39%2C242.78L280.87%2C243.1L283.73%2C244.45L286.2%2C245.52L304%2C243.1L306.05%2C233.39L315.43%2C231.32L344.54%2C231.13L347.58%2C230.72L348.45%2C230.15L348.59%2C229.51L348.41%2C229.04L348.1%2C228.56L348.08%2C228.32L348.48%2C227.24L348.61%2C226.76L348.53%2C226.38L348.35%2C225.77L348.31%2C225.52L348.2%2C225.24L348%2C224.32L347.88%2C224.2L347.58%2C224.22L347.37%2C224.2L347.12%2C224.14L346.78%2C224.14L346.49%2C224.1L346.33%2C224L346.31%2C223.84L346.48%2C223.59L346.5%2C223.35L346.45%2C223.2L346.18%2C223.22L346.02%2C223.16L345.92%2C223L345.92%2C222.64L345.82%2C222.54L345.58%2C222.49L345.35%2C222.38L345.24%2C222.18L345.15%2C221.6L344.49%2C220.43L344.23%2C219.69L343.81%2C219.56L343.61%2C219.55L343.43%2C219.6L343.3%2C219.57L343.2%2C219.42L343.12%2C219.16L343.15%2C218.44L343.42%2C216.78L343.37%2C216.11L343.53%2C215.48L343.86%2C214.72L343.9%2C214.2L343.85%2C213.97L343.71%2C213.94L343.56%2C214.03L343.38%2C214.08L343.18%2C213.98L343%2C213.76L342.06%2C211.17L341.96%2C210.39L341.9%2C209.65L341.5%2C208.94L341.13%2C208.43L339.85%2C207.43L339.21%2C206.82L336.98%2C203.91L336.8%2C203.28L336.77%2C201.98L336.37%2C201.3L336.19%2C200.54L336.14%2C199.87L336.38%2C198.54L336.5%2C198.26L336.85%2C197.73L337.29%2C196.86L337.43%2C196.25L337.25%2C195.56L336.44%2C193.63L335.72%2C192.47L335.76%2C192.33L335.91%2C192.16L336.19%2C191.95L336.47%2C191.37L336.72%2C190.97L336.98%2C190.68L337.2%2C190.56L337.52%2C190.59L337.81%2C190.58L338.06%2C190.62L338.24%2C190.56L338.38%2C190.46L338.52%2C190.42L338.72%2C190.45L339%2C190.42L341.32%2C189.37L342.33%2C188.7L344.23%2C187.09L345.04%2C186.58L345.7%2C186.37L347.11%2C186.26L356.98%2C179.48L362.33%2C177.23L363.89%2C176.13L365.49%2C175.66L366.64%2C174.77L367.87%2C172.56L368.49%2C171.8L369.66%2C171.42L370.75%2C171.33L371.57%2C170.88L371.88%2C169.43L372.05%2C168.68L372.84%2C167.94L371.5%2C164.77L371.4%2C164.2L371.33%2C163.35L371.65%2C162.16L373.42%2C158.09L373.85%2C157.44L374.3%2C157.16L374.89%2C157.16L375.53%2C157.02L376.13%2C156.43L377.01%2C154.41L377.75%2C147.42L377.74%2C145.54L377.46%2C144.82L376.41%2C144.81L375.07%2C144.64L374.2%2C143.74L373.7%2C141.2L374.36%2C140.17L384.95%2C135.7L385.83%2C134.87L386.99%2C133.14L387.23%2C132.62L387.33%2C132.13L387.2%2C130.13L387.23%2C129.46L387.4%2C128.61L389.15%2C125.35L389.37%2C124.69L389.56%2C123.97L389.97%2C123.06L390.26%2C122.75L390.94%2C122.65L392.53%2C121.48L393.46%2C119.49L393.9%2C118.31L394.33%2C117.66L396.91%2C115.31L397.64%2C114.31L398.59%2C112.66L399.24%2C111.78L399.89%2C111.18L401.73%2C110.37L402.89%2C108.99L403.53%2C108.69L405.04%2C107.71L406.36%2C106.49L409.79%2C102.36L411.18%2C99.98L411.77%2C97.96L411.68%2C96.47L411.56%2C95.54L411.2%2C94.61L411.25%2C94.23L411.48%2C93.97L411.77%2C93.95L412.68%2C94.11L413.27%2C94.12L413.86%2C93.91L414.51%2C93.54L415.28%2C92.95L415.56%2C92.46L415.66%2C91.92L415.66%2C91.48L415.63%2C91.1L415.51%2C90.74L415.32%2C90.4L415.15%2C89.96L415.1%2C88.97L415.3%2C88.54L415.63%2C88.33L417.69%2C88.59L418.21%2C88.57L418.94%2C88.3L419.32%2C87.73L419.49%2C87.1L419.41%2C85.86L419.52%2C85.13L419.73%2C84.85L419.97%2C84.81L420.23%2C85.03L420.49%2C85.31L420.71%2C85.66L421.12%2C85.78L421.63%2C85.62L422.77%2C84.75L423.34%2C84L424.15%2C83.33L424.47%2C82.86L424.7%2C82.45L425.03%2C81.58L427.1%2C79.2L427.78%2C78.64L428.22%2C78.41L428.44%2C78.59L428.69%2C78.69L429.08%2C78.64L429.17%2C78.4L428.88%2C77.92L428.77%2C77.55L428.8%2C77.03L428.99%2C76.85L429.15%2C76.88L429.31%2C77.16L429.4%2C77.51L429.51%2C77.79L429.76%2C78.06L430.09%2C78.26L430.49%2C78.34L430.87%2C78.29L431.31%2C78.13L431.69%2C78.07L432.06%2C78.08L432.23%2C78.19L432.29%2C78.44L432.18%2C78.78L432.02%2C79.16L431.95%2C79.55L432.02%2C79.92L432.28%2C80.22L432.82%2C80.39L433.07%2C80.26L433.2%2C79.91L433.22%2C79.52L433.35%2C78.97L433.57%2C78.72L433.85%2C78.6L434.16%2C78.64L434.45%2C78.61L435.27%2C78.22L435.71%2C78.09L436.13%2C78.11L436.58%2C78.24L436.88%2C78.43L437.01%2C78.62L436.99%2C78.9L437.09%2C79.2L437.41%2C79.35L438.25%2C79.2L439.29%2C78.28L440.7%2C77.41L442.93%2C75.39L443.55%2C74.95L444.95%2C74.47L446.24%2C72.44L448.54%2C70.38L451.46%2C66.47L451.87%2C65.58L451.92%2C65.09L451.85%2C64.71L451.7%2C64.41L451.52%2C64.24L451.33%2C64.21L451.14%2C64.3L450.94%2C64.5L450.75%2C64.57L450.53%2C64.47L450.04%2C63.32L449.79%2C62.57L448.94%2C61.68L448.86%2C61.22L448.79%2C60.35L448.63%2C59.95L448.19%2C59.51L447.5%2C59.1L446.13%2C58.01L438.43%2C54.62L437.85%2C54.2L437.47%2C53.78L437.19%2C53.25L436.8%2C52.99L436.52%2C52.86L434.07%2C52.63L433.32%2C52.46L432.97%2C52.48L432.61%2C52.58L431.98%2C52.65L431.68%2C52.46L431%2C51.38L430.93%2C51.09L431.04%2C50.82L431.12%2C50.39L431.09%2C49.92L430.56%2C49.11L430.23%2C48.82L429.88%2C48.72L429.58%2C48.8L428.24%2C48.85L428.06%2C48.66L428.07%2C48.47L428.29%2C48.32L428.61%2C48.25L428.82%2C48.09L428.87%2C47.8L428.49%2C47.15L428.26%2C46.65L428.16%2C46.15L427.74%2C45.53L427.25%2C45.13L426.2%2C44.59L425.06%2C43.67L423.41%2C42.65L421.59%2C40.88L421.16%2C40.54L420.71%2C40.41L420.23%2C40.52L418.36%2C40.11L413.17%2C37.28z%22%2F%3E%0A%09%09%3Cpath%20fill%3D%22white%22%20stroke%3D%22none%22%20id%3D%22IQ-AR%22%20title%3D%22Arbil%22%20%20d%3D%22M450.46%2C41.64L447.07%2C40.76L446.33%2C40.16L445.8%2C39.09L442.51%2C31.64L441.9%2C29.53L441.95%2C27.34L442.65%2C25.27L444.02%2C23.48L445.07%2C22.87L446%2C22.69L446.81%2C22.32L447.48%2C21.12L447.59%2C20.12L447.5%2C18.84L447.09%2C16.6L446.39%2C14.24L445.43%2C12.47L444.1%2C11.09L442.27%2C9.89L434.39%2C6.61L432.84%2C6.34L432.45%2C7.82L432.73%2C8.31L432.99%2C8.44L433.19%2C8.61L433.37%2C9.05L433.42%2C9.21L433.55%2C9.34L433.72%2C9.44L433.91%2C9.53L434.06%2C9.67L434.3%2C9.8L434.41%2C10.07L434.41%2C10.41L433.68%2C11.9L433.45%2C12.57L433.4%2C12.99L433.42%2C13.37L433.57%2C13.96L433.64%2C14.57L433.8%2C14.86L434.01%2C15.04L434.31%2C15.15L434.82%2C15.16L434.97%2C15.23L435.1%2C15.38L435.32%2C16.55L435.32%2C16.95L435.25%2C17.23L434.35%2C17.62L433.47%2C18.33L432.83%2C18.97L431.86%2C20.29L431.6%2C20.86L431.55%2C21.26L431.92%2C21.97L431.75%2C22.26L431.32%2C22.59L430.27%2C23.01L428.57%2C23.92L428.12%2C24.33L426.89%2C26.07L426.59%2C26.63L426.12%2C27.07L425.46%2C27.48L423.99%2C28.18L423.29%2C28.43L422.93%2C28.67L423.08%2C28.99L423.26%2C29.21L423.23%2C29.42L422.86%2C29.67L419.8%2C30.9L418.38%2C31.73L417.9%2C32.14L417.63%2C32.75L417.27%2C33.86L416.95%2C34.37L416.57%2C34.74L415.9%2C34.91L414.79%2C35.46L413.17%2C37.28L418.36%2C40.11L420.23%2C40.52L420.71%2C40.41L421.16%2C40.54L421.59%2C40.88L423.41%2C42.65L425.06%2C43.67L426.2%2C44.59L427.25%2C45.13L427.74%2C45.53L428.16%2C46.15L428.26%2C46.65L428.49%2C47.15L428.87%2C47.8L428.82%2C48.09L428.61%2C48.25L428.29%2C48.32L428.07%2C48.47L428.06%2C48.66L428.24%2C48.85L429.58%2C48.8L429.88%2C48.72L430.23%2C48.82L430.56%2C49.11L431.09%2C49.92L431.12%2C50.39L431.04%2C50.82L430.93%2C51.09L431%2C51.38L431.68%2C52.46L431.98%2C52.65L432.61%2C52.58L432.97%2C52.48L433.32%2C52.46L434.07%2C52.63L436.52%2C52.86L436.8%2C52.99L437.19%2C53.25L437.47%2C53.78L437.85%2C54.2L438.43%2C54.62L446.13%2C58.01L447.5%2C59.1L448.19%2C59.51L448.63%2C59.95L448.79%2C60.35L448.86%2C61.22L448.94%2C61.68L449.79%2C62.57L450.04%2C63.32L450.53%2C64.47L450.75%2C64.57L450.94%2C64.5L451.14%2C64.3L451.33%2C64.21L451.52%2C64.24L451.7%2C64.41L451.85%2C64.71L451.92%2C65.09L451.87%2C65.58L451.46%2C66.47L448.54%2C70.38L446.24%2C72.44L444.95%2C74.47L443.55%2C74.95L442.93%2C75.39L440.7%2C77.41L439.29%2C78.28L438.25%2C79.2L437.41%2C79.35L437.09%2C79.2L436.99%2C78.9L437.01%2C78.62L436.88%2C78.43L436.58%2C78.24L436.13%2C78.11L435.71%2C78.09L435.27%2C78.22L434.45%2C78.61L434.16%2C78.64L433.85%2C78.6L433.57%2C78.72L433.35%2C78.97L433.22%2C79.52L433.2%2C79.91L433.07%2C80.26L432.82%2C80.39L432.28%2C80.22L432.02%2C79.92L431.95%2C79.55L432.02%2C79.16L432.18%2C78.78L432.29%2C78.44L432.23%2C78.19L432.06%2C78.08L431.69%2C78.07L431.31%2C78.13L430.87%2C78.29L430.49%2C78.34L430.09%2C78.26L429.76%2C78.06L429.51%2C77.79L429.4%2C77.51L429.31%2C77.16L429.15%2C76.88L428.99%2C76.85L428.8%2C77.03L428.77%2C77.55L428.88%2C77.92L429.17%2C78.4L429.08%2C78.64L428.69%2C78.69L428.44%2C78.59L428.22%2C78.41L427.78%2C78.64L427.1%2C79.2L425.03%2C81.58L424.7%2C82.45L424.47%2C82.86L424.15%2C83.33L423.34%2C84L422.77%2C84.75L421.63%2C85.62L421.12%2C85.78L420.71%2C85.66L420.49%2C85.31L420.23%2C85.03L419.97%2C84.81L419.73%2C84.85L419.52%2C85.13L419.41%2C85.86L419.49%2C87.1L419.32%2C87.73L418.94%2C88.3L418.21%2C88.57L417.69%2C88.59L415.63%2C88.33L415.3%2C88.54L415.1%2C88.97L415.15%2C89.96L415.32%2C90.4L415.51%2C90.74L415.63%2C91.1L415.66%2C91.48L415.66%2C91.92L415.56%2C92.46L415.28%2C92.95L414.51%2C93.54L413.86%2C93.91L413.27%2C94.12L412.68%2C94.11L411.77%2C93.95L411.48%2C93.97L411.25%2C94.23L411.2%2C94.61L411.56%2C95.54L411.68%2C96.47L411.77%2C97.96L411.18%2C99.98L409.79%2C102.36L406.36%2C106.49L405.04%2C107.71L403.53%2C108.69L402.89%2C108.99L401.73%2C110.37L399.89%2C111.18L399.24%2C111.78L398.59%2C112.66L397.64%2C114.31L396.91%2C115.31L394.33%2C117.66L393.9%2C118.31L393.46%2C119.49L392.53%2C121.48L390.94%2C122.65L390.26%2C122.75L389.97%2C123.06L389.56%2C123.97L389.37%2C124.69L389.15%2C125.35L387.4%2C128.61L387.23%2C129.46L387.2%2C130.13L387.33%2C132.13L387.23%2C132.62L386.99%2C133.14L385.83%2C134.87L384.95%2C135.7L374.36%2C140.17L373.7%2C141.2L374.2%2C143.74L375.07%2C144.64L376.41%2C144.81L377.46%2C144.82L377.74%2C145.54L377.75%2C147.42L377.01%2C154.41L376.13%2C156.43L375.53%2C157.02L374.89%2C157.16L374.3%2C157.16L373.85%2C157.44L373.42%2C158.09L371.65%2C162.16L371.33%2C163.35L371.4%2C164.2L371.5%2C164.77L372.84%2C167.94L372.31%2C170.69L372.14%2C171.13L371.81%2C171.73L371.91%2C172.11L372.13%2C172.44L372.51%2C172.87L372.9%2C173.47L373.3%2C174.44L373.63%2C175.69L373.47%2C176.48L373.24%2C177.13L373.33%2C177.53L373.54%2C177.8L373.92%2C177.95L374.3%2C178.02L374.74%2C178.27L375.25%2C178.82L375.88%2C180L376.17%2C181.53L376.52%2C189.34L376.48%2C190.25L376.38%2C190.89L376.03%2C192.23L375.95%2C193.46L375.86%2C193.99L375.65%2C194.31L375.45%2C194.39L374.79%2C194.58L378.47%2C196.93L379.26%2C197.3L380.97%2C197.77L381.84%2C197.8L382.67%2C197.64L384.29%2C196.19L385.55%2C195.79L389.04%2C195.63L390.64%2C195.37L391.93%2C194.64L392.64%2C193.45L393.59%2C190.54L394.38%2C189.46L395.49%2C188.95L397.31%2C188.99L400.04%2C188.76L402.69%2C187.16L404.43%2C187L405.31%2C186.64L406.12%2C185.56L406.96%2C182.56L407.41%2C180.06L407.97%2C178.89L409.21%2C177.36L410.27%2C176.37L410.96%2C175.46L411.01%2C174.34L410.68%2C173.42L410.17%2C172.51L408.38%2C170.47L407.85%2C170.01L407.79%2C169.37L408.3%2C168.5L413.3%2C164.26L419.19%2C157.85L420.01%2C155.63L421.26%2C155.39L423.11%2C156.08L431.73%2C162.27L434.78%2C162.15L436.52%2C161.82L437.28%2C161.35L438%2C159.85L439.19%2C156.65L441.07%2C155.92L442.44%2C155.64L446.92%2C156.52L448.71%2C156.87L450.25%2C157.66L450.73%2C157.76L451.39%2C157.71L452.19%2C157.51L453.37%2C156.87L453.84%2C156.44L454.24%2C155.81L454.55%2C155.8L455.55%2C156.31L456.03%2C156.45L457.33%2C156.67L457.69%2C156.84L457.94%2C156.9L458.19%2C156.85L458.61%2C155.99L458.89%2C155.77L460.42%2C155.11L460.87%2C154.84L461.23%2C154.48L461.66%2C154.18L462.26%2C154.11L463.28%2C154.28L463.99%2C154.27L465.74%2C153.25L467.54%2C153.81L467.76%2C154.1L467.99%2C154.23L468.37%2C154.17L469.07%2C153.77L469.56%2C153.63L470.16%2C153.85L470.5%2C154.21L471.02%2C154.98L471.34%2C155.18L471.63%2C155.12L471.78%2C154.65L471.73%2C154.3L471.63%2C153.98L471.56%2C153.64L471.61%2C153.32L471.92%2C153.09L472.24%2C153.02L473.1%2C153.58L473.43%2C153.64L473.83%2C153.2L474.16%2C152.74L474.64%2C152.23L475.33%2C151.66L475.62%2C151.17L475.93%2C150.4L476.16%2C150.07L476.54%2C149.81L477.42%2C149.37L477.69%2C149.42L477.94%2C149.78L477.94%2C150.75L478.43%2C151.61L479.92%2C150.91L480.16%2C150.95L480.54%2C151.13L480.76%2C151.46L481.09%2C151.79L481.4%2C151.74L482.29%2C151.22L482.65%2C151.23L482.88%2C151.38L483.03%2C151.6L483.05%2C151.84L483.03%2C152.09L483.06%2C152.38L483.36%2C152.8L483.77%2C152.87L484.24%2C152.8L486.19%2C152.19L486.82%2C152.23L487.25%2C152.35L487.66%2C153.03L488.13%2C153.43L488.56%2C153.47L489.03%2C153.29L489.47%2C153L490.17%2C152.74L490.68%2C152.78L491.04%2C152.93L491.4%2C153.33L491.7%2C153.78L492.36%2C154.31L492.74%2C154.35L492.99%2C154.13L493.06%2C153.8L493.14%2C153.13L493.27%2C152.81L493.5%2C152.49L493.84%2C152.16L494.1%2C152.15L494.4%2C152.26L494.66%2C152.46L494.81%2C152.74L494.89%2C154.24L495.06%2C154.79L495.26%2C154.93L495.51%2C154.85L496.29%2C154.06L497.54%2C153.62L498%2C152.99L497.91%2C152.74L497.03%2C151.1L497.08%2C150.83L497.31%2C150.69L497.96%2C150.56L498.25%2C150.59L498.76%2C150.81L499.04%2C150.85L499.91%2C150.72L500.31%2C150.79L500.59%2C150.96L500.97%2C151.36L501.15%2C151.5L501.33%2C151.62L501.48%2C151.84L501.91%2C152.12L502.69%2C152.34L504.56%2C152.39L505.42%2C152.27L506.01%2C152.06L506.53%2C151.63L506.69%2C151.35L506.87%2C150.75L506.99%2C150.52L507.04%2C150.29L507.01%2C150.02L506.89%2C149.73L506.35%2C149.06L500.82%2C146.3L498.8%2C144.88L496.22%2C142.46L490.24%2C135.21L489.46%2C134.56L488.49%2C133.92L486.62%2C133.12L478.43%2C127.27L478%2C126.34L477.64%2C125.06L479.4%2C123.64L480.03%2C123L480.48%2C122.31L480.91%2C121.49L481.54%2C121.01L483.44%2C120.12L484.2%2C119.26L483.97%2C118.42L483.51%2C117.66L479.41%2C112.69L478.6%2C112.01L477.74%2C111.97L477.21%2C112.36L476.42%2C113.27L471.72%2C106.08L471.26%2C104.9L471.29%2C102.75L473.98%2C100.36L474.89%2C99.02L476.46%2C97.18L478.96%2C95.28L480.66%2C94.72L482.01%2C94.91L484.35%2C95.6L488.08%2C95.01L491.65%2C94.06L495.89%2C91.92L497.69%2C91.52L499.36%2C91.48L502.85%2C92.35L505.67%2C92.55L506.84%2C92.11L507.75%2C91.46L508.86%2C89.78L509.31%2C88.78L509.64%2C87.81L509.64%2C87.8L509.34%2C87.55L508.16%2C86.02L508.32%2C84.4L508.69%2C84.15L509.7%2C83.76L509.94%2C83.56L510.02%2C81.42L510.89%2C77.94L512.48%2C74.26L512.61%2C72.36L511.74%2C70.16L509.76%2C66.5L508.55%2C64.86L507.18%2C64.11L506.12%2C64.08L505.17%2C63.77L504.32%2C63.17L503.57%2C62.27L502.55%2C61.37L501.37%2C61.17L498.84%2C61.31L496.71%2C60.83L495.08%2C59.74L494.44%2C57.96L495.32%2C55.44L498.22%2C51.88L499.34%2C50.05L499.78%2C47.59L499.39%2C45.3L498.64%2C43.64L498.18%2C41.83L498.63%2C39.1L499.53%2C37.97L499.66%2C36.86L499.12%2C35.94L497.34%2C35L496.41%2C33.98L495.85%2C33.66L495.06%2C33.7L493.44%2C34.2L492.68%2C34.04L492.31%2C33.53L491.9%2C31.97L491.58%2C31.3L490.99%2C30.87L490.38%2C30.68L489.8%2C30.41L489.32%2C29.73L488.67%2C27.92L488.65%2C26.91L489.76%2C23.96L488.76%2C22.2L487.12%2C21.37L478.56%2C20.16L477.04%2C20.23L474.42%2C21.46L471.25%2C23.78L468.31%2C26.56L466.34%2C29.08L464.31%2C30.68L462.16%2C31.86L455.22%2C34.15L454.57%2C35.3L454.28%2C36.91L453.02%2C39.09L453.02%2C39.1L453.01%2C39.11L453%2C39.11L452.24%2C40.82L451.47%2C41.56L450.46%2C41.64z%22%2F%3E%0A%09%09%3Cpath%20fill%3D%22white%22%20stroke%3D%22none%22%20id%3D%22IQ-KI%22%20title%3D%22Kirkuk%22%20%20d%3D%22M478.43%2C151.61L477.94%2C150.75L477.94%2C149.78L477.69%2C149.42L477.42%2C149.37L476.54%2C149.81L476.16%2C150.07L475.93%2C150.4L475.62%2C151.17L475.33%2C151.66L474.64%2C152.23L474.16%2C152.74L473.83%2C153.2L473.43%2C153.64L473.1%2C153.58L472.24%2C153.02L471.92%2C153.09L471.61%2C153.32L471.56%2C153.64L471.63%2C153.98L471.73%2C154.3L471.78%2C154.65L471.63%2C155.12L471.34%2C155.18L471.02%2C154.98L470.5%2C154.21L470.16%2C153.85L469.56%2C153.63L469.07%2C153.77L468.37%2C154.17L467.99%2C154.23L467.76%2C154.1L467.54%2C153.81L465.74%2C153.25L463.99%2C154.27L463.28%2C154.28L462.26%2C154.11L461.66%2C154.18L461.23%2C154.48L460.87%2C154.84L460.42%2C155.11L458.89%2C155.77L458.61%2C155.99L458.19%2C156.85L457.94%2C156.9L457.69%2C156.84L457.33%2C156.67L456.03%2C156.45L455.55%2C156.31L454.55%2C155.8L454.24%2C155.81L453.84%2C156.44L453.37%2C156.87L452.19%2C157.51L451.39%2C157.71L450.73%2C157.76L450.25%2C157.66L448.71%2C156.87L446.92%2C156.52L442.44%2C155.64L441.07%2C155.92L439.19%2C156.65L438%2C159.85L437.28%2C161.35L436.52%2C161.82L434.78%2C162.15L431.73%2C162.27L423.11%2C156.08L421.26%2C155.39L420.01%2C155.63L419.19%2C157.85L413.3%2C164.26L408.3%2C168.5L407.79%2C169.37L407.85%2C170.01L408.38%2C170.47L410.17%2C172.51L410.68%2C173.42L411.01%2C174.34L410.96%2C175.46L410.27%2C176.37L409.21%2C177.36L407.97%2C178.89L407.41%2C180.06L406.96%2C182.56L406.12%2C185.56L405.31%2C186.64L404.43%2C187L402.69%2C187.16L400.04%2C188.76L397.31%2C188.99L395.49%2C188.95L394.38%2C189.46L393.59%2C190.54L392.64%2C193.45L391.93%2C194.64L390.64%2C195.37L389.04%2C195.63L385.55%2C195.79L384.29%2C196.19L382.67%2C197.64L381.84%2C197.8L380.97%2C197.77L379.26%2C197.3L378.47%2C196.93L374.79%2C194.58L373.3%2C195.4L371.95%2C197.66L371.22%2C197.73L370.73%2C197.53L370.27%2C196.8L370.26%2C196.34L370.19%2C195.89L369.87%2C195.35L369.76%2C195.07L369.71%2C194.74L369.48%2C194.35L369.15%2C194.16L367.91%2C193.73L367.38%2C195.22L367.75%2C196.15L367.7%2C196.71L367.5%2C197.3L367.38%2C198.3L367.55%2C199.26L367.93%2C199.79L368.31%2C200.07L368.49%2C200.32L368.89%2C201.08L370.96%2C203.38L371.88%2C204.18L374.18%2C205.12L375.34%2C205.92L375.83%2C207.19L375.75%2C207.47L375.52%2C207.58L375.23%2C207.68L374.95%2C207.91L374.69%2C208.52L374.86%2C208.91L375.15%2C209.23L375.22%2C209.65L374.93%2C211.12L374.68%2C211.73L374.16%2C212.38L378.35%2C213.09L380.04%2C213.88L379.74%2C215.79L379.04%2C216.28L378.1%2C216.59L377.3%2C217.09L376.95%2C218.18L377.26%2C219.07L377.97%2C220.33L378.79%2C221.45L379.44%2C221.94L384.8%2C227.76L385.88%2C229.34L388.01%2C230.34L389.5%2C231.4L390.27%2C232.6L392.15%2C233.86L398.47%2C236.79L414.77%2C246.59L420.11%2C249.8L425.84%2C251.97L432.77%2C255.07L437.72%2C258.11L444.54%2C264.99L450.75%2C269.79L451.57%2C270.02L452.8%2C269.99L454.65%2C267.78L455.01%2C267.26L454.97%2C267.01L454.12%2C266.9L453.82%2C266.79L453.67%2C266.6L453.65%2C266.36L453.79%2C265.92L453.77%2C265.69L453.47%2C265.05L453.39%2C264.63L453.67%2C263.55L453.74%2C263.01L453.7%2C262.05L453.79%2C261.66L454.04%2C261.28L455.07%2C260.36L455.53%2C259.77L455.82%2C259.21L456.09%2C258.21L457.38%2C256.39L458.32%2C255.87L458.61%2C255.5L458.74%2C255.19L458.74%2C254.92L458.86%2C254.68L459.24%2C254.07L459.3%2C253.74L459.23%2C253.39L459.27%2C253.21L459.3%2C252.95L459.63%2C252.2L459.9%2C251.71L459.91%2C251.39L459.88%2C251.14L459.91%2C250.95L459.98%2C250.72L460.08%2C249.89L461.34%2C247.94L463.09%2C246.18L464.89%2C243.58L465.5%2C242.96L466.5%2C242.32L467.76%2C241.7L469.99%2C240.02L470.78%2C238.78L470.85%2C237.3L469.21%2C233.41L469.12%2C232.01L469.54%2C230.23L470.21%2C229.16L470.98%2C228.21L471.58%2C227.78L472.07%2C227.54L473.1%2C227.51L476.72%2C224.44L483.08%2C222.43L483.95%2C221.59L484.17%2C220.75L483.62%2C219.37L483.49%2C218.63L483.54%2C217.78L483.86%2C216.87L484.7%2C215.61L485.68%2C214.92L486.43%2C214.5L487.04%2C214.31L487.33%2C213.87L487.56%2C213.25L487.79%2C211.91L488.67%2C209.79L489.02%2C208.24L488.7%2C206.75L488.19%2C205.06L487.95%2C203.57L488.57%2C201.62L491.55%2C197.56L492.38%2C195.88L492.81%2C194.48L492.71%2C193.33L491.14%2C191.17L489.41%2C189.21L488.85%2C188.2L488.65%2C187.22L488.94%2C184.33L489.19%2C180.72L489.52%2C179.55L489.7%2C176.98L490.03%2C175.92L491.41%2C173.43L491.34%2C171.75L490.66%2C169.76L486.87%2C166.38L485.01%2C163.82L482.93%2C161.55L478.43%2C151.61z%22%2F%3E%0A%09%09%3Cpath%20fill%3D%22white%22%20stroke%3D%22none%22%20id%3D%22IQ-DA%22%20title%3D%22Dihok%22%20%20d%3D%22M327.62%2C0L326.89%2C0.06L322.86%2C1.7L322.32%2C2.08L321.82%2C2.91L321.65%2C3.63L321.55%2C4.34L321.24%2C5.15L311%2C20.14L309.99%2C22.93L309.72%2C23.48L308.41%2C24.07L301.38%2C25.26L296.7%2C26.81L293.06%2C27.24L293.58%2C28.45L294.19%2C29.49L294.66%2C30.64L294.68%2C32.12L294.65%2C32.15L295.22%2C34.33L296.35%2C36.75L297.74%2C38.94L300.85%2C42.02L302.31%2C43.11L303.74%2C43.08L305.33%2C41.24L305.36%2C42.8L304.98%2C44.84L305.04%2C46.49L306.4%2C46.82L305.79%2C49.06L305.98%2C50.01L306.67%2C50.77L307.56%2C52.46L305.42%2C52.61L305.04%2C53.68L305.93%2C54.49L307.56%2C53.86L310.1%2C55.18L311.48%2C56.21L312.59%2C59.32L313.9%2C60L317.34%2C60.06L317.74%2C59.86L318.1%2C59.4L318.54%2C58.94L319.27%2C58.73L320.26%2C58.95L320.98%2C59.49L323.46%2C62.3L324.9%2C63.61L325.67%2C63.99L326.32%2C64.05L326.97%2C64.25L327.68%2C65L325.85%2C65.7L325.1%2C66.31L324.9%2C67.09L325.46%2C67.93L326.31%2C67.87L329.19%2C66.42L329.86%2C66.47L331.03%2C67.09L331.64%2C67.62L332.06%2C68.28L332.76%2C69.87L333.43%2C68.63L334.21%2C68.04L335.15%2C67.85L336.35%2C67.85L337.34%2C68.07L344.03%2C64.33L354.72%2C62.86L358%2C62.57L360.72%2C61.16L361.95%2C60.29L362.31%2C58.68L363.05%2C56.86L363.77%2C54.56L366.17%2C50.59L368.68%2C47.54L369.27%2C46.51L370.42%2C45.62L371.73%2C45.18L374.84%2C45.54L376.09%2C46.21L377.36%2C47.24L378.46%2C48.41L380.92%2C50.19L382.37%2C51.54L384.98%2C52.81L396.82%2C56.01L397.99%2C56.24L398.53%2C56.21L398.75%2C55.74L398.83%2C55.25L398.83%2C54.67L398.97%2C54.15L399.24%2C53.78L399.83%2C53.46L400.59%2C53.33L401.98%2C53.8L402.27%2C53.99L402.57%2C53.97L402.84%2C53.69L403.2%2C52.54L403.3%2C51.9L403.32%2C51.37L403.25%2C51L403.18%2C50.71L403.15%2C50.2L403.1%2C49.95L403.09%2C49.7L403.09%2C49.38L403.05%2C49.02L402.89%2C48.42L402.95%2C48.19L403.4%2C48.01L403.77%2C47.76L404.16%2C47.33L404.84%2C45.92L404.98%2C45.42L405.01%2C44.95L404.94%2C44.44L404.84%2C43.93L404.64%2C43.46L404.38%2C43.15L403.93%2C42.95L403.42%2C42.85L402.04%2C42.4L401.35%2C42.03L400.72%2C41.9L399.58%2C41.86L399.09%2C41.72L398.68%2C41.51L397.84%2C40.9L397.63%2C40.57L397.53%2C40.28L397.49%2C40L397.26%2C39.51L397.23%2C39.21L397.21%2C38.85L397.26%2C38.46L397.46%2C37.7L397.76%2C36.88L397.87%2C36.04L397.86%2C35.67L397.94%2C35.39L398.32%2C34.55L398.57%2C34.19L398.92%2C33.81L399.22%2C33.6L399.48%2C33.52L399.83%2C33.54L400.21%2C33.66L401.66%2C34.46L402.59%2C34.73L408.32%2C35.75L410.6%2C36.66L413.17%2C37.28L414.79%2C35.46L415.9%2C34.91L416.57%2C34.74L416.95%2C34.37L417.27%2C33.86L417.63%2C32.75L417.9%2C32.14L418.38%2C31.73L419.8%2C30.9L422.86%2C29.67L423.23%2C29.42L423.26%2C29.21L423.08%2C28.99L422.93%2C28.67L423.29%2C28.43L423.99%2C28.18L425.46%2C27.48L426.12%2C27.07L426.59%2C26.63L426.89%2C26.07L428.12%2C24.33L428.57%2C23.92L430.27%2C23.01L431.32%2C22.59L431.75%2C22.26L431.92%2C21.97L431.55%2C21.26L431.6%2C20.86L431.86%2C20.29L432.83%2C18.97L433.47%2C18.33L434.35%2C17.62L435.25%2C17.23L435.32%2C16.95L435.32%2C16.55L435.1%2C15.38L434.97%2C15.23L434.82%2C15.16L434.31%2C15.15L434.01%2C15.04L433.8%2C14.86L433.64%2C14.57L433.57%2C13.96L433.42%2C13.37L433.4%2C12.99L433.45%2C12.57L433.68%2C11.9L434.41%2C10.41L434.41%2C10.07L434.3%2C9.8L434.06%2C9.67L433.91%2C9.53L433.72%2C9.44L433.55%2C9.34L433.42%2C9.21L433.37%2C9.05L433.19%2C8.61L432.99%2C8.44L432.73%2C8.31L432.45%2C7.82L432.84%2C6.34L430.11%2C5.88L426.42%2C6.47L423.43%2C9.04L421.01%2C12.57L418.52%2C15.46L414.14%2C16.26L412.67%2C17.77L411.64%2C18.04L411.04%2C17.65L409.28%2C15.92L408.47%2C15.36L406.54%2C14.87L404.4%2C14.67L396.03%2C15.25L394.07%2C14.99L392%2C14.15L390.5%2C13.01L389.84%2C12.65L388.78%2C12.48L387.77%2C12.65L385.75%2C13.42L384.71%2C13.57L383.37%2C13.02L379.58%2C9.89L376.25%2C8.21L375.14%2C7.35L372.99%2C5.68L372.01%2C5.47L370.5%2C5.7L369.78%2C6.04L369.02%2C6.82L368.3%2C6.96L367.62%2C6.86L367.05%2C6.66L356.32%2C0.85L354.92%2C0.45L352.38%2C0.68L349.09%2C1.57L345.96%2C2.9L343.88%2C4.49L340.4%2C5.69L337.11%2C5.2L330.36%2C2.95L329.66%2C2.43L329.3%2C0.66L328.59%2C0.12L327.62%2C0z%22%2F%3E%0A%09%3C%2Fg%3E%0A%3C%2Fsvg%3E%0A)
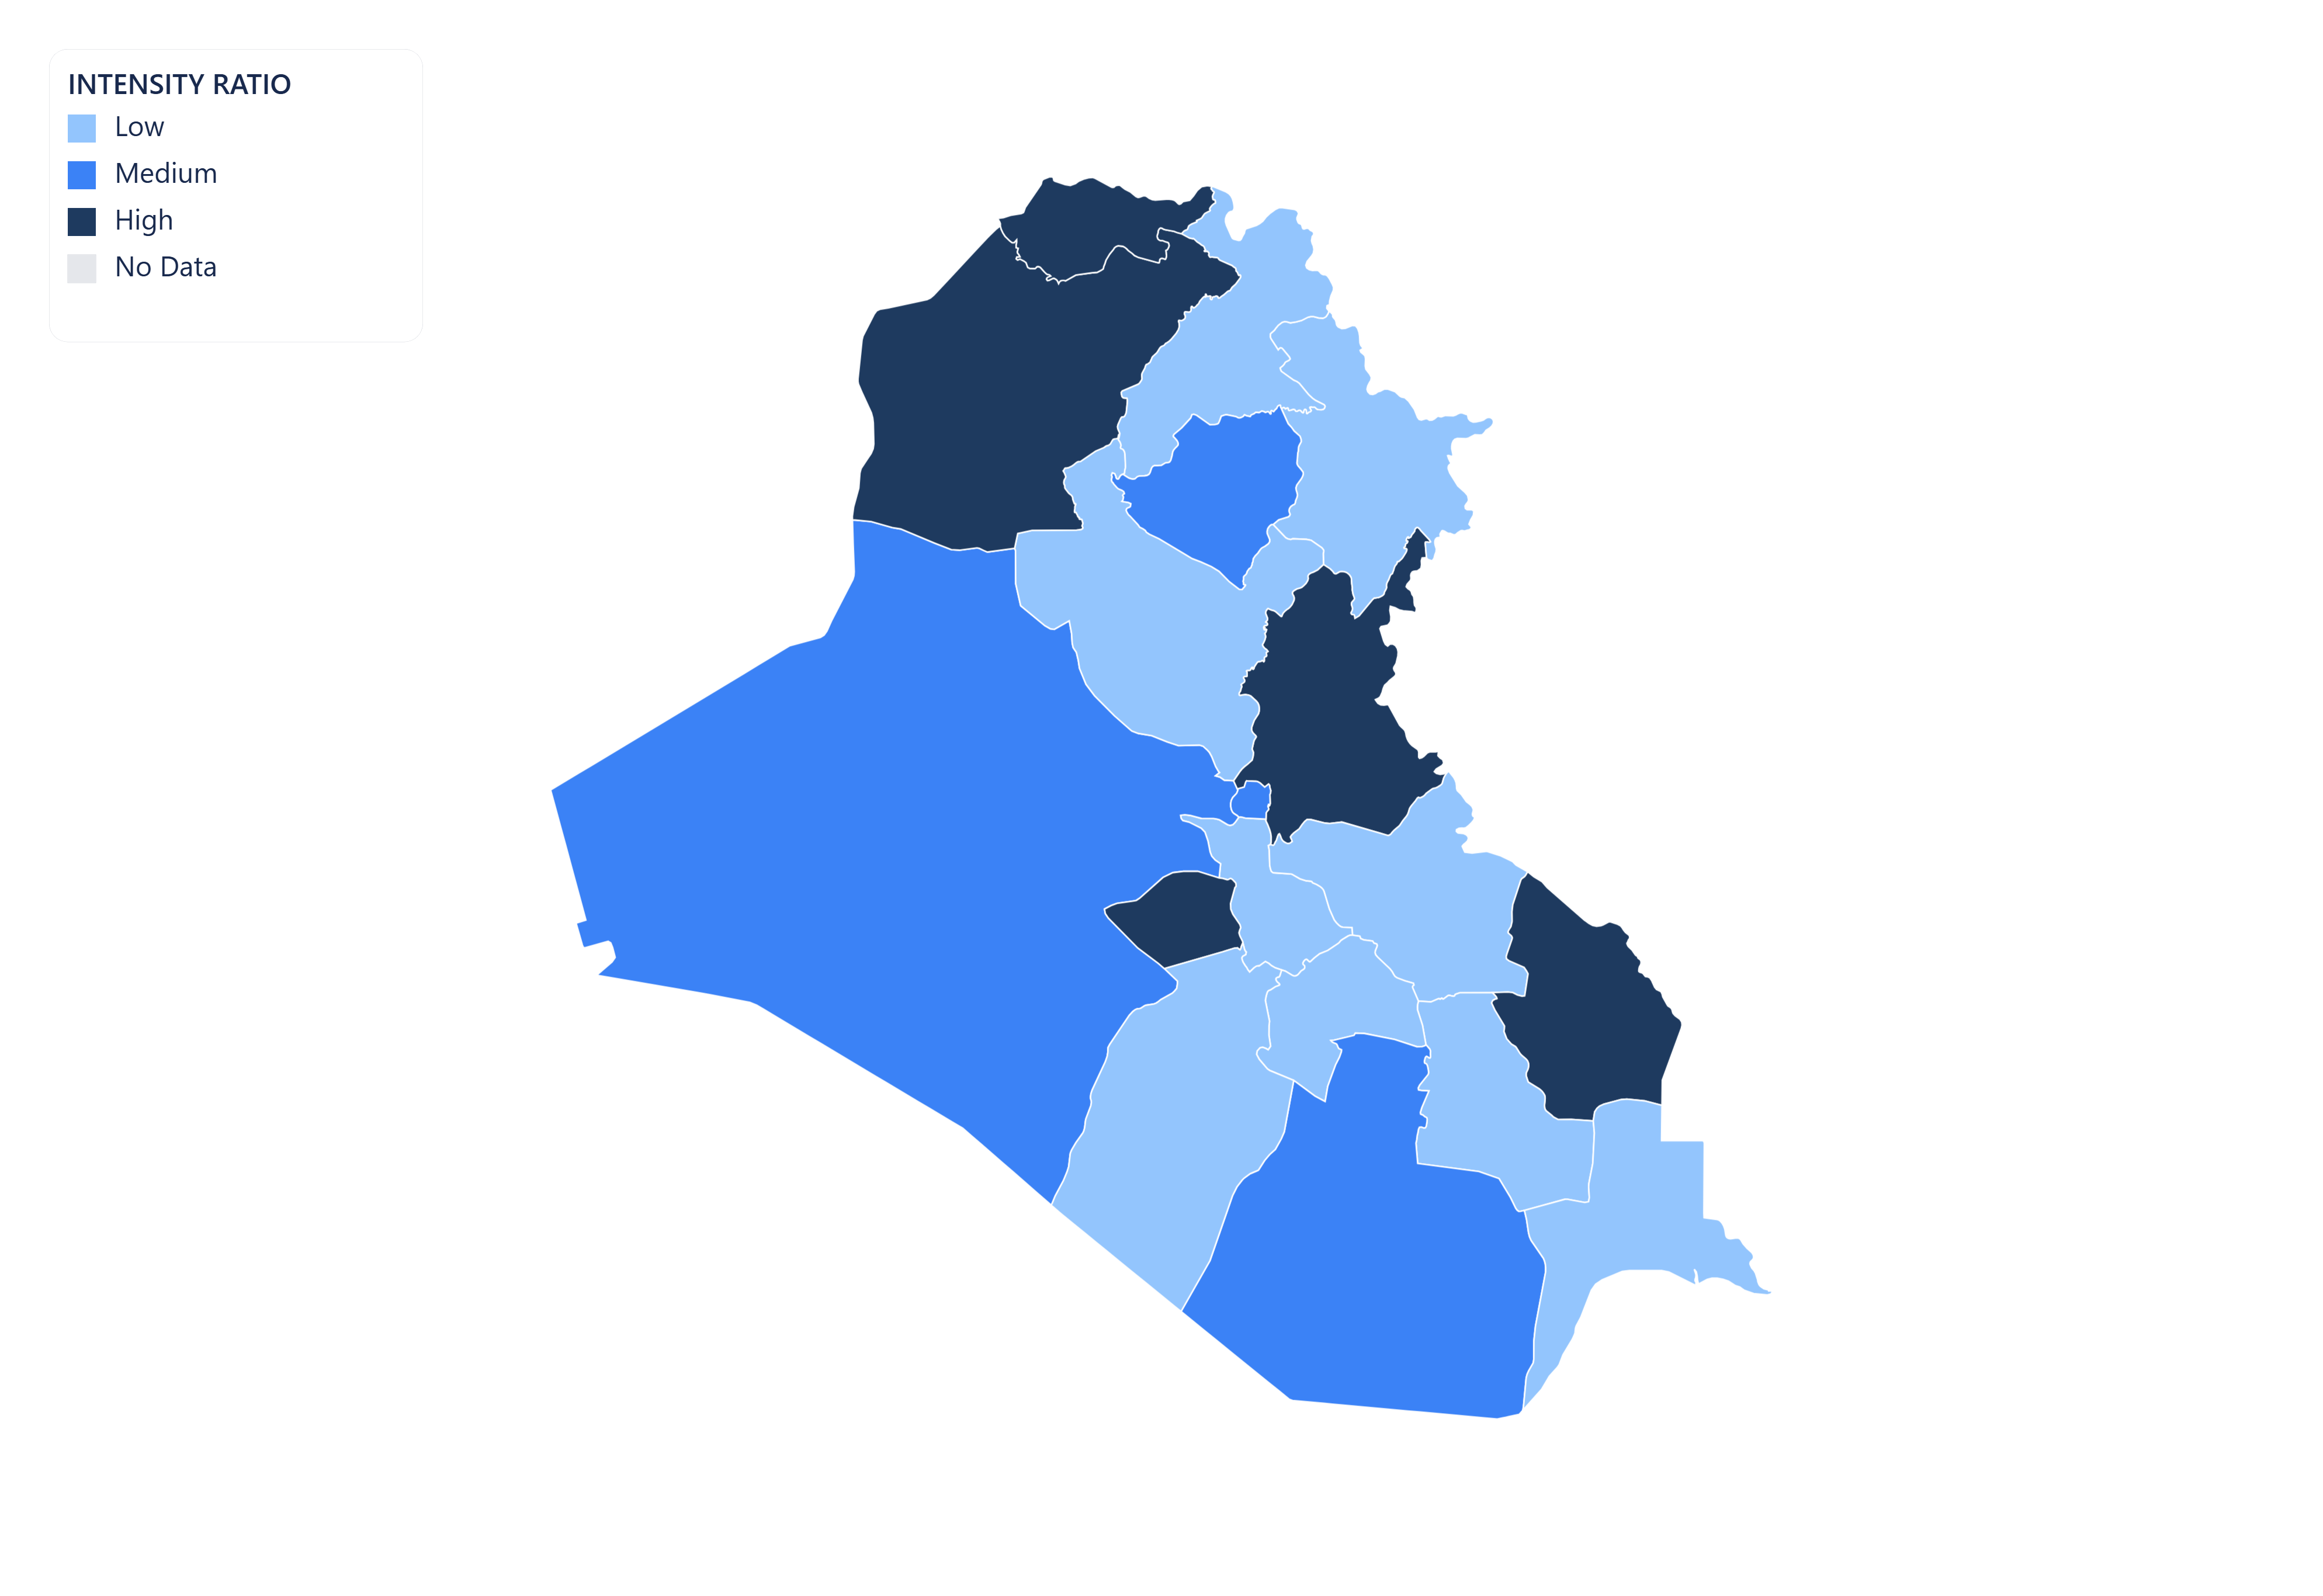
Choropleth Map of Iraq (العراق)
Regionify is a choropleth map tool that turns regional data into clear, publish-ready visualizations. Color administrative divisions by any numeric metric — GDP per capita, population density, election results, or your own dataset — then export as PNG, SVG, animated GIF, or an embeddable iframe. No GIS expertise required.
Create your map of IraqWhat you can create for Iraq with Regionify
From static maps to animated time-series — every format, ready to export.
Iraq choropleth map
Visualize Iraq's 18 governorates as a choropleth map. Color regions by any numeric dataset — population, GDP, unemployment, health outcomes, and more. Export as PNG, JPEG, or PDF.
Vector SVG export
Export your Iraq map as a scalable vector graphic (SVG). Ideal for print publications, editorial illustrations, and web use — scales to any resolution without quality loss.

Animated GIF
Bring your Iraq data to life. Import historical time-series data and export a looping animated GIF showing how regional values changed over time.
MP4 video export
Export your Iraq time-series map as an MP4 video. Perfect for presentations, reports, and social media posts where motion communicates change more clearly than static images.
Public share page
Share your Iraq choropleth map with a public link. Anyone with the URL can view the full interactive map — no account or login required.
Embeddable iframe
Embed your Iraq choropleth map anywhere with a single line of HTML. The iframe stays live — viewers always see the latest version of your map, no re-publishing needed.
AI-powered data import for Iraq maps
No spreadsheet? No problem. Regionify's AI Agent turns a plain-text description or raw pasted data into a ready-to-visualize dataset in seconds.
AI Generator
Generate Iraq data from a prompt
Describe the dataset you need in plain English — for example "GDP per capita of Iraq's 18 governorates in 2023" or "election results by governorates" — and the AI generates a plausible, structured dataset that maps directly onto Iraq's administrative boundaries. Edit any values in the table view before saving.
- ✓ Works for population, GDP, health, election, and custom metrics
- ✓ Supports time-series prompts for animated maps
- ✓ Output pre-matched to Iraq's 18 governorates
AI Parser
Clean and import messy Iraq data
Paste raw text, a copied Wikipedia table, or an unstructured CSV with regional figures for Iraq. The AI parser normalises region names, strips noise, resolves mismatched spelling across Iraq's governorates, and outputs a clean id–label–value table ready to visualise.
- ✓ Handles inconsistent or misspelled governorates names
- ✓ Auto-detects time columns for historical data
- ✓ Streams results in real time as AI processes
AI Agent is available on the Chronographer plan.
Governorates of Iraq
- Babil
- Al-Anbar
- Diyala
- As-Sulaymaniyah
- Wasit
- Maysan
- Dhi-Qar
- Al-Qadisiyah
- Al-Muthannia
- Al-Basrah
- Baghdad
- Karbala'
- An-Najaf
- Sala ad-Din
- Ninawa
- Arbil
- Kirkuk
- Dihok
Build your own Iraq choropleth map — free
Upload any dataset, color Iraq's governorates by any numeric metric, and export as PNG, SVG, GIF, or MP4. No design skills required — start in seconds, publish anywhere.