%20ammap.com%20%7C%20SVG%20map%20of%20Liechtenstein%20-%20High%20--%3E%0A%3Csvg%20xmlns%3D%22http%3A%2F%2Fwww.w3.org%2F2000%2Fsvg%22%20xmlns%3Aamcharts%3D%22http%3A%2F%2Famcharts.com%2Fammap%22%20xmlns%3Axlink%3D%22http%3A%2F%2Fwww.w3.org%2F1999%2Fxlink%22%20version%3D%221.1%22%20viewBox%3D%220%200%20820%201250%22%20width%3D%22100%25%22%20height%3D%22100%25%22%20preserveAspectRatio%3D%22xMidYMid%20slice%22%3E%0A%09%3Cdefs%3E%0A%09%09%0A%0A%09%09%3Camcharts%3Aammap%20projection%3D%22mercator%22%20leftLongitude%3D%229.472461%22%20topLatitude%3D%2247.271742%22%20rightLongitude%3D%229.637517%22%20bottomLatitude%3D%2247.047365%22%3E%3C%2Famcharts%3Aammap%3E%0A%0A%09%09%3C!--%20All%20areas%20are%20listed%20in%20the%20line%20below.%20You%20can%20use%20this%20list%20in%20your%20script.%20--%3E%0A%09%09%3C!--%7Bid%3A%22LI-01%22%7D%2C%7Bid%3A%22LI-02%22%7D%2C%7Bid%3A%22LI-03%22%7D%2C%7Bid%3A%22LI-04%22%7D%2C%7Bid%3A%22LI-05%22%7D%2C%7Bid%3A%22LI-06%22%7D%2C%7Bid%3A%22LI-07%22%7D%2C%7Bid%3A%22LI-08%22%7D%2C%7Bid%3A%22LI-09%22%7D%2C%7Bid%3A%22LI-10%22%7D%2C%7Bid%3A%22LI-11%22%7D--%3E%0A%0A%09%3C%2Fdefs%3E%0A%09%3Cg%3E%0A%09%09%3Cpath%20fill%3D%22white%22%20stroke%3D%22none%22%20id%3D%22LI-01%22%20title%3D%22Balzers%22%20%20d%3D%22M115.14%2C647.44l1.13%2C1.13l2.94%2C5.14l4.48%2C4.99l1.37%2C4.34l1.58%2C3.6l1.11%2C2.27l1.07%2C1.12l3.23%2C2.17l4.95%2C1.69l2.54%2C0.65l2.59%2C0.09l1.18%2C0.47l2.72%2C0.08l0.96%2C0.75l0.26%2C1.79l-0.37%2C6.56l-0.59%2C2.92l-1.5%2C4.16l-0.05%2C5.84l2.01%2C4.18l1.82%2C6.2l0.78%2C1.43l5.4%2C5.31l16.18%2C21.01l0%2C0l-1.58%2C-0.71l-1.8%2C-0.23l-3.54%2C0.73l-3.05%2C1.98l-4.97%2C2.12l-2.35%2C1.81l-6.48%2C3.48l-16.87%2C2.51l-3.7%2C0.83l-11.24%2C4.58l-4.38%2C3.97l-3.63%2C4.17l-3.26%2C1.98l-10.12%2C2.54l-14.15%2C0.86l-3.9%2C0.56l-3.12%2C1.41l-2.56%2C3.48l-1.55%2C0.98l-1.96%2C0.26l-2.99%2C-0.75l-1.76%2C-0.85l-3.06%2C-2.23l-3.01%2C-1.15l-2.33%2C-0.3l-2.31%2C0.5l-1.1%2C0.63l-1.63%2C1.71l-2.91%2C5.27l-2.48%2C5.66l-2.41%2C4.05l-1.48%2C1.57l-2.08%2C0.87l-2.22%2C0.05l-2.09%2C-0.71l-3.36%2C-3.41l-1.04%2C-1.8l-1.79%2C-6.34l-0.99%2C-1.96l-1.48%2C-1.64l-2.16%2C-0.89h-2.35l-3.41%2C0.83l-3.44%2C1.48l-3.07%2C-1.54l-2.46%2C-2.77L3.05%2C758.4l-2.77%2C-15.28L0%2C737.98l0.59%2C-5.01l2.48%2C-8l5.24%2C-3.94l5.05%2C-2.66l2.4%2C-1.72l5.22%2C-1.61l3.99%2C-2.24l4.43%2C-1.26l3.99%2C-2.31l4.41%2C-1.33l3.98%2C-2.34l4.41%2C-1.34l3.97%2C-2.35l5.09%2C-1.84l6.61%2C-5.61l10.04%2C-5.86l6.61%2C-5.63l5.75%2C-2.37l7.25%2C-6.1l9.4%2C-5.5l4.39%2C-3.86l3.83%2C-4.21l2%2C-4.8l2.52%2C-3.82L115.14%2C647.44zM235.25%2C639.71l9.36%2C3.07l2.23%2C-0.62l3.6%2C-2.04l2.2%2C0.08l2.53%2C1.04l0%2C0l-0.71%2C2.22l-1.88%2C3.22l-0.12%2C2.56l4.75%2C5.93l0.56%2C3.35l0.05%2C4.45l0.48%2C1.67l0.03%2C4.65l1.11%2C3.54l3.8%2C4.61l2.42%2C1.9l4.21%2C4.29l0.72%2C3.21l-2.83%2C2.5l-3.99%2C1.36l-3.54%2C2.37l-6.77%2C3.73l-5.08%2C1.21l-4.4%2C-0.01l-7.95%2C-1.73l-0.81%2C-0.59l-5.34%2C-5.44l-3.22%2C-3.85L223%2C680.19l-0.73%2C-2.33l1.07%2C-4.87l-0.01%2C-5.36l-0.92%2C-11.21l2.77%2C-6.04l2.7%2C-3.21L235.25%2C639.71zM369.73%2C440.89l-1.15%2C28.66l11.04%2C23.18l11.98%2C15.36l-20.92%2C31.1l-2.76%2C4.87l0%2C0l0.33%2C-3.22l-1.15%2C-0.22l-4.15%2C-3.04l-15.69%2C-7.17l-5.38%2C-1.33l-1.15%2C-0.63l-1.18%2C-4.49l-0.12%2C-3.07l-0.94%2C-2.91l-0.1%2C-5.22l-1.41%2C-3.15l-0.22%2C-2.4l-1.53%2C-2.13l0%2C0l-0.05%2C-1.75l-1.62%2C-5.88l-1.96%2C-3.4l-0.59%2C-3.66l0.01%2C-9.96l-1.14%2C-3.08l-4.83%2C-6.11l-3.5%2C-2.44l-4.78%2C-5.13l-5.52%2C-4.85l0%2C0l-3.13%2C-2.56l-3.04%2C-3.59l-6.64%2C-0.16l-2.74%2C-0.67l-6.34%2C-2.77l-4.06%2C-2.96l-6.55%2C-3.89l-4.15%2C-1.2l-5.42%2C-0.11l-1.29%2C-0.67l-1.16%2C-1.14l0%2C0l-0.29%2C-1.6l0.27%2C-1.64l1.6%2C-3.15l-0.5%2C-2.45l0.46%2C-1.21l0.1%2C-3.69l0.53%2C-1.72l-1.02%2C-2.67l0.44%2C-1.62l0.09%2C-2.79l1.98%2C-2.83l1.12%2C-2.58l0.21%2C-4.11l2.09%2C-5.05l0%2C0l1.46%2C-1.78l0.88%2C-1.84l1.86%2C-1.36l3.89%2C-3.96l1.03%2C-3.11l0.18%2C-2.81l0.59%2C-1.18l1.89%2C-1.91l1.1%2C-1.72l0.65%2C-2.44l0%2C0l4.73%2C3.72l16.43%2C15.02l10.48%2C22.81l21.32%2C12.9L369.73%2C440.89z%22%2F%3E%0A%09%09%3Cpath%20fill%3D%22white%22%20stroke%3D%22none%22%20id%3D%22LI-02%22%20title%3D%22Eschen%22%20%20d%3D%22M196%2C275.38l-2.4%2C-3.34l0.48%2C-2.05l0.05%2C-4.47l1.14%2C-2.09l2.17%2C-1.16l0.47%2C0.24l4.41%2C6.58l3.22%2C2.18l3.66%2C1.68l7.09%2C2.26l2.2%2C0.36l0%2C0l-0.82%2C9.51l-1.86%2C3.89l-6.11%2C-1.76l-3.57%2C1.28l0%2C0l-3.6%2C-7.2L196%2C275.38zM62.73%2C217.49l2.55%2C2.41l7.21%2C4.49l0.96%2C-0.17l3.14%2C-3.13l0.96%2C-0.39l1.56%2C1.31l1.09%2C2.21l-8.47%2C9.6l-5.92%2C8.65l-4.55%2C7.71l-3.56%2C4.15l-0.15%2C3.44l0.47%2C1.25l0.16%2C1.97l5.7%2C4.06l0.71%2C-0.09l2.8%2C-1.94l4.95%2C-0.03l0.72%2C-0.26l0.6%2C-1.31l0.6%2C-8.1l0.51%2C-1.43l0.05%2C-3.45l0.51%2C-1.44l0.03%2C-3.21l0.46%2C-0.71l0.8%2C-0.12l13.65%2C8.48l0.61%2C1.85l0.07%2C2.83l0.98%2C5.28l0.06%2C2.68l0.48%2C1.32l-0.05%2C2.04l0%2C0l-5.41%2C-0.03l-2.15%2C-0.54l-2.89%2C0.04l0%2C0l-1.2%2C0.57L58.36%2C288.23l-1.61%2C1.11l-0.88%2C-0.5l-6.05%2C-12.87l-4.39%2C-3.35l-4.33%2C-2.49l0%2C0l0.47%2C-7.79l2.79%2C-3.29l2.05%2C-5.34l2.14%2C-3.03l1.87%2C-4.91l2.14%2C-2.96l1.9%2C-4.91l2.05%2C-3.05l0.67%2C-1.78l1.32%2C-7l2.45%2C-3.87L62.73%2C217.49zM183.53%2C150.36l-7.46%2C5.02l-4.99%2C3.86l-2.17%2C2.18l-1.78%2C2.7l-2.95%2C-0.44l-0.95%2C-0.44l-2.2%2C-0.01l-1.91%2C0.65l-1.69%2C1.7l-6%2C9.36l0.83%2C1.54l4.21%2C4.29l0.25%2C1.08l-8.88%2C5.77l-2.21%2C3.1L143.88%2C196l-0.13%2C2.39l-0.51%2C1.55l0.11%2C1.4l1.58%2C2.75l14.56%2C12.66l19.18%2C14.26l0.86%2C-0.28l5.2%2C-5.93l2.36%2C-0.12l1.49%2C0.43l0.67%2C-0.48l1.39%2C-5.66l0.6%2C-1.17l0.75%2C-0.48l17.72%2C-4.38l4.82%2C0.07l2.77%2C3.34l3.19%2C6.32l3.32%2C11.01l-0.97%2C0.85l-6.83%2C2.37l-6.47%2C3.18l-0.33%2C0.94l0.86%2C1.36l4.45%2C4.46l2.43%2C1.73l3.25%2C1.19l4.19%2C0.81l8.76%2C5.77l6.41%2C1.77l1.24%2C-0.05l2.79%2C-1.02l3.8%2C0.7l4.73%2C3.6l5.87%2C5.89l0.98%2C0.66l1.11%2C-0.65l0%2C0l-2.63%2C3.42l-12.83%2C20.02l0%2C0l-9.98%2C-5.96l-7.92%2C2.53l-1.3%2C-0.08l-0.59%2C-0.66l-2.11%2C-4.92l-1.4%2C-6.04l0%2C0l-0.9%2C-10.81l-1.65%2C-3.91l-3.75%2C-6.23l-0.69%2C-0.43l-12.3%2C-2.94l-0.43%2C-2.47l-3.75%2C-3.8l-7.76%2C-4.85l-1.53%2C0.89l-2.61%2C2.31l-1.15%2C1.55l2.61%2C5.66l4.99%2C1.35l0.56%2C0.43l0.06%2C4.68l-1.69%2C0.73l-4.07%2C0.71l-4.12%2C1.58l-9.98%2C6.78l-1.74%2C0.11l-1.54%2C-0.55l-1.78%2C0.08l-0.76%2C1.35l-0.1%2C3.49l-0.71%2C2.87l0%2C0l-3.76%2C1.28l-2.37%2C0.09l-6.9%2C-1.63l-2.96%2C-0.23l0%2C0l-0.86%2C-0.75l0%2C0l-1.31%2C-5.04l-0.68%2C-1.02l-43.61%2C-17.37l-13.9%2C-40.85l-0.67%2C-4.49l0.32%2C-0.59l0.98%2C-0.13l4.9%2C1.16l4.95%2C-0.15l0.68%2C-1.93l0.15%2C-3.02l0.69%2C-0.31l2.45%2C0.04l0.53%2C-0.52l0.04%2C-8.67l-0.51%2C-1.75l-0.02%2C-3.38l0.53%2C-2.04l0.19%2C-3.01l3.54%2C-2.12l3.6%2C-0.81l2.26%2C-1.63l3.26%2C-3.25l2.65%2C-3.95l2.49%2C-2.22l8.09%2C-0.16l4.21%2C-3.59l3.62%2C-0.09l1.61%2C0.84l0.74%2C2.17l1.61%2C2.87l2.08%2C1.11l1.41%2C0.05l1.67%2C-1.16l0.81%2C-1.86l1.14%2C-1.44l1.24%2C-0.81l2.17%2C-0.2l2.99%2C-3.48l6.05%2C-0.21l2.78%2C-3.57l0%2C0l0.33%2C-1.02l2.69%2C-3.25l4.07%2C-3.49l3.02%2C-3.6l3.47%2C-2.05h0.53l0.61%2C0.61l2.02%2C3.53l0.8%2C2.54L183.53%2C150.36z%22%2F%3E%0A%09%09%3Cpath%20fill%3D%22white%22%20stroke%3D%22none%22%20id%3D%22LI-03%22%20title%3D%22Gamprin%22%20%20d%3D%22M166.46%2C274.11l0.71%2C-2.87l0.1%2C-3.49l0.76%2C-1.35l1.78%2C-0.08l1.54%2C0.55l1.74%2C-0.11l9.98%2C-6.78l4.12%2C-1.58l4.07%2C-0.71l1.69%2C-0.73l-0.06%2C-4.68l-0.56%2C-0.43l-4.99%2C-1.35l-2.61%2C-5.66l1.15%2C-1.55l2.61%2C-2.31l1.53%2C-0.89l7.76%2C4.85l3.75%2C3.8l0.43%2C2.47l12.3%2C2.94l0.69%2C0.43l3.75%2C6.23l1.65%2C3.91l0.9%2C10.81l0%2C0l-2.77%2C0.04l0%2C0l-2.2%2C-0.36l-7.09%2C-2.26l-3.66%2C-1.68l-3.22%2C-2.18l-4.4%2C-6.58l-0.47%2C-0.24l-2.17%2C1.16l-1.14%2C2.09l-0.05%2C4.47l-0.48%2C2.05l2.4%2C3.34l0%2C0l-3.75%2C2.57l0%2C0l-0.93%2C-1.55l-2.22%2C-1.7l-6.4%2C-3.96l-6.71%2C0.03l-6.37%2C2.48L166.46%2C274.11zM101.13%2C127.45l0.49%2C0.31l-0.1%2C0.54l3.83%2C2.41l2.51%2C1.08l3.76%2C-2.16l3.53%2C-2.98l3.22%2C-2.14l0.82%2C0.01l3.74%2C3.83l1.67%2C2.25l0.3%2C0.92l-0.26%2C2.12l0.22%2C1.04l1.66%2C1.05l3.8%2C1.29l1.7%2C1.71l1.17%2C4.15l0.06%2C4.41l0.63%2C0.94l2.4%2C2.24l6.92%2C0.07l0%2C0l-0.8%2C1.44l0%2C3.13l0.63%2C0.76l2.18%2C1.16l2.01%2C0.05l5.77%2C-1.58l1.35%2C0.09l2.94%2C1.04h3.24l1.6%2C-0.51l3.18%2C0.12l0%2C0l-2.78%2C3.57l-6.05%2C0.22l-2.99%2C3.48l-2.17%2C0.2l-1.24%2C0.81l-1.14%2C1.44l-0.81%2C1.86l-1.67%2C1.16l-1.41%2C-0.05l-2.08%2C-1.1l-1.6%2C-2.87l-0.74%2C-2.17l-1.6%2C-0.84l-3.62%2C0.09l-4.2%2C3.59l-8.09%2C0.16l-2.49%2C2.23l-2.65%2C3.95l-3.26%2C3.25l-2.26%2C1.63l-3.6%2C0.81l-3.54%2C2.12l-0.19%2C3.01l-0.53%2C2.04l0.03%2C3.38l0.51%2C1.75l-0.04%2C8.67l-0.53%2C0.53l-2.45%2C-0.04l-0.69%2C0.31l-0.15%2C3.02l-0.68%2C1.93l-4.95%2C0.15l-4.9%2C-1.16l-0.98%2C0.14l-0.32%2C0.59l0.67%2C4.49l13.9%2C40.85l43.61%2C17.37l0.68%2C1.02l1.31%2C5.04l0%2C0l-3.8%2C-0.24l-1.18%2C-0.47l-2.58%2C-0.09l-1.18%2C-0.47l-2.72%2C-0.12l-1.19%2C-0.47l-2.96%2C-0.07l-1.74%2C-0.53l0%2C0l-2.02%2C-0.04l-1.21%2C-0.47l-2.53%2C-0.09l-1.23%2C-0.47l-2.87%2C-0.12l-2.08%2C-0.5l-8.54%2C0.03l0%2C0l-3.3%2C-0.65l-9.07%2C-0.07l-2.75%2C-0.55l-4.24%2C-0.04l0%2C0l0.05%2C-2.03l-0.48%2C-1.32l-0.06%2C-2.68l-0.98%2C-5.28l-0.07%2C-2.83l-0.61%2C-1.85L76.59%2C242.95l-0.8%2C0.12l-0.45%2C0.71l-0.03%2C3.21l-0.5%2C1.44l-0.05%2C3.45l-0.5%2C1.43l-0.6%2C8.1l-0.6%2C1.31l-0.72%2C0.26l-4.95%2C0.03l-2.8%2C1.94l-0.71%2C0.09l-5.7%2C-4.06l-0.16%2C-1.97l-0.47%2C-1.25l0.15%2C-3.44l3.56%2C-4.15l4.55%2C-7.71l5.93%2C-8.65l8.47%2C-9.6l-1.09%2C-2.21l-1.56%2C-1.31l-0.96%2C0.39l-3.13%2C3.13l-0.96%2C0.18l-7.21%2C-4.49l-2.55%2C-2.41l0%2C0l1.74%2C-2.45l0.91%2C-2.78l0.94%2C-6.55l2.57%2C-6.97l1.28%2C-9.06l2.54%2C-6.97l1.07%2C-7.94l0.95%2C-3.18l3.87%2C-7.98l3.35%2C-5.57l2.75%2C-3.6l2.05%2C-4.79l6.09%2C-7.01l1.55%2C-4.11l2.49%2C-3.78l1.99%2C-4.86L101.13%2C127.45z%22%2F%3E%0A%09%09%3Cpath%20fill%3D%22white%22%20stroke%3D%22none%22%20id%3D%22LI-04%22%20title%3D%22Mauren%22%20%20d%3D%22M183.53%2C150.36L185.75%2C150.25L186.86%2C149.65L190.37%2C143.98L194.78%2C140.14L205.37%2C134.81L208.84%2C134.7L209.45%2C133.91L209.07%2C132.78L209.45%2C132.21L211.72%2C131.95L213.62%2C133.48L217.36%2C135.1L217.36%2C135.1L211.99%2C141.27L200.53%2C160.69L211.41%2C171.6L230.02%2C180.81L247.76%2C193.26L259.75%2C210.67L276%2C237.02L271.06%2C252.9L260.03%2C267.21L260.03%2C267.21L258.93%2C267.86L257.95%2C267.2L252.08%2C261.31L247.35%2C257.71L243.55%2C257.01L240.76%2C258.03L239.52%2C258.08L233.11%2C256.32L224.35%2C250.55L220.16%2C249.74L216.91%2C248.56L214.48%2C246.83L210.03%2C242.37L209.17%2C241.01L209.5%2C240.07L215.97%2C236.89L222.8%2C234.51L223.78%2C233.66L220.46%2C222.65L217.27%2C216.33L214.49%2C212.99L209.67%2C212.92L191.96%2C217.3L191.21%2C217.79L190.61%2C218.96L189.23%2C224.62L188.56%2C225.1L187.07%2C224.67L184.71%2C224.79L179.52%2C230.73L178.65%2C231.01L159.48%2C216.75L144.92%2C204.09L143.34%2C201.34L143.23%2C199.94L143.75%2C198.39L143.88%2C196L145.62%2C190.69L147.83%2C187.59L156.71%2C181.82L156.47%2C180.74L152.26%2C176.45L151.43%2C174.92L157.43%2C165.56L159.12%2C163.86L161.03%2C163.21L163.23%2C163.23L164.18%2C163.67L167.13%2C164.11L168.91%2C161.42L171.08%2C159.23L176.06%2C155.38z%22%2F%3E%0A%09%09%3Cpath%20fill%3D%22white%22%20stroke%3D%22none%22%20id%3D%22LI-05%22%20title%3D%22Planken%22%20%20d%3D%22M152.13%2C305.06l-0.6%2C-0.05l-2.57%2C-2.12l-1.55%2C-2.38l-0.13%2C-1.64l1.26%2C-2.34l1.15%2C0.11l5.54%2C3.05l0.48%2C3.91l-0.5%2C0.5L152.13%2C305.06zM221.27%2C275.54l1.4%2C6.04l2.11%2C4.92l0.59%2C0.66l1.3%2C0.08l7.92%2C-2.53l9.98%2C5.96l0%2C0l1%2C21.19l5.32%2C27.33l5.98%2C15.28l15.67%2C13.79l14.74%2C11.6l0%2C0l-0.64%2C2.44l-1.1%2C1.72l-1.88%2C1.91l-0.58%2C1.19l-0.18%2C2.82l-1.03%2C3.11l-3.89%2C3.96l-1.86%2C1.36l-0.88%2C1.85l-1.46%2C1.78l0%2C0l-1.43%2C-0.09l-7.36%2C-2.19l-7.16%2C-3.93l-8.06%2C-6.54l-14.76%2C-12.83l-6.45%2C-4.89l-12.86%2C-6.48l0%2C0l5.87%2C-8.11l4.23%2C-3.39l1.53%2C-3.39l2.84%2C-4.35l-19.45%2C-12.11l-6.23%2C-4.69l-10.2%2C-0.63l-0.87%2C0.71l-1.83%2C3.62l-1.3%2C0.5l-14.28%2C-3.44l-1.07%2C-0.51l-0.39%2C-0.66l0.02%2C-6.1l-0.5%2C-1.99l-0.1%2C-5.62l-2.19%2C-4.45l-3.37%2C-4.19l-4.93%2C-3.39l3.5%2C-7.18l2.45%2C-6.31l2.19%2C-3.85l0.91%2C-0.07l4.26%2C1.63l3.7%2C-2.35l3.44%2C-2.98l8.37%2C-1.24l2.3%2C-1.24l0%2C0l1.8%2C1.74l5.09%2C3.02L203%2C285.98l1.25%2C3.33l1.89%2C-0.81l0%2C0l3.57%2C-1.28l6.11%2C1.77l1.86%2C-3.89l0.82%2C-9.51l0%2C0L221.27%2C275.54zM186.98%2C319.56l0.75%2C0.36l0.3%2C3.03l0.76%2C0.46l1.91%2C-0.07l1.32%2C-0.48l3.79%2C-0.08l1.26%2C-0.67l0.63%2C-1.44l-0.21%2C-0.98l-3.46%2C-4.23l-5.63%2C-0.28l-2.56%2C-3.08l-3.85%2C-0.11l-0.44%2C0.77l0.09%2C4.43l0.92%2C1.13l2.02%2C1.2L186.98%2C319.56zM132.25%2C270.4l1.74%2C0.53l2.97%2C0.07l1.19%2C0.47l2.72%2C0.12l1.19%2C0.47l2.58%2C0.09l1.18%2C0.47l3.8%2C0.24l0%2C0l0.86%2C0.75l0%2C0l10.22%2C10.83l-0.07%2C1.62l-2.22%2C3.88l-1.09%2C1.24l-1.33%2C-0.69l-12.28%2C-11.64l-9.38%2C-4.27l-1.85%2C-2.94L132.25%2C270.4z%22%2F%3E%0A%09%09%3Cpath%20fill%3D%22white%22%20stroke%3D%22none%22%20id%3D%22LI-06%22%20title%3D%22Ruggell%22%20%20d%3D%22M140%2C10.14L142.02%2C6.75L147.47%2C0L154.8%2C8.81L166.12%2C20.55L180.33%2C39.2L200.4%2C56.94L205.37%2C63.36L205.37%2C63.36L203.74%2C62.43L197.9%2C69.38L192.52%2C74.8L181.71%2C85.03L172.79%2C92.29L166.63%2C98.77L165.01%2C101.07L165.23%2C101.77L172.76%2C109.4L177.76%2C112.83L179.04%2C113.25L188.08%2C107.33L200.77%2C95.2L206.25%2C90.79L207.62%2C90.3L207.6%2C91.68L205.9%2C95.39L200.42%2C105.75L193.43%2C112.79L187.23%2C117.35L182.57%2C123.09L175.94%2C126.53L168.08%2C131.6L161.99%2C135.04L157.74%2C139.18L154.84%2C139.25L152.33%2C138.68L149.74%2C138.97L143.19%2C150.55L143.19%2C150.55L136.28%2C150.48L133.87%2C148.24L133.25%2C147.3L133.19%2C142.89L132.02%2C138.74L130.32%2C137.02L126.52%2C135.73L124.87%2C134.68L124.65%2C133.64L124.9%2C131.52L124.61%2C130.6L122.94%2C128.35L119.2%2C124.52L118.37%2C124.51L115.16%2C126.65L111.62%2C129.63L107.86%2C131.79L105.35%2C130.71L101.52%2C128.3L101.62%2C127.76L101.13%2C127.45L101.13%2C127.45L104.97%2C122.85L106.52%2C118.75L109.02%2C114.99L110.56%2C110.83L113.3%2C107.19L116.49%2C101.54L118.65%2C94.98L121%2C90.95L122.63%2C83.13L124.99%2C79.09L126.69%2C73.44L128.83%2C68.79L130.54%2C63.15L132.99%2C59.2L134.7%2C53.58L137.15%2C47.89L138.72%2C41.72L141.04%2C35.85L141.42%2C33.61L141.56%2C21.83L141.2%2C17.08z%22%2F%3E%0A%09%09%3Cpath%20fill%3D%22white%22%20stroke%3D%22none%22%20id%3D%22LI-07%22%20title%3D%22Schaan%22%20%20d%3D%22M281.41%2C633.8l6.01%2C0.18l1.5%2C0.58l6.1%2C4.1l11.43%2C3.89l6.41%2C1.29l3.34%2C1.03l1.69%2C-0.07l1.98%2C-0.77l0%2C0l1.34%2C3.22l0.59%2C2.62l0.08%2C2.77l1.63%2C3.94l3.38%2C4.22l2.82%2C2.69l2.16%2C3.38l0.76%2C2.41l1.67%2C3.39l1.33%2C1.79l1.27%2C3.31l1.12%2C0.79l0%2C0l-3%2C20.06l-9.42%2C40.52l2%2C2.31l-1.65%2C-0.01l-2.26%2C0.98l0%2C0l-5.16%2C-3.47l-3.1%2C-4.74l-3.42%2C-2.38l-3.77%2C-3.29l-3.24%2C-4.44l-4.15%2C-8.74l-6.4%2C-5.06l0.33%2C-0.74l5.95%2C-5.83l0.4%2C-0.93l-7.28%2C-13.96l-5.54%2C-18.14l-5.67%2C-15.06l-1.02%2C-4.36l3.01%2C-8.47l-2.96%2C-7.07L281.41%2C633.8zM266.71%2C439.09l1.16%2C1.15l1.3%2C0.67l5.42%2C0.11l4.15%2C1.2l6.55%2C3.89l4.06%2C2.96l6.34%2C2.77l2.74%2C0.67l6.64%2C0.16l3.04%2C3.6l3.13%2C2.56l0%2C0l-1.18%2C2.22l-7.63%2C10.86l-4.51%2C4.74l-1.01%2C0.69l-6.92%2C2.14l-7.11%2C0.67l-1.23%2C0.69l-0.02%2C1.14l4.64%2C7.03l1.32%2C3.92l5.46%2C4.98l8.13%2C0.15l2.31%2C0.53l3.83%2C0.07l3.7%2C-1.06l2.78%2C0.05l3.02%2C0.71l3.78%2C5.72l2.32%2C0.14l6.15%2C1.6h4.09l2.08%2C-0.71l0%2C0l1.53%2C2.13l0.22%2C2.4l1.41%2C3.15l0.1%2C5.22l0.94%2C2.91l0.12%2C3.07l1.18%2C4.5l1.15%2C0.63l5.39%2C1.33l15.69%2C7.17l4.15%2C3.04l1.15%2C0.22l-0.33%2C3.22l0%2C0l-7.9%2C13.89l3.87%2C3.81l0%2C0l-2.43%2C2.97l-1.77%2C3.26l-4.49%2C-0.93l-16.76%2C-5.33l-2.2%2C0.44l-7%2C-0.03l-2.06%2C0.5l-2.07%2C-0.52l-5%2C-0.08l-4.55%2C-1.05l-4.05%2C-0.04l-1.94%2C0.78l-2.84%2C2.72l-3.26%2C2.17l-2.1%2C0.7l-2.66%2C0.14l-2.41%2C1.53l0%2C0l-0.92%2C-0.19l-3.1%2C-1.92l-4.2%2C-1.28l-2.9%2C-1.52l-5.98%2C-0.12l-3.29%2C-1.04l-2.72%2C-0.07l0%2C0l0.53%2C-2.81l0.08%2C-4.43l0.48%2C-1.91l0.05%2C-6.11l0.52%2C-1.63l0.08%2C-3.7l3.63%2C-9.2l2.77%2C-8.98l0.11%2C-3.31l0.52%2C-1.74l-0.19%2C-5.09l-0.71%2C-0.81l-8.58%2C-1.28l-6.46%2C-2.6l-5.7%2C-0.73l-3.44%2C-1.18l-6.01%2C-4.7l-2.59%2C-2.93l-2.5%2C-3.58l-9.82%2C-6.22l-0.59%2C-0.66l-0.62%2C-1.74l0.17%2C-2.77l2.45%2C-3.62l1.39%2C-3.7l3.08%2C-4.44l1.13%2C-0.08l2.45%2C2.06l1.09%2C-0.16l1.69%2C-2.38l-0.03%2C-4.24l0.34%2C-1.01l3.95%2C-3.72l3.57%2C-4.63l2.38%2C-1.8l4.83%2C-4.87l2.78%2C-6.18l0.6%2C-2.42L266.71%2C439.09zM188.8%2C315.25h4.38l1.2%2C0.47l3.23%2C4.16l0.04%2C1.2l-0.57%2C1.02l-1.66%2C0.75l-3.67%2C0.03l-1.9%2C0.53l-1.55%2C-0.15l-0.3%2C-0.58l-0.03%2C-2.37l-0.42%2C-0.58l-3.25%2C-0.31l-2.54%2C-1.98l-0.12%2C-5.11l0.63%2C-0.42l3.6%2C0.16l0.96%2C0.86l1.37%2C2.1L188.8%2C315.25zM81.94%2C266.9l1.27%2C1.82l4.51%2C15.88l0.53%2C1.09l6.65%2C8.49l3.45%2C10.46l0.61%2C1.16l0.79%2C0.22h6.47l2.51%2C-0.51l6.63%2C0.03l3.33%2C-0.5l0.51%2C-0.4l-7.42%2C-35.88l0%2C0l8.54%2C-0.03l2.09%2C0.5l2.88%2C0.12l1.23%2C0.47l2.53%2C0.1l1.21%2C0.47l2.02%2C0.04l0%2C0l0.21%2C1.25l1.85%2C2.94l9.38%2C4.27l12.28%2C11.64l1.33%2C0.69l1.1%2C-1.24l2.22%2C-3.88l0.07%2C-1.62l-10.22%2C-10.83l0%2C0l2.96%2C0.23l6.9%2C1.63l2.38%2C-0.09l3.76%2C-1.28l0%2C0l3.17%2C-0.86l6.37%2C-2.48l6.71%2C-0.03l6.4%2C3.96l2.23%2C1.7l0.93%2C1.55l0%2C0l2.32%2C1.28l0%2C0l-2.3%2C1.24l-8.37%2C1.24l-3.44%2C2.98l-3.69%2C2.35l-4.26%2C-1.63l-0.91%2C0.07l-2.19%2C3.85l-2.45%2C6.31l-3.5%2C7.18l4.93%2C3.4l3.37%2C4.19l2.19%2C4.45l0.1%2C5.62l0.5%2C1.99l-0.02%2C6.1l0.39%2C0.66l1.07%2C0.51l14.28%2C3.44l1.3%2C-0.5l1.84%2C-3.62l0.87%2C-0.71l10.2%2C0.63l6.23%2C4.69l19.45%2C12.11l-2.84%2C4.35l-1.53%2C3.39l-4.23%2C3.4l-5.87%2C8.11l0%2C0l-1.42%2C1.58l-3.44%2C5.58l-5.66%2C6.75l-0.5%2C1.48l0%2C0l-9.86%2C-4.9l-3.06%2C-0.09l-1.4%2C-0.48l-3.46%2C-0.08l-3.08%2C-0.55l-8.84%2C0.5l-7.27%2C-0.04l-6.92%2C1.01l-5.06%2C-0.04l-15.06%2C-4.86l-8.21%2C-1.28l-1.2%2C-0.47l-2.57%2C-0.01l-0.5%2C0.36l-3.99%2C8.08l-2.09%2C0.67l-3.32%2C0.01l-0.84%2C0.73l0.48%2C3.31l0.01%2C6.3l0.5%2C2.36l-0.2%2C3.91l-7.51%2C1.85l-7.08%2C3.03l-0.91%2C0.07l-9.96%2C-5.63l-1.62%2C-1.05l-1.11%2C-1.24l-4.3%2C-20.44l-0.01%2C-3.57l1.03%2C-2.48l-0.01%2C-1.28l-1.4%2C-0.65l-1.9%2C-0.16l-11.68%2C-2.65l-2.15%2C-0.12l-1.07%2C-0.44l-8.85%2C-0.01l-0.3%2C0.46l0%2C1.48l2.07%2C9.36l0.11%2C2.33l0.64%2C1.85l25.96%2C22.68l0%2C0.84l-1.91%2C2.41l-0.2%2C0.89l0.67%2C0.96l3.06%2C2.64l2.28%2C12.39l3.23%2C9.35l1.63%2C2.84l9.54%2C11.94l-0.12%2C0.66l-1.77%2C1.02l-5.19%2C2.14l-1.78%2C0.07l-2.07%2C-6.88L93%2C435.79l-6.08%2C-8.87l-5.75%2C-7.23l-1.32%2C-0.57l-6.14%2C-0.01l-3.23%2C0.51l3.46%2C6.14l13.95%2C20.43l5.61%2C22.28l0%2C0l-3.01%2C-6.04l-4.1%2C-6.31l-7.87%2C-7.51l-2.24%2C-2.54l-2.05%2C-5.22l-3.06%2C-4.52l-2.04%2C-5.79l-2.3%2C-4.82l-1.97%2C-5.78l-2.2%2C-3.34l-2.15%2C-5.04l-2.66%2C-3.98l-1.74%2C-4.23l-2.67%2C-3.99l-1.73%2C-4.24l-2.97%2C-5l-4.17%2C-13.74l-1.81%2C-10.36l-2.79%2C-7.21l-1.52%2C-9.2L35.02%2C334.47l-1.5%2C-16.73l0.7%2C-10.33l0.54%2C-3.35l2.6%2C-9.77l0.82%2C-11.96l2.92%2C-12.19l0%2C0l4.33%2C2.49l4.39%2C3.36l6.05%2C12.87l0.88%2C0.5l1.61%2C-1.1l22.37%2C-20.77L81.94%2C266.9zM126.72%2C326.79l1.41%2C0.67l3.56%2C7.38l1.1%2C1.06l4.59%2C2.17l1.04%2C-0.63l4.31%2C-6.57l-0.07%2C-0.63l-0.53%2C-0.57l-6.98%2C-5.44l-9.43%2C-4.54l-1.08%2C0.28l-1.67%2C4.96l-0.15%2C1.35l0.71%2C0.49L126.72%2C326.79zM148.25%2C296.83l-1.06%2C2.68l0.21%2C1l1.56%2C2.38l2.75%2C2.2l3.69%2C-1.13l0.37%2C-1.13l-0.68%2C-3.37l-5.96%2C-2.98L148.25%2C296.83z%22%2F%3E%0A%09%09%3Cpath%20fill%3D%22white%22%20stroke%3D%22none%22%20id%3D%22LI-08%22%20title%3D%22Schellenberg%22%20%20d%3D%22M217.36%2C135.1L213.62%2C133.48L211.72%2C131.95L209.45%2C132.21L209.07%2C132.78L209.45%2C133.91L208.84%2C134.7L205.37%2C134.81L194.78%2C140.14L190.37%2C143.98L186.86%2C149.65L185.75%2C150.25L183.53%2C150.36L183.53%2C150.36L182.8%2C149.51L182%2C146.98L179.98%2C143.44L179.37%2C142.84L178.85%2C142.84L175.38%2C144.89L172.36%2C148.49L168.29%2C151.98L165.61%2C155.23L165.28%2C156.25L165.28%2C156.25L162.1%2C156.13L160.5%2C156.64L157.26%2C156.64L154.32%2C155.61L152.97%2C155.51L147.21%2C157.09L145.2%2C157.04L143.02%2C155.88L142.39%2C155.12L142.39%2C151.99L143.19%2C150.55L143.19%2C150.55L149.74%2C138.97L152.33%2C138.68L154.84%2C139.25L157.74%2C139.18L161.99%2C135.04L168.08%2C131.6L175.94%2C126.53L182.57%2C123.09L187.23%2C117.35L193.43%2C112.79L200.42%2C105.75L205.9%2C95.39L207.6%2C91.68L207.62%2C90.3L206.25%2C90.79L200.77%2C95.2L188.08%2C107.33L179.04%2C113.25L177.76%2C112.83L172.76%2C109.4L165.23%2C101.77L165.01%2C101.07L166.63%2C98.77L172.79%2C92.29L181.71%2C85.03L192.52%2C74.8L197.9%2C69.38L203.74%2C62.43L205.37%2C63.36L205.37%2C63.36L216.78%2C78.07L236.63%2C107.56L225.16%2C126.15z%22%2F%3E%0A%09%09%3Cpath%20fill%3D%22white%22%20stroke%3D%22none%22%20id%3D%22LI-09%22%20title%3D%22Triesen%22%20%20d%3D%22M146.09%2C511.04L150.62%2C517.68L150.88%2C524.23L155.96%2C531.25L155.96%2C532.07L154.48%2C535.37L154.56%2C536.48L157.71%2C540.75L158.65%2C541.37L162.21%2C542.57L163.92%2C542.1L166.5%2C542.22L168.83%2C549.55L168.87%2C558.55L168.36%2C560.46L168.26%2C562.92L166.04%2C573.88L163.41%2C580.05L163.55%2C580.94L166.73%2C586.39L167.87%2C587.54L170.25%2C587.64L172.09%2C587.11L174.72%2C587.06L175.85%2C586.6L178.37%2C586.58L183.58%2C585.6L184.67%2C585.86L195.32%2C594.04L196.08%2C596.09L196.75%2C600.43L197.54%2C602.71L210.73%2C616.99L216.43%2C621.35L217.66%2C621.35L227.11%2C615.79L228.23%2C615.74L234.73%2C623.6L234.73%2C637.33L235.25%2C639.71L235.25%2C639.71L227.87%2C647.16L225.17%2C650.37L222.4%2C656.41L223.32%2C667.63L223.33%2C672.99L222.27%2C677.86L223%2C680.19L226.62%2C686.35L229.84%2C690.19L235.18%2C695.64L235.99%2C696.23L243.94%2C697.96L248.35%2C697.98L253.43%2C696.77L260.2%2C693.04L263.75%2C690.68L267.74%2C689.32L270.57%2C686.82L269.85%2C683.6L265.64%2C679.31L263.22%2C677.42L259.42%2C672.81L258.31%2C669.27L258.29%2C664.62L257.81%2C662.95L257.77%2C658.5L257.2%2C655.15L252.45%2C649.22L252.57%2C646.66L254.45%2C643.45L255.17%2C641.23L255.17%2C641.23L256.67%2C640.03L257.7%2C638.62L259.39%2C635.58L260.59%2C631.67L259.44%2C626.46L256.89%2C618.55L256.91%2C604.44L256.39%2C602.69L256.42%2C600.5L257.05%2C600.08L262.05%2C600.12L263.49%2C599.63L267.43%2C599.61L268.85%2C599.13L271.61%2C599.03L271.61%2C599.03L271.45%2C606.57L271.91%2C607.75L272%2C610.49L273.61%2C617.68L276.29%2C625.09L278.72%2C629.08L280.57%2C633.01L281.41%2C633.8L281.41%2C633.8L281.64%2C635.74L284.61%2C642.82L281.6%2C651.29L282.62%2C655.65L288.28%2C670.71L293.83%2C688.85L301.11%2C702.8L300.71%2C703.73L294.76%2C709.56L294.43%2C710.3L300.83%2C715.36L304.98%2C724.1L308.22%2C728.53L312%2C731.83L315.41%2C734.21L318.51%2C738.95L323.68%2C742.42L323.68%2C742.42L319.43%2C744.88L315.58%2C747.9L311.3%2C749.79L306.56%2C752.93L302.56%2C754.58L295.55%2C756.84L293.52%2C758.39L286.22%2C765.71L280.47%2C767.53L274.34%2C770.28L267.91%2C772.29L255.11%2C773.66L242.15%2C775.83L239.66%2C776.52L230.35%2C781.14L219.55%2C787.96L214.59%2C792L208.7%2C788.73L207.14%2C787.27L203.49%2C782.32L203.03%2C780.28L202.62%2C769.69L201.29%2C760.52L200.61%2C757.65L198.58%2C753.29L194.68%2C749.29L190.27%2C745.91L184.63%2C743.72L177.34%2C738.12L173.2%2C736.65L170.92%2C735.32L170.92%2C735.32L154.73%2C714.31L149.33%2C709L148.55%2C707.58L146.73%2C701.38L144.72%2C697.2L144.77%2C691.36L146.28%2C687.21L146.86%2C684.29L147.23%2C677.73L146.97%2C675.94L146.01%2C675.19L143.29%2C675.1L142.12%2C674.63L139.53%2C674.54L136.99%2C673.89L132.04%2C672.2L128.81%2C670.03L127.75%2C668.92L126.64%2C666.65L125.06%2C663.04L123.68%2C658.7L119.2%2C653.71L116.26%2C648.57L115.14%2C647.44L115.14%2C647.44L117.93%2C641.03L119.59%2C634.96L121.73%2C630.24L122.45%2C627.04L122.78%2C621.46L122.68%2C596.34L122.29%2C593.1L119.7%2C583.71L117.8%2C572.87L113.6%2C562.67L110.77%2C556.88L111.84%2C552.73L112.35%2C547.53L112.24%2C540.99L111.68%2C535.89L110.52%2C530.75L109.11%2C521.67L106.35%2C512.09L106.35%2C512.09L114.72%2C510.42L120.82%2C509.81L122.53%2C509.34L128.2%2C509.41L134.96%2C510.98L138.96%2C511.09L142.23%2C511.63z%22%2F%3E%0A%09%09%3Cpath%20fill%3D%22white%22%20stroke%3D%22none%22%20id%3D%22LI-10%22%20title%3D%22Triesenberg%22%20%20d%3D%22M296.29%2C568.98l2.41%2C-1.53l2.66%2C-0.13l2.1%2C-0.7l3.26%2C-2.17l2.84%2C-2.72l1.94%2C-0.78l4.05%2C0.04l4.55%2C1.05l5%2C0.08l2.07%2C0.52l2.06%2C-0.5l7%2C0.03l2.2%2C-0.44l16.76%2C5.33l4.49%2C0.93l1.77%2C-3.26l2.43%2C-2.97l0%2C0l14.52%2C14.29l10.76%2C17.95l8.18%2C23.76l-6.47%2C22.04l-3.46%2C23.33l-25.77%2C0.51l-22.94%2C10.27l-0.7%2C4.65l0%2C0l-1.12%2C-0.79l-1.27%2C-3.31l-1.33%2C-1.79l-1.67%2C-3.39l-0.76%2C-2.41l-2.16%2C-3.37l-2.81%2C-2.69l-3.38%2C-4.22l-1.63%2C-3.94l-0.08%2C-2.77l-0.59%2C-2.62l-1.34%2C-3.21l0%2C0l2.27%2C-1.38l0.7%2C-1.25l0.62%2C-3.11l0.09%2C-2.6l0.46%2C-1.18l0.09%2C-2.61l0.47%2C-1.18l0.11%2C-2.73l2.02%2C-5.62l1.28%2C-4.78l1.98%2C-4.22l0.03%2C-2.68l-3.03%2C-3.25l-1.61%2C-2.62l-1.12%2C-5.17l-0.13%2C-3.26l-1.08%2C-4.28l-0.7%2C-1.51l-2.87%2C-2.49l-2.81%2C-3.67l-2.44%2C-2l-0.85%2C-1.86l-1.59%2C-2.19l-2.69%2C-2.73l-5.38%2C-3.79l-4.42%2C-1.39L296.29%2C568.98zM273.77%2C401.98l-2.09%2C5.05l-0.21%2C4.11l-1.12%2C2.59l-1.97%2C2.83l-0.09%2C2.79l-0.44%2C1.62l1.02%2C2.67l-0.53%2C1.72l-0.1%2C3.69l-0.46%2C1.21l0.5%2C2.45l-1.6%2C3.15l-0.27%2C1.64l0.29%2C1.6l0%2C0l-0.1%2C4.46l-0.6%2C2.42l-2.78%2C6.18l-4.83%2C4.87l-2.38%2C1.8l-3.57%2C4.63l-3.95%2C3.72l-0.34%2C1.01l0.03%2C4.24l-1.69%2C2.38l-1.09%2C0.16l-2.45%2C-2.06l-1.13%2C0.08l-3.08%2C4.44l-1.39%2C3.7l-2.45%2C3.62l-0.17%2C2.77l0.63%2C1.74l0.59%2C0.66l9.82%2C6.22l2.5%2C3.58l2.6%2C2.93l6.01%2C4.7l3.44%2C1.19l5.71%2C0.73l6.46%2C2.6l8.58%2C1.28l0.71%2C0.81l0.2%2C5.09l-0.52%2C1.74l-0.11%2C3.31l-2.77%2C8.98l-3.63%2C9.2l-0.08%2C3.7l-0.51%2C1.63l-0.05%2C6.11l-0.48%2C1.91l-0.08%2C4.43l-0.53%2C2.81l0%2C0l-2.62%2C6.66l-1.64%2C6.5l-0.15%2C2.54l-0.5%2C1.6l0.03%2C7.6l0.43%2C1.02l0.69%2C4.64l2.18%2C5.62l0%2C0l-2.76%2C0.1l-1.41%2C0.48l-3.95%2C0.01l-1.43%2C0.5l-5.01%2C-0.04l-0.63%2C0.42l-0.02%2C2.19l0.52%2C1.75l-0.02%2C14.11l2.55%2C7.91l1.15%2C5.21l-1.2%2C3.91l-1.68%2C3.04l-1.04%2C1.41l-1.5%2C1.2l0%2C0l-2.53%2C-1.04l-2.2%2C-0.08l-3.6%2C2.04l-2.22%2C0.62l-9.36%2C-3.07l0%2C0l-0.52%2C-2.38v-13.73l-6.5%2C-7.85l-1.12%2C0.05l-9.44%2C5.56h-1.23l-5.71%2C-4.36l-13.19%2C-14.28l-0.78%2C-2.27l-0.67%2C-4.34l-0.77%2C-2.04l-10.65%2C-8.18l-1.09%2C-0.27l-5.2%2C0.98l-2.52%2C0.03l-1.13%2C0.46l-2.63%2C0.05l-1.84%2C0.53l-2.38%2C-0.09l-1.14%2C-1.16l-3.18%2C-5.45l-0.14%2C-0.89l2.63%2C-6.18l2.22%2C-10.95l0.1%2C-2.46l0.51%2C-1.91l-0.04%2C-9l-2.33%2C-7.33l-2.58%2C-0.12l-1.71%2C0.47l-3.56%2C-1.2l-0.94%2C-0.62l-3.15%2C-4.27l-0.08%2C-1.12l1.49%2C-3.3v-0.82l-5.08%2C-7.02l-0.27%2C-6.54l-4.53%2C-6.65l0%2C0l5.64%2C-2.33l1.15%2C-4.36l0.1%2C-2.48l0.53%2C-1.87l-0.33%2C-1.6l-2.66%2C-2.17l-2.24%2C-2.58l-0.65%2C-2.48l-0.09%2C-3.69l-3.57%2C-4.79l-0.12%2C-2.91l-0.5%2C-1.59l0.05%2C-8.14l2.27%2C-8.52l2.3%2C-3.7l4.46%2C-2.07l1.52%2C-0.98l0.26%2C-0.59l-0.09%2C-2.34l-2.46%2C-5.4l-1.63%2C-4.81l0.04%2C-3.37l2%2C-1.31l2.58%2C0.71l4.51%2C7.73l2.86%2C1.28l0.88%2C0.07l1.35%2C-1.12l0.23%2C-0.86l-0.07%2C-4.86l-2.06%2C-5.47l0.11%2C-2.06l1.14%2C-1.72l2.94%2C-0.66l6.35%2C0.14l3.32%2C2.25l3.51%2C5.37l0.97%2C0.43l6.27%2C-2.8l4.18%2C-4.05l3.78%2C-1.59l2.37%2C-0.27l0.02%2C-2.19l-3.07%2C-12.1l-0.04%2C-1.87l4.21%2C-11l1.86%2C-5.97l2.5%2C-5.37l2.17%2C-5.95l0.12%2C-3.34l-0.34%2C-1.28l0%2C0l0.5%2C-1.48l5.67%2C-6.75l3.44%2C-5.58l1.42%2C-1.58l0%2C0l12.86%2C6.48l6.45%2C4.89l14.76%2C12.84l8.06%2C6.55l7.16%2C3.93l7.36%2C2.19L273.77%2C401.98z%22%2F%3E%0A%09%09%3Cpath%20fill%3D%22white%22%20stroke%3D%22none%22%20id%3D%22LI-11%22%20title%3D%22Vaduz%22%20%20d%3D%22M273.19%2C562.84l2.72%2C0.07l3.29%2C1.04l5.98%2C0.12l2.9%2C1.52l4.2%2C1.28l3.1%2C1.93l0.92%2C0.19l0%2C0l2.94%2C1.51l4.42%2C1.39l5.38%2C3.8l2.69%2C2.73l1.59%2C2.19l0.85%2C1.86l2.44%2C2.01l2.81%2C3.67l2.87%2C2.49l0.71%2C1.51l1.08%2C4.28l0.13%2C3.26l1.12%2C5.17l1.61%2C2.62l3.03%2C3.26l-0.03%2C2.68l-1.98%2C4.22l-1.28%2C4.78l-2.02%2C5.62l-0.11%2C2.73l-0.47%2C1.18L324%2C634.52l-0.46%2C1.18l-0.08%2C2.6l-0.62%2C3.11l-0.69%2C1.25l-2.27%2C1.39l0%2C0l-1.98%2C0.77l-1.69%2C0.07l-3.34%2C-1.03l-6.41%2C-1.29l-11.43%2C-3.89l-6.1%2C-4.1l-1.5%2C-0.58l-6.01%2C-0.17l0%2C0l-0.84%2C-0.79l-1.85%2C-3.93l-2.43%2C-3.99l-2.68%2C-7.41l-1.62%2C-7.18l-0.09%2C-2.74l-0.46%2C-1.18l0.16%2C-7.53l0%2C0l-2.18%2C-5.62l-0.69%2C-4.64l-0.43%2C-1.02l-0.02%2C-7.6l0.5%2C-1.6l0.15%2C-2.54l1.64%2C-6.5L273.19%2C562.84zM311.23%2C458.82l5.52%2C4.85l4.78%2C5.13l3.5%2C2.44l4.83%2C6.11l1.14%2C3.08l0%2C9.96l0.59%2C3.66l1.96%2C3.41l1.62%2C5.88l0.05%2C1.75l0%2C0l-2.08%2C0.71h-4.09l-6.15%2C-1.6l-2.32%2C-0.13l-3.78%2C-5.72l-3.02%2C-0.71L311%2C497.58l-3.7%2C1.06l-3.83%2C-0.07l-2.31%2C-0.52l-8.12%2C-0.15l-5.46%2C-4.98l-1.31%2C-3.92l-4.64%2C-7.03l0.02%2C-1.14l1.23%2C-0.69l7.11%2C-0.67l6.92%2C-2.14l1.01%2C-0.69l4.51%2C-4.74l7.63%2C-10.86L311.23%2C458.82zM93.51%2C468.46l-5.61%2C-22.28l-13.95%2C-20.42l-3.46%2C-6.14l3.23%2C-0.51l6.14%2C0.01l1.32%2C0.57l5.75%2C7.23L93%2C435.79l2.99%2C3.65l2.07%2C6.88l1.78%2C-0.07l5.19%2C-2.14l1.77%2C-1.02l0.12%2C-0.66l-9.54%2C-11.94l-1.63%2C-2.84l-3.23%2C-9.35l-2.28%2C-12.39l-3.06%2C-2.64l-0.67%2C-0.96l0.2%2C-0.89l1.91%2C-2.41l0%2C-0.83l-25.96%2C-22.68l-0.64%2C-1.84l-0.11%2C-2.33l-2.07%2C-9.36l0%2C-1.48l0.3%2C-0.46l8.86%2C0.01l1.07%2C0.44l2.15%2C0.12l11.68%2C2.65l1.9%2C0.16l1.4%2C0.65l0.01%2C1.28l-1.03%2C2.48l0.01%2C3.57l4.3%2C20.44l1.11%2C1.24l1.62%2C1.05l9.96%2C5.63l0.91%2C-0.07l7.08%2C-3.03l7.51%2C-1.84l0.2%2C-3.91l-0.5%2C-2.36l-0.01%2C-6.3l-0.48%2C-3.31l0.84%2C-0.73l3.32%2C-0.01l2.09%2C-0.67l3.99%2C-8.08l0.5%2C-0.36l2.57%2C0.01l1.2%2C0.47l8.21%2C1.28l15.06%2C4.86l5.06%2C0.04l6.92%2C-1.01l7.27%2C0.04l8.84%2C-0.5l3.08%2C0.55l3.46%2C0.08l1.4%2C0.49l3.07%2C0.09l9.86%2C4.9l0%2C0l0.34%2C1.28l-0.12%2C3.34l-2.17%2C5.95l-2.5%2C5.37l-1.86%2C5.97l-4.21%2C11l0.04%2C1.87l3.07%2C12.11l-0.02%2C2.19l-2.37%2C0.27l-3.78%2C1.59l-4.18%2C4.05l-6.27%2C2.8l-0.97%2C-0.43l-3.51%2C-5.37l-3.32%2C-2.25l-6.35%2C-0.13l-2.93%2C0.66l-1.14%2C1.72l-0.11%2C2.06l2.06%2C5.47l0.07%2C4.86l-0.23%2C0.86l-1.35%2C1.12l-0.88%2C-0.07l-2.86%2C-1.28l-4.51%2C-7.73l-2.58%2C-0.71l-2%2C1.31l-0.04%2C3.37l1.63%2C4.81l2.46%2C5.4l0.09%2C2.34l-0.26%2C0.59l-1.52%2C0.98l-4.45%2C2.07l-2.3%2C3.7l-2.27%2C8.52l-0.05%2C8.14l0.5%2C1.59l0.12%2C2.91l3.57%2C4.79l0.09%2C3.69l0.65%2C2.48l2.24%2C2.58l2.66%2C2.17l0.33%2C1.6l-0.53%2C1.87l-0.1%2C2.48l-1.15%2C4.36l-5.64%2C2.33l0%2C0l-3.85%2C0.59l-3.27%2C-0.54l-4%2C-0.11l-6.76%2C-1.57l-5.67%2C-0.07l-1.71%2C0.47l-6.1%2C0.61l-8.36%2C1.67l0%2C0l-2.09%2C-10.7l-2.76%2C-7.42l-2.1%2C-10.11l-2.1%2C-4.95l-2.24%2C-7.32L93.51%2C468.46zM138.11%2C326.7l4.01%2C2.98l0.63%2C0.98l-4.34%2C6.79l-0.82%2C0.65l-5.47%2C-2.75l-4%2C-7.88l-1.4%2C-0.67l-3.45%2C-0.07l-0.46%2C-0.65l1.82%2C-6.1l1.08%2C-0.28l8.58%2C4.01L138.11%2C326.7zM206.13%2C288.5l-1.89%2C0.81L203%2C285.98l-1.54%2C-1.99l-5.09%2C-3.02l-1.8%2C-1.74l0%2C0l-2.32%2C-1.28l0%2C0l3.75%2C-2.57l0%2C0l6.54%2C5.93L206.13%2C288.5zM111.75%2C268.73l7.42%2C35.88l-0.51%2C0.4l-3.32%2C0.5l-6.63%2C-0.03l-2.51%2C0.51h-6.47l-0.79%2C-0.21l-0.61%2C-1.16l-3.45%2C-10.46l-6.65%2C-8.49l-0.53%2C-1.09l-4.5%2C-15.87l-1.27%2C-1.82l0%2C0l2.89%2C-0.04l2.15%2C0.54l5.41%2C0.03l0%2C0l4.24%2C0.04l2.75%2C0.55l9.07%2C0.07L111.75%2C268.73z%22%2F%3E%0A%09%3C%2Fg%3E%0A%3C%2Fsvg%3E)
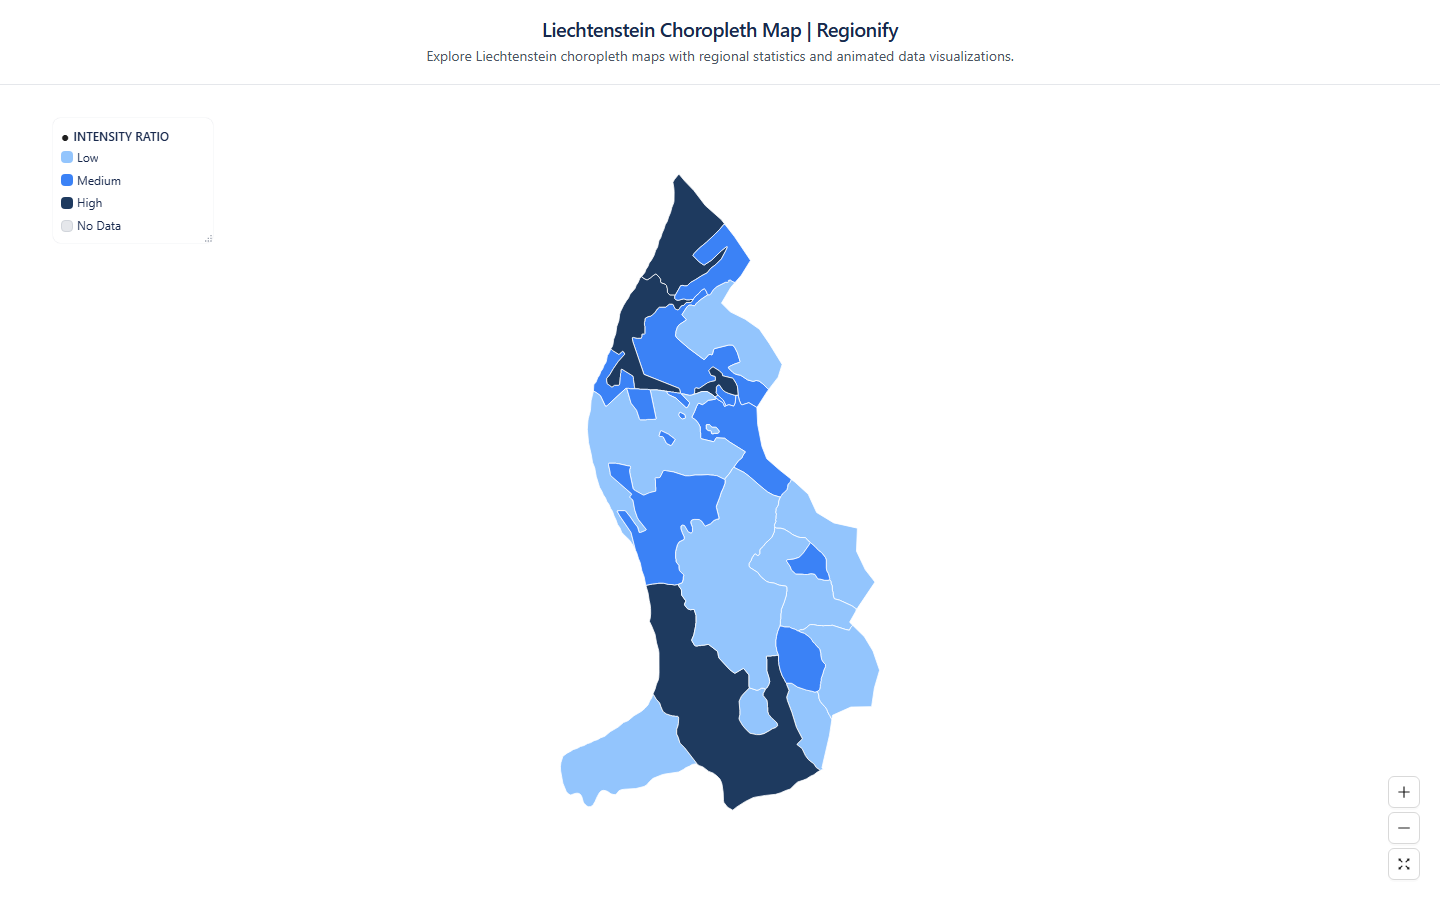
Choropleth Map of Liechtenstein
Regionify is a choropleth map tool that turns regional data into clear, publish-ready visualizations. Color administrative divisions by any numeric metric — GDP per capita, population density, election results, or your own dataset — then export as PNG, SVG, animated GIF, or an embeddable iframe. No GIS expertise required.
Create your map of LiechtensteinWhat you can create for Liechtenstein with Regionify
From static maps to animated time-series — every format, ready to export.
Liechtenstein choropleth map
Visualize Liechtenstein's 11 municipalities as a choropleth map. Color regions by any numeric dataset — population, GDP, unemployment, health outcomes, and more. Export as PNG, JPEG, or PDF.
Vector SVG export
Export your Liechtenstein map as a scalable vector graphic (SVG). Ideal for print publications, editorial illustrations, and web use — scales to any resolution without quality loss.

Animated GIF
Bring your Liechtenstein data to life. Import historical time-series data and export a looping animated GIF showing how regional values changed over time.
MP4 video export
Export your Liechtenstein time-series map as an MP4 video. Perfect for presentations, reports, and social media posts where motion communicates change more clearly than static images.
Public share page
Share your Liechtenstein choropleth map with a public link. Anyone with the URL can view the full interactive map — no account or login required.
Embeddable iframe
Embed your Liechtenstein choropleth map anywhere with a single line of HTML. The iframe stays live — viewers always see the latest version of your map, no re-publishing needed.
AI-powered data import for Liechtenstein maps
No spreadsheet? No problem. Regionify's AI Agent turns a plain-text description or raw pasted data into a ready-to-visualize dataset in seconds.
AI Generator
Generate Liechtenstein data from a prompt
Describe the dataset you need in plain English — for example "GDP per capita of Liechtenstein's 11 municipalities in 2023" or "election results by municipalities" — and the AI generates a plausible, structured dataset that maps directly onto Liechtenstein's administrative boundaries. Edit any values in the table view before saving.
- ✓ Works for population, GDP, health, election, and custom metrics
- ✓ Supports time-series prompts for animated maps
- ✓ Output pre-matched to Liechtenstein's 11 municipalities
AI Parser
Clean and import messy Liechtenstein data
Paste raw text, a copied Wikipedia table, or an unstructured CSV with regional figures for Liechtenstein. The AI parser normalises region names, strips noise, resolves mismatched spelling across Liechtenstein's municipalities, and outputs a clean id–label–value table ready to visualise.
- ✓ Handles inconsistent or misspelled municipalities names
- ✓ Auto-detects time columns for historical data
- ✓ Streams results in real time as AI processes
AI Agent is available on the Chronographer plan.
Municipalities of Liechtenstein
- Balzers
- Eschen
- Gamprin
- Mauren
- Planken
- Ruggell
- Schaan
- Schellenberg
- Triesen
- Triesenberg
- Vaduz
Build your own Liechtenstein choropleth map — free
Upload any dataset, color Liechtenstein's municipalities by any numeric metric, and export as PNG, SVG, GIF, or MP4. No design skills required — start in seconds, publish anywhere.