%20ammap.com%20%7C%20SVG%20map%20of%20Norway%20-%20High%20--%3E%0A%3Csvg%20xmlns%3D%22http%3A%2F%2Fwww.w3.org%2F2000%2Fsvg%22%20xmlns%3Aamcharts%3D%22http%3A%2F%2Famcharts.com%2Fammap%22%20xmlns%3Axlink%3D%22http%3A%2F%2Fwww.w3.org%2F1999%2Fxlink%22%20version%3D%221.1%22%20viewBox%3D%220%200%20820%201250%22%20width%3D%22100%25%22%20height%3D%22100%25%22%20preserveAspectRatio%3D%22xMidYMid%20slice%22%3E%0A%09%3Cdefs%3E%0A%09%09%0A%0A%09%09%3Camcharts%3Aammap%20projection%3D%22mercator%22%20leftLongitude%3D%224.641249%22%20topLatitude%3D%2271.184669%22%20rightLongitude%3D%2231.063204%22%20bottomLatitude%3D%2257.979819%22%3E%3C%2Famcharts%3Aammap%3E%0A%0A%09%09%3C!--%20All%20areas%20are%20listed%20in%20the%20line%20below.%20You%20can%20use%20this%20list%20in%20your%20script.%20--%3E%0A%09%09%3C!--%7Bid%3A%22NO-02%22%7D%2C%7Bid%3A%22NO-09%22%7D%2C%7Bid%3A%22NO-06%22%7D%2C%7Bid%3A%22NO-20%22%7D%2C%7Bid%3A%22NO-04%22%7D%2C%7Bid%3A%22NO-12%22%7D%2C%7Bid%3A%22NO-15%22%7D%2C%7Bid%3A%22NO-18%22%7D%2C%7Bid%3A%22NO-17%22%7D%2C%7Bid%3A%22NO-01%22%7D%2C%7Bid%3A%22NO-05%22%7D%2C%7Bid%3A%22NO-03%22%7D%2C%7Bid%3A%22NO-11%22%7D%2C%7Bid%3A%22NO-14%22%7D%2C%7Bid%3A%22NO-16%22%7D%2C%7Bid%3A%22NO-08%22%7D%2C%7Bid%3A%22NO-19%22%7D%2C%7Bid%3A%22NO-10%22%7D%2C%7Bid%3A%22NO-07%22%7D--%3E%0A%0A%09%3C%2Fdefs%3E%0A%09%3Cg%3E%0A%09%09%3Cpath%20fill%3D%22white%22%20stroke%3D%22none%22%20id%3D%22NO-02%22%20title%3D%22Akershus%22%20%20d%3D%22M137.47%2C710.92l-0.82%2C0.47l-0.98%2C-0.23l-0.44%2C-0.3l-0.21%2C0.44l-0.78%2C-0.48l-0.14%2C-0.31l0.21%2C-0.36l-0.14%2C-1.36l-0.54%2C-1.73l0.65%2C-0.34l0.03%2C-0.91l0.39%2C-0.62l0.02%2C-0.31l-0.59%2C-1.42l0.28%2C-0.76l0.35%2C-0.45l0.87%2C-0.39l0.04%2C-0.87l0.34%2C-0.43l0.1%2C-0.73l0.92%2C-0.08l0.28%2C0.67l0%2C0l0.66%2C0.8l1.56%2C0.7l0.79%2C0.71l0.26%2C0.67l-0.11%2C1.6l0.25%2C0.34l0%2C0l-0.15%2C1.07l-0.18%2C0.19l-0.21%2C0.04l-1.09%2C-0.2l-0.38%2C-0.05l-0.59%2C-0.02l-0.48%2C0.57l0.06%2C0.83l0.21%2C0.78l-0.94%2C0.9l0.12%2C0.24l0.45%2C0.58L137.47%2C710.92zM152.63%2C673.42l1.44%2C1.84l-0.22%2C2.85l0.79%2C0.16l0.6%2C0.33l0.84%2C1.14l1.02%2C0.39l0.29%2C0.65l0.61%2C2.65l0.73%2C1.7l0.77%2C0.63l0.56%2C0.07l0.46%2C1.19l2.19%2C1.87l-0.02%2C0.74l-0.34%2C0.88l0.01%2C1.47l0.1%2C1.31l0.94%2C1.57l0.91%2C0.78l2.6%2C1.43l1%2C1.28l0.1%2C0.61l0.22%2C1.29l-0.17%2C0.97l-0.57%2C0.67l-0.23%2C1l0.57%2C1.08l-0.33%2C1.42l0.8%2C3.1l0%2C0l0.3%2C0.5l0.72%2C0.26l0.97%2C1.5l0%2C0l-0.32%2C0.04l-0.82%2C0.35l-0.93%2C-0.2l-0.96%2C0.14l-0.6%2C0.42l-0.94%2C0.55l-0.41%2C0.22l-0.31%2C0.96l0.1%2C0.85l-0.61%2C0.76l-0.47%2C0.98l-0.11%2C0.14l-0.46%2C0.38l-1.15%2C0.96l-1.2%2C0.32l-0.05%2C1.11l-0.19%2C0.51l-0.59%2C0.4l-0.33%2C-0.36l-0.04%2C-0.8l0.24%2C-1.12l-0.29%2C-0.91l-0.44%2C-0.28l-0.99%2C-0.2l-0.87%2C-0.97l-0.01%2C-1.38l-0.25%2C-0.55l-0.9%2C-0.82l-0.84%2C-0.17l-0.63%2C-0.43l-0.41%2C0.75l-0.28%2C1.27l0.05%2C1.96l-1.44%2C-0.02l-1.39%2C-0.45l-0.2%2C-0.2l-0.63%2C-0.07l-2.01%2C-0.25l-0.37%2C0.1l-0.25%2C1.23l0.53%2C0.89l-0.36%2C0.4l-0.75%2C0.68l-0.17%2C0.13l-0.43%2C0.31l-0.51%2C0.12l-0.31%2C0.62l-0.07%2C0.6l-0.39%2C1.01l-0.17%2C0.17l-0.58%2C0.14l-0.31%2C-0.14l-0.62%2C0.48l0.21%2C0.67l-0.27%2C1.32l-0.07%2C0.75l-0.49%2C0.51l-0.5%2C0.52l-1.08%2C-1.5l0%2C0l-0.08%2C-0.47l-0.21%2C-0.21l-0.51%2C-1.73l0.21%2C-1.11l-0.1%2C-1.51l-0.74%2C-2.59l-0.1%2C-0.41l-0.34%2C-1.37l-0.26%2C-0.27l-0.18%2C-1.81l0.58%2C-1.71l-0.02%2C-0.38l0.95%2C-1.75l0.2%2C-1.08l0.18%2C-0.19l0.79%2C1.4l0.05%2C1.37l0.34%2C1.56l-0.02%2C0.69l-0.01%2C0.22l0.24%2C0.01l0.27%2C-0.57l-0.08%2C-1.24l0.33%2C-0.96l0.61%2C-0.75l0%2C0l0.54%2C0.33l0.85%2C0.51l0.71%2C0.2l0.6%2C-0.17l0.98%2C-0.65l0.1%2C-0.14l-0.53%2C-1.73l-0.04%2C-1.16l0.26%2C-1.57l0.61%2C-0.88l-0.81%2C-1.55l-0.51%2C0.24l-1.15%2C-1l-0.2%2C-1.03l-0.3%2C-0.03l0.08%2C-1.87l-0.59%2C-0.21l-0.72%2C-1.17l-0.07%2C-1.08l-0.48%2C-0.36l-0.3%2C0.23l-0.32%2C-0.03l-0.75%2C-0.69l0%2C0l-0.13%2C-0.51l0.63%2C-0.28l0.59%2C-0.08l0.93%2C0.27l0.32%2C-1.43l-0.15%2C-1.22l0.75%2C-2.57l0.68%2C-1.26l2.18%2C-2.65l-0.66%2C-1.36l-0.21%2C-0.92l-1.55%2C-1.34l-3.43%2C-0.44l-0.05%2C-0.18l0.84%2C-1.06l0.22%2C-1.89l-0.14%2C-0.68l0.86%2C0.66l1.24%2C0.41l0.91%2C0.59l1.38%2C0.26l0.31%2C0.2l0.69%2C-0.17l0.23%2C-0.24l-0.28%2C-0.36l1.02%2C-0.68l1.59%2C-0.62l0.69%2C-0.05l0.3%2C-1.75l0.24%2C-0.35l0.07%2C-1.04l0.27%2C-0.49L152.63%2C673.42z%22%2F%3E%0A%09%09%3Cpath%20fill%3D%22white%22%20stroke%3D%22none%22%20id%3D%22NO-09%22%20title%3D%22Aust-Agder%22%20%20d%3D%22M101.84%2C768.08l0.39%2C-0.11l-0.21%2C0.46l-0.36%2C0.39l-0.27%2C0.63l-0.31%2C0.54l-0.49%2C0.78l-1.13%2C0.7l-0.38%2C-0.2l-0.55%2C-0.11l0.87%2C-1.37l0.72%2C-0.65L101.84%2C768.08zM55.71%2C738.25l0.21%2C-0.31l1.27%2C-0.02l0.56%2C0.32l3.7%2C1.06l0.38%2C0.7l-0.41%2C0.36l-0.89%2C4.02l0.04%2C0.42l0.43%2C0.37l0.27%2C0.54l-0.14%2C0.58l-1.12%2C-0.13l-0.21%2C0.28l0.28%2C1.17l0.4%2C0.15l0.37%2C1.04l-0.06%2C1.46l-0.3%2C0.65l-0.46%2C0.43l-1.38%2C0.36l0.02%2C0.34l0.68%2C0.32l-0.05%2C0.31l-0.14%2C0.35l-1.16%2C1.09l-0.01%2C0.2l2.93%2C0.04l0.09%2C-0.64l2.52%2C-0.26l1.39%2C-0.58l0.45%2C-0.06l0.19%2C0.2l0.6%2C-0.5l1.42%2C-0.75l0.31%2C0.1l0.12%2C0.28l-0.12%2C0.5l0.79%2C-0.35l1.91%2C0.51l0.08%2C0.56l1.39%2C2.71l0.35%2C0.38l-0.02%2C1.66l-0.08%2C0.33l-0.56%2C0.73l-0.29%2C1.07l-0.57%2C0.25l-0.96%2C-0.03l-0.26%2C0.2l-0.13%2C2.27l0.1%2C0.27l1.1%2C0.52l0.51%2C0.43L71%2C765.2l-0.52%2C0.76l-1.46%2C1.1l-0.04%2C0.4l0.36%2C1.01l-0.17%2C0.79l1.02%2C1.6l1.43%2C-0.49l0.67%2C0.23l0.56%2C0.44l0.42%2C-0.91l1.6%2C0.35l0.4%2C-0.07l0.17%2C-0.21l0.28%2C0.13l0.05%2C1.34l-0.48%2C0.63l1.18%2C0.31l0.32%2C0.2l0.19%2C0.49l0.52%2C0.04l0.29%2C0.19l0.23%2C0.51l-0.18%2C0.48l0.21%2C0.31l0%2C0.39l0.69%2C1.17l0.59%2C0.24l0.15%2C-0.07l-0.02%2C-0.77l0.27%2C-0.55l0.85%2C-0.97l0.36%2C-0.2l0.37%2C0.04l-0.16%2C0.97l0.43%2C0.3l0.09%2C1.58l0.2%2C0.28l-0.46%2C0.43l-0.01%2C0.41l1.21%2C0.07l0.33%2C0.33l0.57%2C-0.34l0.4%2C0.03l0.25%2C0.14l0.05%2C0.28l-0.33%2C0.58l1.05%2C0.69l-0.31%2C1.01l-0.03%2C0.67l-0.77%2C0.63l-0.2%2C0.5l0.3%2C1.3l0.46%2C0.26l0%2C0l0.24%2C-0.37l0.26%2C0.17l0.06%2C0.76l0.64%2C0.12l0.16%2C-0.11l0.35%2C-0.39l-0.44%2C-1l0.57%2C-0.1l0.53%2C-1.03l0.4%2C-0.51l-0.44%2C-0.74l0.5%2C-0.18l0.52%2C0.06l0.5%2C-0.43l0.37%2C-0.51l0.69%2C-0.45l0.6%2C0.17l0.11%2C-0.47L90%2C778.62l0.78%2C0.3l1.03%2C-0.01l0.54%2C-0.42l0.09%2C-0.31l0.03%2C-0.31l-0.09%2C-0.32l0.69%2C-0.64l0.52%2C-1.08l0.61%2C0.07l0.44%2C-0.18l0.29%2C-0.37l0.17%2C-0.49l0.77%2C-0.02l0.96%2C-0.97l0.28%2C-0.58l-0.53%2C-0.13l0.28%2C-1l-0.02%2C-0.76l1.05%2C-1.04l0.9%2C-0.68l0.98%2C-0.71l0.88%2C-0.81l0.4%2C-0.45l0.7%2C-0.66l0.85%2C-0.89l0.18%2C-0.51l-0.39%2C-0.13l0.29%2C-0.73l0.69%2C-0.08l0.07%2C-0.37l0.33%2C-0.58l0.44%2C-0.48l0.7%2C-0.13l1.62%2C-1.14l0.29%2C-0.64l1.2%2C-0.21l0.65%2C-0.94l-0.62%2C-0.31l0.18%2C-0.54l0.64%2C-0.37l0.09%2C-0.51l-0.19%2C-0.48l-0.02%2C-0.17l0.5%2C-0.11l0.56%2C0.13l1.2%2C-0.69l0.33%2C0.1l0.4%2C-0.76l0%2C0l-0.88%2C-0.55l-0.51%2C0.54l-0.81%2C-1.03l-0.77%2C-0.01l-0.97%2C-0.3l-0.16%2C-0.57l-0.04%2C-1.17l-0.43%2C-1.41l-0.36%2C-0.44l-1.83%2C-1.11l-0.84%2C-0.79l-0.29%2C-0.36l-0.9%2C-2.58l-1.42%2C0.25l-2.36%2C-0.08l-0.14%2C0.65l-1.73%2C1.39l0.29%2C0.38l1.5%2C0.92l-1.08%2C2.02l0.4%2C0.22l-0.31%2C0.89l-0.87%2C0.47l-0.61%2C-0.83l-1.29%2C-0.93l-1.06%2C-1.71l-0.47%2C-0.28l-0.44%2C-0.6l-1.59%2C0.99l-0.72%2C1.09l-1.24%2C-0.88l-0.41%2C-0.69l-1.91%2C0.07l-2.5%2C-2.37l-2.04%2C-0.45l-0.92%2C0.41l-0.02%2C0.2l0.33%2C0.19l0.86%2C0.09l-0.78%2C0.5l-0.58%2C0.15l-0.56%2C-0.09l-0.99%2C-0.52l-0.64%2C-0.06l-0.93%2C-1.74l-0.48%2C-0.29l-1.31%2C-2.85l-0.58%2C-0.71l-0.69%2C-1.38l-1.26%2C-1.09l-0.23%2C-0.4l-0.17%2C-0.58l0.31%2C-1.43l0.26%2C-0.59l0.48%2C-0.17l0.06%2C-0.26l-0.32%2C-0.26l-0.82%2C-1.67l-0.58%2C-2.36l-0.38%2C-0.56l-0.49%2C-0.32l-1.17%2C-0.22l-0.29%2C-0.19l-1.85%2C-2.56l0.04%2C-0.31l2.84%2C-0.15L71%2C724l-0.11%2C-0.21l-1.34%2C-0.82l-0.08%2C-0.22l-0.4%2C-1.45l0.77%2C-1.19l-0.34%2C-0.81l-0.18%2C0.05l-1.07%2C-1.07l-0.06%2C-0.63l-0.45%2C-0.35l-0.24%2C-0.5l-0.69%2C0.06l-0.41%2C-0.25l-0.57%2C1.2l-0.85%2C-0.45l-0.3%2C0.16l-0.15%2C-0.34l-0.86%2C-0.73l-0.27%2C0.23l-1.42%2C-0.36l0%2C0l-1.5%2C0.29l-0.9%2C0.41l0.15%2C1.27l-1.49%2C1.73l-0.75%2C-0.27l-0.68%2C2.15l0.71%2C2.8l-0.1%2C0.3l-1%2C1.45l-1.88%2C0.58l0.7%2C0.92l0.05%2C0.38l-0.6%2C0.09l0.02%2C-0.15l-0.14%2C-0.01l-1.21%2C3.77l-0.28%2C1.86l0.53%2C1.37l-0.11%2C2.75l0.25%2C0.22L55.71%2C738.25z%22%2F%3E%0A%09%09%3Cpath%20fill%3D%22white%22%20stroke%3D%22none%22%20id%3D%22NO-06%22%20title%3D%22Buskerud%22%20%20d%3D%22M84.96%2C651.43l0.98%2C-1.41l2.35%2C1.95l1.47%2C0.89l0.61%2C0.83l0.47%2C0.1l0.47%2C-0.11l0.49%2C0.15l0.2%2C0.27l0.73%2C0.15l1.42%2C1.08l0.6%2C0.84l-0.38%2C0.72l0.63%2C0.54l1.29%2C0.8l1.19%2C0.27l1.24%2C0.65l1.85%2C0.26l0.73%2C1.57l0.59%2C0.2l3.39%2C2.18l1.26%2C0.43l0.87%2C0.66l0.79%2C0.94l1.57%2C0.44l1.09%2C1.65l-0.11%2C0.94l-0.26%2C0.38l0.12%2C0.98l0.7%2C0.58l0.23%2C0.8l-0.03%2C0.57l0.33%2C0.62l0.27%2C0.32l0.74%2C0.16l0.34%2C0.71l-0.5%2C0.76l-0.06%2C0.81l0.2%2C0.72l1.7%2C0.98l0.95%2C-0.3l0.33%2C0.08l1.3%2C-0.24l0.45%2C1.37l-0.14%2C0.52l2.56%2C1.4l1.32%2C0.61l0.92%2C-0.04l0%2C-1.13l-0.31%2C-1.16l-0.14%2C-1.48l0.03%2C-0.96l0.57%2C-1.31l0.43%2C0.47l0.5%2C-0.42l0.92%2C-0.31l0.5%2C-0.36l0.29%2C-0.65l-0.56%2C-0.22l-0.52%2C-0.58l-0.01%2C-0.2l2.01%2C-0.15l0.78%2C0.22l0.83%2C1.19l0.49%2C1.16l0.06%2C0.74l0.85%2C1.34l0.68%2C0.66l0.49%2C2.01l0.49%2C4.46l1.76%2C3.94l1%2C1.58l-0.19%2C0.67l0.11%2C0.44l0.65%2C0.79l0.44%2C0.27l0.93%2C0.13l2.38%2C1.96l1.29%2C0.25l0.25%2C0.55l0.46%2C0.29l0.29%2C0.65l0%2C0l-0.71%2C0.79l0.38%2C0.83l0.19%2C0.92l-0.5%2C0.2l-1.97%2C2.63l0%2C0l-0.28%2C-0.67l-0.92%2C0.08l-0.1%2C0.73l-0.34%2C0.43l-0.04%2C0.87l-0.87%2C0.39l-0.35%2C0.45l-0.28%2C0.76l0.59%2C1.42l-0.02%2C0.31l-0.39%2C0.62l-0.03%2C0.91l-0.65%2C0.34l0.54%2C1.73l0.14%2C1.36l-0.21%2C0.36l0.14%2C0.31l0.78%2C0.48l0.21%2C-0.44l0.44%2C0.3l0.98%2C0.23l0.82%2C-0.47l0%2C0l0.16%2C0.63l0.25%2C0.39l0.16%2C1.5l0%2C1.79l0.42%2C0.29l0.85%2C0.66l0.44%2C0.07l0.42%2C3.4l-0.1%2C1.33l-0.84%2C0.89l-0.4%2C0.29l-1%2C0.51l-0.53%2C0.32l-0.64%2C0.18l-0.6%2C-0.17l-0.6%2C-0.51l-0.05%2C-0.32l0.22%2C-0.84l0.51%2C-2.28l0.01%2C-0.79l-0.11%2C-1.35l0.05%2C-0.53l-0.21%2C-0.43l-0.21%2C-0.28l-1.2%2C-1.59l-1.13%2C-0.01l-0.39%2C-0.48l-0.08%2C-0.52l-0.59%2C-0.37l-0.4%2C-0.17l-1.17%2C0.33l0.31%2C0.39l1.11%2C0.62l0.08%2C0.42l0.71%2C0.73l0.58%2C0.16l0%2C0l-0.47%2C1.11l-1.36%2C-0.11l-0.37%2C0.01l-0.48%2C0.2l-1.99%2C-0.01l-0.84%2C1.15l-0.93%2C0.11l-0.75%2C-0.91l-0.57%2C0.46l-0.19%2C1.11l-0.23%2C0.34l-0.83%2C0.52l0.07%2C0.8l-0.37%2C0.33l0.78%2C0.82l0.18%2C0.51l1.3%2C1.55l1.05%2C1.99l-1.09%2C0.53l-0.33%2C-0.23l-1.38%2C-0.07l-0.12%2C0.4l-0.5%2C0.16l-2.08%2C-0.56l-1.54%2C0.34l0.47%2C2.1l0%2C0l-1.44%2C-0.01l-0.68%2C0.17l-0.54%2C-0.1l-0.78%2C-0.58l-0.2%2C-0.61l-0.63%2C-0.46l-0.24%2C-1.1l-0.36%2C-0.5l-0.37%2C-0.15l-1.76%2C0.2l0.13%2C-0.84l0.79%2C-1.21l0.05%2C-0.38l-1.03%2C-0.9l-1.47%2C-4.75l0.04%2C-0.94l-1.64%2C-0.53l0.35%2C-0.89l-0.3%2C-0.34l0.47%2C-2.83l-1.07%2C-0.7l-1.1%2C-0.24l-1.82%2C-1.03l-0.2%2C-1.73l0.25%2C-1.27l-0.45%2C-0.4l0.42%2C-0.87l-0.44%2C-0.59l-0.81%2C-0.5l-0.64%2C-0.71l-0.97%2C-0.03l-0.68%2C-1.16l-0.84%2C0.19l-0.42%2C-0.6l0.73%2C-0.16l-0.46%2C-0.75l-0.25%2C-2.5l-0.52%2C-1.48l-1.04%2C-0.97l-2.97%2C-2.09l-0.58%2C-0.24l-2.15%2C-0.12l-1.52%2C-0.29l-1.07%2C0.03l-2.13%2C0.45l-1.56%2C-0.61l-2.46%2C0.07l-0.83%2C-0.19l-0.51%2C-0.3l-1.53%2C-0.02l-1.03%2C0.26l-1.03%2C1.11l-2.03%2C0.36l-1.42%2C0.59l-2.49%2C1.42l-0.79%2C-0.53l-2.8%2C-0.58l-3.79%2C1.58l0%2C0l0%2C0l0%2C0l0%2C0l0%2C0l2.14%2C-3.79l0.64%2C-3.34l1.49%2C-2.32l0.13%2C-4.06l1.12%2C-6.37l-0.43%2C-0.35l-0.63%2C-0.15l-1.03%2C-1.34l-0.4%2C-2.2l0.3%2C-1.24l-1.73%2C-1.13l-1.22%2C0.04l-1.81%2C-0.31l0.57%2C-0.46l0%2C0l1.55%2C-0.84l1.03%2C-1.52l1.29%2C-0.78l0.53%2C-0.05l0.53%2C0.31l0.57%2C-0.1l0.45%2C-0.46l0.33%2C-0.98l-0.37%2C-1.69l0.27%2C-0.62l1.53%2C-2.68l2.15%2C-1.82l2.52%2C1.17l0.72%2C0.15l0.62%2C-0.16l2.38%2C-4.03l0.51%2C-0.41l0.77%2C-0.28l0.24%2C-1.82L84.96%2C651.43z%22%2F%3E%0A%09%09%3Cpath%20fill%3D%22white%22%20stroke%3D%22none%22%20id%3D%22NO-20%22%20title%3D%22Finnmark%22%20%20d%3D%22M588.71%2C164.39l0.52%2C0.74l0.11%2C0.15l0.11%2C0.23l-0.1%2C0.13l-0.45%2C-0.13l-0.15%2C0.08l-0.72%2C0.16l-0.05%2C-0.41l0.24%2C-0.16l-0.13%2C-0.62l0.47%2C-0.34L588.71%2C164.39zM582.19%2C157.31l0.43%2C0.2l0.13%2C0.48l0.72%2C-0.39l0.93%2C0.45l0.53%2C0.63l0.19%2C0.54l-1.05%2C0.97l0.23%2C1.01l0.6%2C0.25l-0.12%2C-0.65l-0.33%2C0.01l0.51%2C-0.99l0.17%2C-0.35l0.28%2C0.16l-0.01%2C0.64l0.11%2C0.29l0.23%2C0.49l0.22%2C0.33l-0.39%2C1.28l-0.18%2C-0.11l-1.35%2C0.05l-0.46%2C0.07l-0.17%2C0.34l0.05%2C0.39l0.16%2C0.15l0.38%2C-0.74l0.29%2C-0.02l0.39%2C0.35l0.71%2C-0.08l0.21%2C0.1l0.49%2C-0.41l0.48%2C-0.35l0.4%2C-0.25l0.19%2C-0.07l0.35%2C0.87l0.06%2C0.66l-0.42%2C0.31l-0.47%2C-0.16l-0.65%2C0.48l-0.7%2C0.78l-0.47%2C-0.15l-0.42%2C0.47l-1.63%2C1.05l-0.23%2C0.32l-0.28%2C0.01l-0.29%2C-0.5l-0.38%2C-1.15l-0.23%2C-0.3l-0.28%2C-0.04l0.07%2C0.46l0.07%2C0.43l0.29%2C0.39l0.12%2C0.31l0.33%2C0.32l-0.04%2C0.66l-0.7%2C0.25l-1.29%2C-0.25l-1.33%2C0.36l-0.23%2C-0.28l0.58%2C-1.06l0.53%2C-1.91l0.28%2C-0.11l0.2%2C-0.62l0.54%2C-0.17l0.13%2C-0.55l0.25%2C-0.65l-0.2%2C-0.45l0.29%2C-0.36l-0.26%2C-1.51l0.2%2C-0.45l-0.2%2C-0.72l0.03%2C-1.33l1%2C-0.41L582.19%2C157.31zM430.01%2C141.15l0.99%2C0.4l0.14%2C0.22l-0.23%2C0.06l-1.02%2C0.08l0.11%2C0.62l-0.37%2C0.07l-0.57%2C-0.07l-0.51%2C-0.43l-0.07%2C-0.34l0%2C-0.47l0.14%2C-0.1l0.58%2C-0.13L430.01%2C141.15zM477.7%2C131.51l0%2C0.15l0.36%2C0.2l0.36%2C-0.05l0.06%2C0.46l-0.11%2C1.05l-1.76%2C1.48l-0.69%2C0.16l0.09%2C-0.6l0.24%2C-0.2l0.17%2C-0.61l-0.03%2C-0.86l0.57%2C-0.48l-0.16%2C-0.31l0.1%2C-0.14l0.64%2C-0.56l0.26%2C-0.14L477.7%2C131.51zM387.19%2C129.65l0.54%2C0.2l0.07%2C0.31l-0.06%2C0.51l-0.54%2C0.28l-0.39%2C-0.14l0%2C-0.44l-0.23%2C-0.22l0.15%2C-0.26L387.19%2C129.65zM388.65%2C124.58l0.23%2C0.05l0.11%2C1.52l0.31%2C0.51l-0.31%2C1.09l0.12%2C0.18l0.28%2C-0.13l0.21%2C0.23l-0.21%2C0.53l-0.82%2C0.31l-0.09%2C0.3l-0.32%2C0.18l-0.09%2C-0.37l-0.21%2C-0.08l0%2C-0.31l0.48%2C-0.7l-0.59%2C-0.27l0.11%2C-0.19l-0.3%2C-0.44l0.24%2C-0.5l0.62%2C-0.4l-0.11%2C-0.83l0.17%2C-0.59L388.65%2C124.58zM417.5%2C124.65l0.27%2C0.29l-0.03%2C1.41l0.38%2C1.22l-0.01%2C0.58l0.19%2C-0.08l0.2%2C-0.7l-0.17%2C-2.2l0.96%2C-0.54l0.19%2C0.01l0.25%2C0.36l0.01%2C0.3l0.32%2C0.11l0.06%2C0.42l-0.3%2C0.55l0.27%2C0.78l-0.48%2C0.53l0.31%2C0.55l0.34%2C0.22l0.01%2C0.76l0.17%2C0.16l0.14%2C-0.14l0.22%2C-0.8l-0.08%2C-0.38l0.37%2C0.25l0.64%2C-0.18l0.17%2C0.55l0.31%2C0.26l0.03%2C0.18l-0.48%2C0.59l-0.01%2C0.33l0.43%2C-0.36l0.4%2C0.01l0.46%2C-0.74l0.64%2C-0.12l-0.47%2C1.48l-0.47%2C0.46l-0.13%2C0.85l0.92%2C-0.98l0.19%2C0.52l0.46%2C0.37l0.38%2C0.89l-0.04%2C0.62l0.29%2C0.29l0.1%2C0.82l-0.01%2C0.39l-0.43%2C0.7l-0.4%2C-0.35l-0.49%2C0.19l-1.63%2C-0.62l-1.83%2C0.22l-1.44%2C-0.04l-0.92%2C-0.49l-1.21%2C-0.17l-0.21%2C-0.47l-0.5%2C-0.16l-0.43%2C0.33l-0.56%2C-0.07l-0.26%2C-0.18l-0.19%2C-0.69l-1.04%2C-0.13l-0.69%2C-0.44l-0.27%2C-0.57l-0.74%2C-0.12l-0.82%2C-0.38l-0.34%2C-1.17l-0.64%2C-0.65l-0.25%2C-1.06l0.15%2C-0.38l0.56%2C-0.5l0.47%2C-0.24l0.44%2C0.05l0.19%2C0.19l0.33%2C0.27l0.37%2C-0.16l0.05%2C0.68l0.31%2C0.29l0.09%2C0.61h0.21l0.08%2C-0.34l-0.42%2C-1.28l-0.52%2C-0.67l0.43%2C-0.55l0.92%2C-0.4l0.27%2C0.33l0.23%2C0.98l0.17%2C0.09l0.51%2C-0.51l-0.43%2C-0.81l0.15%2C-0.55l0.92%2C-0.14l-0.09%2C1.3l0.25%2C0.95l-0.05%2C-1.01l0.23%2C-1.23l0.58%2C-0.23l0.35%2C0.51l0.17%2C0.55l-0.02%2C0.82l0.26%2C0.43l0.1%2C-0.75l-0.17%2C-1.76L417.5%2C124.65zM395.97%2C125.96l0.59%2C0.53l0.16%2C0.35l0.34%2C0.09l0.18%2C0.25l0.17%2C0.48l-0.07%2C0.71l-0.62%2C1.49l-0.17%2C1.35l-0.45%2C1.16l-0.73%2C1.09l-0.52%2C0.2l-0.17%2C-0.86l-0.4%2C-0.58l-0.04%2C-0.99l0.49%2C-3.33l-0.08%2C-1.08l-0.26%2C-0.31l0.01%2C-0.27l0.58%2C-0.16l0.11%2C-0.68l-0.28%2C-0.59l0.17%2C-0.32l0.19%2C0.08l0.31%2C0.8L395.97%2C125.96zM507.68%2C120.79l0.35%2C0.33l-0.93%2C0.51l0.05%2C0.4l0.05%2C0.53l-0.11%2C0.19l-0.76%2C0.34l-0.11%2C-0.47l0.22%2C-0.84l0.37%2C-0.51l0.34%2C-0.26L507.68%2C120.79zM412.53%2C117.27l-0.2%2C0.14l-0.05%2C-0.14L412.53%2C117.27zM432.58%2C112.75l-0.41%2C-0.12l0.59%2C-0.19l-0.19%2C-0.38l0.38%2C-0.19l0.13%2C-0.32l0.63%2C-0.25l0.4%2C0.28l0.13%2C0.41L432.58%2C112.75zM435.74%2C108.78l-0.08%2C0.28l0.17%2C0.24l0.5%2C0.24l1.27%2C-0.66l-0.42%2C0.91l0.21%2C0.57l-0.09%2C0.35l0.24%2C0.3l0.51%2C-0.04l0.04%2C0.17l-0.25%2C0.3l0.31%2C0.23l-0.6%2C0.72l-0.04%2C1.05l-0.63%2C0.25l0.48%2C0.18l-0.17%2C0.79l-0.27%2C-0.11l-0.08%2C0.13l0.04%2C0.21l0.42%2C0.31l0%2C0.19l-0.38%2C-0.17l-0.11%2C0.69l0.29%2C0.56l0.41%2C0.23l0.74%2C0.07l0.73%2C0.56l0.28%2C1l-0.48%2C-0.37l-0.19%2C0.41l0.53%2C1.38l-0.01%2C1.06l0.16%2C0.56l-0.35%2C0.52l-0.81%2C0.53l-0.54%2C0.86l-0.5%2C0.09l-0.04%2C0.38l-0.54%2C0.79l-0.51%2C0.41l-0.32%2C-0.12l-0.58%2C0.18l-0.31%2C-0.33l-0.48%2C-0.18l0.33%2C0.74l0.81%2C0.38l-0.34%2C0.83l-0.47%2C0.31l-0.27%2C-0.17l-0.34%2C0.08l-0.03%2C0.17l0.3%2C0.34l-0.11%2C0.35l-0.5%2C0.35l-0.4%2C-0.14l-1.53%2C0.47l-0.69%2C0.27l0.01%2C0.24l1.07%2C0.14l0.4%2C0.54l0.18%2C0.71l-0.68%2C0.69l-0.99%2C0.65l-0.52%2C-0.2l0.02%2C0.46l-1.65%2C1.12l-0.91%2C0.09l-1.01%2C-0.48l-0.87%2C-0.74l-0.27%2C-0.5l-0.08%2C-0.75l0.02%2C-0.19l0.33%2C-0.16l-0.53%2C-0.88l0.39%2C-0.24l0.1%2C-0.94l0.82%2C-0.79l-0.1%2C-0.63l0.49%2C-0.76l0.13%2C-0.53l0.04%2C-1.8l-0.53%2C1.77l-0.7%2C1.48l-0.74%2C0.7l0.02%2C0.27l-0.63%2C0.85l-0.24%2C-0.3l-0.59%2C-0.29l0.21%2C-0.48l-0.32%2C-0.78l-0.13%2C0.27l0.11%2C0.68l-0.09%2C0.23l-0.26%2C0.08l-0.22%2C-0.05l-0.05%2C-0.4l-1.21%2C-0.98l-0.14%2C-0.18l0.01%2C-0.34l0.24%2C-0.36l0.03%2C-0.21l-0.15%2C-0.55l-1.07%2C-0.49l-0.56%2C-1.12l0.14%2C-0.34l0.13%2C-0.02l0.62%2C0.82l0.68%2C0.14l0.58%2C0.25l0.84%2C-0.26l-0.5%2C-0.51l-0.62%2C-0.15l-0.42%2C-0.32l-0.31%2C-0.66l0.09%2C-0.2l-0.18%2C-1.03l0.46%2C-0.71l0.58%2C-0.44l0.5%2C-0.05l0.04%2C0.38l0.12%2C0.02l0.15%2C-1.03l0.23%2C-0.4l0.18%2C-0.1l0.52%2C0.39l0.27%2C-0.07l-0.36%2C-0.45l-0.06%2C-0.47l0.36%2C-0.54l0.19%2C0.1l0.39%2C-0.66l0.34%2C-0.02l0.19%2C-0.31l1.05%2C-0.58l0.4%2C0.21l0.43%2C0.63l0.36%2C0.08l-0.04%2C0.31l0.2%2C0.06l-0.38%2C0.65l0.36%2C0.1l0.26%2C-0.66l-0.08%2C-0.63l0.24%2C-0.19l0.01%2C-0.5l1.51%2C0.08l-0.47%2C-0.32l-1.44%2C-0.3l-0.17%2C-0.52l-0.5%2C-0.26l0.12%2C-0.29l-0.13%2C-0.01l-0.04%2C-0.28l0.46%2C-0.41l0.51%2C0.03l-0.23%2C0.38l0.67%2C-0.28l0.72%2C0.28l-0.02%2C0.32l0.64%2C1.43l0.07%2C0.63l0.28%2C0.21l-0.25%2C1.88l-0.29%2C0.48l0.08%2C0.27l-0.25%2C0.14l0.05%2C0.31l0.26%2C-0.17l0.23%2C-0.1l0.54%2C-0.39v-0.84l0.22%2C-0.52l0.04%2C-1.3l1%2C-0.73l-0.07%2C-0.25l-0.2%2C-0.02l-0.93%2C0.42l0.12%2C-0.25l-0.1%2C-0.54l-0.67%2C-1.22l1.48%2C-0.11l0.73%2C1.03l0.68%2C-0.17l0.22%2C0.66l0.25%2C0.2l0.37%2C-0.1l0.12%2C-0.26l-0.2%2C-0.07l-0.48%2C-0.9l-0.41%2C-0.1l0.02%2C-0.34l1.49%2C-0.81l1.23%2C0.83l0.14%2C0.37l0.25%2C0.81l0.23%2C0.16l0.32%2C-0.23l0.03%2C-0.37l-0.31%2C-0.15l-0.26%2C-0.59l-1.01%2C-0.94l0.86%2C-0.61l-0.24%2C-0.17l0.22%2C-0.17l-0.32%2C0.06l-0.07%2C-0.35l-0.16%2C-0.07l-0.88%2C0.15l0.07%2C-0.42l-0.28%2C-0.57l0.67%2C-0.43l0.19%2C-0.71l-0.35%2C-0.1l-0.97%2C0.59l-0.27%2C0.01l-0.12%2C-0.15l0.19%2C-0.21l-0.87%2C-0.57l0.22%2C-0.4l0.57%2C-0.27l0.34%2C0.03l-0.19%2C0.13l1.07%2C0.06l0.65%2C-0.32l0.37%2C0.12L435.74%2C108.78zM490.28%2C103.46l0.16%2C0.26l0.33%2C0.08l0.07%2C0.31l-0.19%2C0.56l-1.06%2C1.26l-0.73%2C0.08l-0.34%2C-0.4l-0.16%2C-0.67l0.18%2C-1.09l1.04%2C-0.9l0.81%2C-0.32l0.1%2C0.23L490.28%2C103.46zM443.06%2C100.37l0.11%2C0.88l0.17%2C0.29l-0.17%2C0.38l-0.19%2C0.33l0.63%2C-0.02l0.05%2C-0.41l0.48%2C-0.01l-0.21%2C0.24l0.07%2C0.17l-1.28%2C0.95l-0.14%2C0.67l0.54%2C-0.23l0.25%2C-0.03l1%2C-1.01l0.79%2C0.2l0.33%2C0.25l0.35%2C-0.13l0.31%2C-0.03l0%2C0.42l0.25%2C-0.17l0.21%2C0.22l0.74%2C0.09l-0.02%2C0.65l0.27%2C0.15l0.56%2C-0.21l0.74%2C0.9l0.03%2C0.37l0.54%2C0.94l0.06%2C0.54l-0.56%2C0.3l-0.07%2C0.21l0.87%2C-0.13l0.31%2C0.52l-0.25%2C0.77l0.67%2C0.06l-0.03%2C0.4l-0.38%2C0.35l0.59%2C0.08l0.15%2C0.28l-0.29%2C1.17l-0.53%2C0.76l-1.91%2C1.86l-0.49%2C0.99l0.21%2C0.49l-0.11%2C0.57l-0.59%2C0.65l-1.85%2C0.87l-1.52%2C-0.25l-1.25%2C0.01l-1.04%2C-1.16l0.12%2C-0.42l-0.39%2C-0.45l0.18%2C-0.31l-0.3%2C-0.37l-0.04%2C-0.38l-0.34%2C-0.34l-0.49%2C-0.1l0.32%2C-0.17l0.05%2C-0.39l-0.52%2C-1.87l-0.24%2C-0.2l-0.33%2C-0.12l0.13%2C-0.69l-0.82%2C0.65l-0.46%2C-0.01l0.16%2C-0.3l0.66%2C-0.49l0.32%2C-0.57l0.24%2C-0.1l-0.07%2C-0.39l0.21%2C-0.43l0.09%2C-0.34l0.08%2C-0.42l-0.65%2C-0.01l-0.17%2C0.35l-0.41%2C0.04l0.48%2C-0.76l0.5%2C-0.25l0.54%2C-0.55l0.26%2C-0.12l-0.03%2C-0.22l-0.29%2C-0.13l-0.58%2C0.2l-0.16%2C-0.34l-0.25%2C-0.32l-0.26%2C-0.9l-0.1%2C-0.61l0.01%2C-0.32l0.1%2C-0.47l0.29%2C-0.84l0.48%2C-0.36l0.07%2C-1.03l0.21%2C-0.39l0.25%2C-0.03l0.85%2C-0.02L443.06%2C100.37zM423.77%2C100.02l-0.18%2C0.02l-0.13%2C0.36l-0.29%2C0.06l-0.14%2C-0.13l0.12%2C-1.24l0.37%2C-0.31l0.34%2C0.41l-0.2%2C0.58L423.77%2C100.02zM521.02%2C97.98l-0.08%2C0.13l-0.54%2C-0.08l-0.33%2C-0.4l0.25%2C-0.83l0.52%2C-0.58l0.34%2C0.16l0.11%2C0.68L521.02%2C97.98zM424.49%2C93.35l0.47%2C-0.04l0.33%2C0.37l0.17%2C-0.37l0.54%2C0.11l0.26%2C0.29l-0.04%2C0.59l-0.35%2C0.15l-1.31%2C-0.23l-0.41%2C-0.66l0.15%2C-0.29L424.49%2C93.35zM432.66%2C93.05l0.78%2C0.29l-0.05%2C0.51L433.11%2C94l0.21%2C0.57l1.45%2C-0.2l-0.32%2C0.72l0.94%2C0.36l0%2C0.22l-0.97%2C0.08l0.44%2C0.11l0.53%2C0.55l0.76%2C0.29l-0.2%2C0.41l0.28%2C0.39l-0.07%2C0.49l-0.35%2C0.06l-1.56%2C-0.53l-0.2%2C-0.45l-0.66%2C0.64l-0.23%2C-0.16l0.22%2C0.42l1.51%2C0.53l0.25%2C0.26l0.02%2C0.33l-0.19%2C0.23h-0.3l-0.85%2C-0.39l0.04%2C1.86l-0.27%2C0.37l-0.47%2C0.09l-0.2%2C0.41l-0.38%2C-1.01l-0.62%2C-0.67l0.02%2C0.48l-0.2%2C0.09l0.37%2C0.65l-0.12%2C0.83l0.31%2C0.66l-0.16%2C0.32l-0.46%2C0.09l-0.52%2C-0.72l-0.22%2C0.19l0.08%2C0.93l-0.86%2C-0.01l0.12%2C0.3l0.66%2C0.56l-0.05%2C0.44l-0.25%2C0.25l-0.45%2C0.19l-0.44%2C-0.6l-0.18%2C0.61l-0.2%2C-0.01l-0.57%2C-0.57l-0.27%2C-0.78l-0.17%2C-0.09l0.03%2C-0.26l-0.2%2C-0.01l0.06%2C1.07l-0.14%2C0.22l-0.3%2C-0.03l-0.04%2C0.29l0.14%2C0.25l0.42%2C-0.1l0.14%2C0.17l-0.42%2C0.55l-0.48%2C0.3l0.06%2C0.19l0.23%2C0.05l0.57%2C-0.16l0.53%2C0.1l-0.32%2C0.12l-0.49%2C1.02l-0.15%2C0.94l-0.35%2C-0.2l-1.09%2C0.27l-0.35%2C-0.23l-0.44%2C0.16l0.06%2C0.21l0.5%2C-0.06l0.25%2C0.53l0.27%2C-0.16l0.47%2C0.03l-0.15%2C0.84l-0.35%2C0.03l0.03%2C0.79l-0.18%2C0.18l0%2C0.34l-0.3%2C0.26l0.02%2C0.36l-0.19%2C0.09l0.12%2C0.08l-0.28%2C0.15l0.08%2C0.28l-0.33%2C0.1l0.08%2C-0.13l-0.48%2C-0.77l0.14%2C-0.12l-0.32%2C-0.67l-0.86%2C-0.39l-0.23%2C0.34l0.22%2C0.18l0.27%2C-0.15l0.4%2C0.38l-0.27%2C0.06l0.26%2C1.17l-0.05%2C0.48l-0.3%2C0.36l-0.18%2C0.03l-0.72%2C-0.54l-0.98%2C-0.16l0.2%2C-0.46l-0.08%2C-0.2l-0.25%2C0.03l-0.29%2C0.41l-0.29%2C-0.23l-0.11%2C0.07l0.16%2C0.35l-0.22%2C0.34l0.23%2C0.29l0.76%2C0.08l0.23%2C0.3l0.14%2C0.8l-0.17%2C0.28l0.1%2C0.28l-0.17%2C0.05l0.1%2C0.22l-0.63%2C0.02l-1.02%2C0.57l0.05%2C-0.21l-0.23%2C-0.06l0.02%2C-0.4l-0.14%2C-0.13l-0.29%2C0.54l0.08%2C0.49l-0.47%2C0.25l-0.11%2C-0.16l-0.31%2C0.22l0.74%2C-1.31l0.12%2C-0.57l-0.39%2C0.43l-0.31%2C0.91l-0.4%2C-0.12l-0.46%2C0.66l-0.55%2C0.25l-0.06%2C-0.32l0.31%2C-1.09l-0.06%2C-0.43l0.31%2C-0.56l-0.15%2C-0.04l-0.25%2C0.32l-0.01%2C-0.16l-0.15%2C0.08l-0.25%2C-0.39l0.13%2C-0.32l-0.28%2C-0.01l-0.3%2C0.48l0.17%2C0.36l-0.14%2C1.84l-0.22%2C0.69l-0.28%2C-0.08l-0.24%2C-1.02l0.22%2C-0.32l-0.01%2C-0.4l-0.21%2C0.02l0.01%2C-0.31l0.17%2C-0.13l0.09%2C-0.78l0.35%2C-0.33l0.14%2C-0.41l-0.97%2C0.74l-0.46%2C-0.73l-0.37%2C0.19l0.13%2C0.85l-0.16%2C-0.01l-0.44%2C-0.67h-0.27l0.16%2C0.34l-0.06%2C0.98l0.21%2C0.24l0.07%2C1.09l-0.14%2C0.39l-0.21%2C0.03l-0.31%2C-1.01l-0.18%2C-0.11l-0.05%2C1.14l-0.47%2C0.87l-0.39%2C-0.12l-0.02%2C-0.38l-0.33%2C-0.15l-0.09%2C-0.41l-0.08%2C0.45l0.2%2C0.21l-0.1%2C0.16l-0.33%2C-0.01l-0.58%2C-1.86l-0.24%2C0.2l-0.13%2C-0.61l-0.43%2C1.31l0%2C0.72l0.09%2C0.29l0.16%2C0.01l-0.12%2C0.38l-0.99%2C0.28l-0.46%2C-0.29l0.23%2C-0.52l-0.08%2C-0.54l0.22%2C-1.02l-0.19%2C0.52l-0.26%2C-0.23l-0.29%2C0.5l0.09%2C0.26l-0.18%2C-0.15l-0.47%2C0.17l-0.02%2C0.34l0.25%2C0.2l-0.13%2C-0.03l-0.39%2C0.7l-0.28%2C-0.03l-0.21%2C0.17l-0.33%2C-0.37l-0.14%2C0.12l0%2C-0.3l-0.27%2C-0.17l0.15%2C-1.82l0.21%2C-0.32l-0.39%2C-0.15l0.32%2C-0.71l-0.83%2C1l0.03%2C0.29l-0.54%2C0.51l0%2C1.62l0.18%2C0.19l-0.16%2C0.32l-0.47%2C0.2l-0.29%2C-0.32l-0.43%2C0.16l-0.7%2C-0.16l0.23%2C0.7l-0.2%2C0.3l-0.8%2C-0.22l-0.44%2C-0.47l-0.42%2C0.3l-0.17%2C-0.41l0.15%2C-0.14l0.98%2C-0.27l-0.04%2C-0.24l-0.2%2C-0.08l0.22%2C-0.12l-0.25%2C-0.05l0.02%2C-0.15l0.58%2C-0.47l-0.69%2C-0.23l0.13%2C-0.36l0.22%2C-0.04l-0.08%2C-0.35l0.21%2C-0.06l0.04%2C-0.4l0.55%2C-0.21l0.42%2C-0.74l1.13%2C-0.36l0.39%2C-0.65l0.3%2C-0.2l0.05%2C-0.5l-0.61%2C-0.33l-0.36%2C0.03l-0.24%2C0.26l0.05%2C-0.71l1.01%2C-0.66l0.06%2C-0.18l0.96%2C-0.35l0.27%2C-0.75l-0.22%2C-0.3l-0.64%2C0.24l-0.99%2C-0.5l-0.64%2C0.07l-0.64%2C0.31l0.04%2C-0.37l-0.87%2C0.77l-0.61%2C0.11l-0.3%2C1.26l-0.24%2C-0.06l-0.11%2C-0.73l-0.53%2C-0.05l-0.22%2C-0.32l-0.4%2C1.13l-0.52%2C-0.09l-0.19%2C-0.43l-0.43%2C-0.15l0.28%2C-0.3l-0.3%2C-0.79l0.24%2C-0.27l0.45%2C0.12l-0.23%2C-0.26l0.04%2C-0.21l0.45%2C0.17l0.38%2C-0.23l0.11%2C-0.83l-0.17%2C-0.26l-0.2%2C0.06l-0.45%2C-0.23l-0.85%2C0.53l0.16%2C-0.48l-0.39%2C-0.3l-0.35%2C0.06l-0.44%2C-0.39l0.34%2C-0.17l0.26%2C-0.42l-0.33%2C-0.34l0.62%2C-0.52l-0.09%2C-0.26l0.4%2C-0.08l0.28%2C0.91l0.15%2C-0.08l-0.17%2C0.32l0.11%2C0.13l0.19%2C-0.19l0.22%2C0.14l0.4%2C-0.18l0.37%2C0.2l0.18%2C-0.12l0.2%2C0.16l0.16%2C-0.08l0.18%2C0.32l0.87%2C-0.19l0.28%2C0.31l-0.2%2C0.7l0.59%2C0.24l0.8%2C-0.83l1.11%2C0.38l0.23%2C-0.31l-0.29%2C-0.87l0.16%2C-0.36l-0.09%2C-0.38l-0.43%2C-0.08l-0.4%2C-0.56l0.36%2C-0.28l0.94%2C0.44l-0.17%2C0.39l0.93%2C0.82l0.05%2C0.22l1.46%2C0.98l0.32%2C0.56l0.27%2C-0.15l0.36%2C0.39l0.27%2C-0.22l-0.29%2C-0.39l0.05%2C-0.69l-0.39%2C-0.38l-0.17%2C-0.6l0.39%2C-0.55l-1.02%2C-1.01l0.3%2C-0.46l0.05%2C-0.92l0.44%2C-0.63l0.23%2C-0.1l-0.31%2C-0.21l-0.02%2C-0.33l0.67%2C0.14l-0.13%2C0.49l0.46%2C0.98l-0.18%2C0.39l0.22%2C-0.01l0.02%2C-0.25l0.5%2C0.28l0.12%2C0.24l-0.38%2C0.08l0.5%2C0.76l0.52%2C0.13l0.09%2C0.36l0.02%2C-0.38l0.52%2C-0.02l-0.1%2C-0.21l0.31%2C0.1l-0.04%2C-0.17l0.17%2C-0.04l-0.7%2C-0.28l0.1%2C-0.37l-0.14%2C-0.38l-0.25%2C-0.03l-0.14%2C-0.32l0.36%2C0.06l0.84%2C-0.6l-0.12%2C-0.85l0.52%2C-0.1l0.21%2C0.17l0.11%2C0.49l0.42%2C0.29l0.2%2C0.44l0.23%2C0.09l0.3%2C-0.43l0.38%2C0.14l0.03%2C0.25l-0.33%2C0.26l0.14%2C0.19l-0.09%2C0.22l0.15%2C0.09l0.37%2C-0.35l0.4%2C0.13l-0.3%2C0.69l0.46%2C-0.27l0.17%2C0.13l-0.22%2C0.08l0.02%2C0.21l-0.2%2C0.17l0.25%2C0.12l-1.51%2C0.29l0.52%2C0.1l-0.84%2C0.22l0.09%2C0.24l-0.58%2C0.48l0.4%2C0.33l-0.04%2C1.29l0.58%2C-0.44l0.73%2C-0.12l0.29%2C-0.47l-0.17%2C-0.08l0.04%2C-0.33l0.36%2C0.2l-0.19%2C0.3l0.97%2C-0.85l0.24%2C1.14l0.03%2C1.23l0.33%2C0.48l-0.01%2C0.39l0.14%2C0.01l0.16%2C-0.17l-0.21%2C-0.29l0.21%2C-0.11l0.17%2C-0.64l-0.33%2C0.03l-0.22%2C-0.46l0.25%2C-0.14l0.11%2C0.1l0.43%2C-0.48l0.09%2C-0.61l0.37%2C-0.17l0.31%2C0.57l0.54%2C-0.23l0.37%2C0.13l0.57%2C-0.43l-0.06%2C-0.19l-0.72%2C-0.12l-0.77%2C-1.55l-0.55%2C-0.35l0.77%2C-0.38l0.03%2C-0.22l-0.28%2C-0.11l-0.01%2C-0.28l0.49%2C-0.33l-1.28%2C0.17l0.52%2C-0.49l-0.45%2C-0.16l-0.07%2C-0.54l0.41%2C-0.74l-0.68%2C0.69l-0.35%2C-0.17l-0.35%2C-0.4l-0.18%2C-0.93l0.26%2C-0.62l0.3%2C0.15l-0.01%2C-0.3l0.19%2C-0.23l0.57%2C-0.03l0.51%2C-0.68l0.3%2C-0.01l0.47%2C-0.3l0.31%2C0.06l0.08%2C0.51l-0.63%2C1.17l0.33%2C-0.01l0.14%2C0.49l0.18%2C0.04l0.25%2C-0.85l0.17%2C-0.03l0.29%2C0.15l0.32%2C0.52l0.34%2C0.15l-0.02%2C0.29l-0.5%2C0.43l-0.11%2C0.4l0.22%2C0.13l0.44%2C-0.42l0.13%2C0.32l0.71%2C-0.35l0.75%2C0.04l-0.14%2C1.3l-0.49%2C0.3l0.14%2C0.22l-0.85%2C0.65l0.06%2C0.28l1.15%2C-0.19l0.2%2C0.29l0.04%2C0.61l0.16%2C0.01l-0.17%2C0.5l0.34%2C0.34l0.88%2C-0.19l0.35%2C0.87l-0.31%2C-0.91l0.06%2C-0.85l-0.34%2C-0.2l-0.05%2C-0.32l0.2%2C-0.17l0.09%2C0.37l0.27%2C-0.26l-0.14%2C-0.18l0.09%2C-0.13l0.32%2C0.2l0.75%2C0.11l0%2C-0.24l-0.64%2C-0.38l0.29%2C-0.21l0.15%2C-0.56l-0.27%2C-0.65l0.25%2C-0.5l0.74%2C-0.09l0.28%2C0.5l0.2%2C-0.01l0.19%2C0.22l-0.14%2C0.35l0.79%2C0.22l0.08%2C-0.23l-0.45%2C-0.06l-0.51%2C-0.85l0.48%2C-1.15l0.23%2C-0.11l0.31%2C0.38l0.29%2C-0.11l0.33%2C0.34l0.41%2C-0.09l-0.25%2C-0.61l-0.71%2C0.18l-0.15%2C-0.54l-0.65%2C-0.22l-0.09%2C-0.5l0.36%2C-0.06l0.12%2C0.16l0.16%2C-0.13l-0.04%2C-0.28l-0.28%2C-0.14l-0.37%2C0.19l-0.4%2C-0.08l-0.04%2C-0.4l-0.75%2C-0.6l-0.14%2C-0.38l-0.49%2C-0.13l-0.15%2C-0.21l0.25%2C-0.52l0.65%2C-0.53l0.87%2C0.84l0.28%2C-0.1l-0.14%2C-0.25l-0.28%2C-0.1l-0.01%2C-0.58l-0.24%2C-0.22l-0.46%2C-0.08l-0.05%2C-0.16l0.45%2C-0.39l1.27%2C0.73l0.56%2C0.5l0.97%2C1.33l-0.12%2C-0.55l0.27%2C-0.26l-0.77%2C-1.79l0.15%2C-0.46l0.21%2C-0.11l0.88%2C1.37l0.31%2C1.28l0.41%2C-0.04l0.96%2C1.52l0.18%2C0.04l-0.42%2C-1.48l0.35%2C-0.05l0.4%2C0.32l0.34%2C-0.3l-0.16%2C-0.45l-0.55%2C-0.3l0.1%2C-0.8l0.27%2C0.13l0.02%2C-0.42l-0.28%2C-0.4l0.05%2C-0.27l-0.34%2C-0.3l0.35%2C-0.45l-0.18%2C-0.5l0.34%2C-1.14l-0.06%2C-0.68l0.18%2C0.55l0.46%2C0.39L432.66%2C93.05zM454.63%2C90.72l-0.71%2C0.85l-1.28%2C1.03l-0.5%2C0.29l-0.29%2C-0.01l-0.05%2C-0.53l0.14%2C-0.16l0.83%2C-0.52l1.81%2C-1.09L454.63%2C90.72zM462.43%2C81.93l0.56%2C0.48l0.66%2C-0.08l-0.08%2C0.25l-0.14%2C0.29l-1.67%2C0.04l-1.17%2C-0.9l-0.22%2C0.05l-0.33%2C-0.2l0.35%2C-0.77l0.16%2C-0.04l0.42%2C0.06l0.46%2C0.38l0.7%2C0.18L462.43%2C81.93zM448.99%2C80.61l0.13%2C0.51l-0.62%2C0.7l0.12%2C0.23l0.52%2C0.26l0.28%2C-0.22l0.63%2C-0.01l1.07%2C0.2l0.22%2C0.05h0.36l0.97%2C0.33l-0.37%2C0.24l-0.68%2C0.02l-0.76%2C-0.17l-0.53%2C-0.01l-0.29%2C0.24l-0.22%2C0.08l-0.91%2C0.11l0.38%2C0.77l-0.36%2C0.16l-0.28%2C0.42l0.03%2C0.52l0.52%2C-0.06l0.05%2C-0.3l0.73%2C-0.2l0.93%2C-0.05l0.4%2C0.11l0.93%2C0.18l0.69%2C0.58l-0.32%2C0.22l-0.5%2C0.04l-0.28%2C0.3l0.86%2C0.17l-0.15%2C0.33l-0.47%2C0.28l-1.33%2C0.11l0.63%2C0.32l-0.31%2C0.15l-0.12%2C0.32l-1.18%2C-0.52l-0.34%2C0.41l0.25%2C0.1l-0.34%2C0.51l0.14%2C0.29l-1.6%2C0.14l-0.62%2C-0.4l0.04%2C-0.48l-0.85%2C0.14l-0.1%2C-0.42l-0.46%2C-0.21l0.99%2C-0.5l-0.07%2C-0.26l-0.43%2C0.13l0.01%2C-0.5l-0.46%2C0.15l-0.96%2C-0.32l0.1%2C-0.51l0.76%2C-0.62l-0.05%2C-0.27l0.34%2C-0.37l0.85%2C-0.25l0.86%2C0.14l0.05%2C-0.33l-0.22%2C-0.06l-1.05%2C-0.14l-1.7%2C0.28l0.04%2C-0.53l-0.72%2C-0.06l-0.3%2C-0.34l0.62%2C-0.23l0.91%2C0.13l0.47%2C-0.06l0.16%2C-0.16l-0.15%2C-0.25l-0.55%2C-0.01l-0.41%2C0.11l0.21%2C-0.44l0.77%2C-0.01l0.33%2C-0.16l-0.32%2C-0.52l-0.74%2C-0.04l-0.09%2C-0.27l0.29%2C-0.31l1.94%2C-0.55l0.2%2C0.46l-0.09%2C0.13l0.39%2C0.34l0.24%2C-0.16l-0.23%2C-0.53l0.31%2C-0.26l0.62%2C0.26L448.99%2C80.61zM470.04%2C79.12l-0.01%2C0.34l0.41%2C0.18l0.03%2C0.59l0.49%2C-0.1l0.22%2C-0.32l0.45%2C-0.17l0.22%2C0.3l-0.25%2C0.29l0.01%2C0.4L471.38%2C81l-0.34%2C0.25l-0.12%2C0.4l-0.18%2C0.47l0.28%2C0.2l-0.89%2C0.46l-0.27%2C-0.04l-0.34%2C-0.35l0.91%2C-0.34l-0.03%2C-0.15l-0.69%2C-0.06l-0.46%2C-0.9l-0.38%2C-0.24l0.25%2C-0.15l0.08%2C-0.82l0.3%2C-0.6l0.46%2C-0.16L470.04%2C79.12zM448.85%2C76.39l0.5%2C0.93l0.34%2C-0.11l0.05%2C-0.35l0.42%2C-0.21l0.32%2C-0.25l0.24%2C0.06l0.2%2C0.25l-0.06%2C0.33l0.07%2C0.18l-0.97%2C0.74l-0.23%2C-0.01l-0.45%2C0.35l0.13%2C0.57l0.44%2C-0.08l0.02%2C0.18l-0.95%2C0.56l-0.46%2C-0.05l-0.26%2C-0.23l-0.84%2C0.19l-0.58%2C0.01l-0.14%2C-0.44l-0.29%2C-0.16l0.12%2C-0.88l-0.22%2C-0.47l0.38%2C-0.31l0.55%2C0.34l0.25%2C-0.01l0.21%2C0.94l0.32%2C0.35l0.22%2C-0.06l-0.31%2C-0.67l0.73%2C0.11l-0.11%2C-0.64l-0.75%2C-0.58l0.1%2C-0.41l0.32%2C0.23l0.39%2C-0.43L448.85%2C76.39zM464.49%2C74.57l0.55%2C0.28l0.1%2C0.6l0.42%2C0.05l0.32%2C-0.08l0.54%2C-0.01l0.34%2C-0.3l0.43%2C0.14l-0.63%2C0.7l-0.14%2C0.42l-0.23%2C-0.01l-0.15%2C0.22l0.82%2C0.49l-0.82%2C-0.01l-0.86%2C0.81l0.42%2C0.42l0.3%2C0.54l-0.56%2C0.78l0.14%2C0.26l-0.03%2C0.52l-0.26%2C0.19l-0.77%2C-0.12l-0.33%2C-0.15l-0.2%2C-0.48l-0.55%2C-0.28l-0.45%2C-0.31l-1.2%2C-0.63l-0.17%2C-0.76l0.97%2C-1.13l0.07%2C-0.59l0.33%2C-0.13l1.04%2C0.58l-0.14%2C0.29l0.22%2C0.35l0.42%2C0.45l0.2%2C-0.3l0.11%2C-0.34l0.16%2C-0.53l-1.26%2C-1.1l-0.07%2C-0.65l0.67%2C-0.38L464.49%2C74.57zM532.28%2C74.1l0.73%2C0.42l0.43%2C-0.18l0.31%2C0.29l-0.32%2C0.99L533%2C76.21l-0.07%2C0.75l-0.72%2C0.95l-0.04%2C0.28l0.42%2C-0.01l0.53%2C-0.3l-0.01%2C0.64l-0.28%2C0.42l0.26%2C0.13l0.48%2C-0.12l0.23%2C-0.11l0.79%2C-1.11v-0.36l0.34%2C0.04l0.29%2C0.86l-0.18%2C0.35l-0.25%2C0.26l0.26%2C0.34l-0.01%2C0.47l0.38%2C0.71l0.29%2C-0.02l0.24%2C-0.37v-0.32l-0.27%2C-0.35l0.41%2C0.01l0.06%2C-0.51h0.31l-0.06%2C1.11l0.2%2C0.04l0.34%2C-0.3l0%2C-0.37l0.98%2C-1.07l-0.28%2C-0.16l0.02%2C-0.19l0.23%2C-0.02l0.38%2C-0.49l0.29%2C-0.79l0.27%2C-0.13l0.12%2C0.25l-0.43%2C1.33l0.17%2C0.39l0.26%2C0.14l0.3%2C-0.55l0.55%2C-1.2l0.54%2C-0.4l0.13%2C-0.29l0.29%2C-0.08l0.21%2C0.13l0.03%2C2.07l-0.17%2C0.1l-0.01%2C0.56l0.18%2C0.14l0.25%2C-0.11l1.23%2C-2.23l0.06%2C-0.4l0.25%2C-0.34l0.25%2C-0.19l0.4%2C-0.18l0.25%2C-0.13l0.33%2C0.32l0.98%2C0.29l0.25%2C0.63l-0.07%2C0.47l0.42%2C0.3l-0.06%2C0.34l-0.14%2C1.22l-0.07%2C0.16l-0.53%2C0.34l-0.64%2C0.38l-0.83%2C-0.02l0.37%2C0.3l0.52%2C0.04l0.13%2C0.37l-0.26%2C0.16l-0.17%2C1.14l-0.07%2C0.36l0.34%2C-0.04l0.32%2C-0.61l0.14%2C0.5l-0.2%2C1.09l-0.64%2C1.44l-0.02%2C0.6h0.32l0.55%2C-0.5l0.05%2C-0.54l0.27%2C-0.32l0.89%2C-0.44l0.28%2C-0.41l0.1%2C-0.66l0.37%2C-0.3l0.73%2C0.2l0.52%2C-0.15l1.19%2C0.18l0.79%2C0.21l1.67%2C0.61l0.08%2C0.51l0.29%2C0.66l0.16%2C0.46l-0.17%2C0.77l-0.16%2C0.58l-0.25%2C0.77l-0.13%2C0.87l-0.15%2C0.68l-0.43%2C0.46l-0.11%2C0.42l-0.29%2C0.76l-1.06%2C0.43l-0.36%2C-0.03l-0.83%2C-0.52l-0.81%2C0.18l0.3%2C0.41l2.39%2C0.58l-0.05%2C0.2l-0.69%2C1l-0.49%2C0.52l-0.5%2C0.08l-0.93%2C-0.34l-0.25%2C0.08l0.37%2C0.59l0.56%2C0.26l0.04%2C0.24l-0.48%2C0.83l-0.44%2C0.08l-0.93%2C-0.51L545%2C93.35l-0.38%2C-0.01l-0.25%2C0.19l-0.04%2C0.19l0.19%2C0.19l0.55%2C0.01l0.41%2C0.57l1.17%2C0.9l-0.03%2C0.2l-0.37%2C0.31l-0.68%2C0.29l-0.49%2C0.82l-0.92%2C0.13l-0.24%2C-0.08l-0.12%2C-0.29l-0.88%2C0.08l-0.99%2C-0.06l-0.32%2C-0.33l0.41%2C-0.19l-0.23%2C-0.31l-0.6%2C0.46l0.07%2C0.66l-0.27%2C-0.27l-0.89%2C-0.2l-0.31%2C-0.4l-0.27%2C-1l-0.87%2C0.4l-0.12%2C0.82l-0.61%2C0.45l-1.42%2C-0.66l-0.22%2C0.5l-1.04%2C-0.17l-0.52%2C0.27l-0.67%2C-0.53l-0.57%2C0.29l0.61%2C0.5l1.18%2C0.28l0.39%2C0.33l-0.56%2C0.94l-0.73%2C0.33l-0.16%2C0.64l-0.3%2C0.28l0.14%2C0.19l0.34%2C-0.03l0.38%2C-0.55l0.5%2C-0.41l0.38%2C-0.03l0.87%2C-0.79l0.98%2C-0.13l1.43%2C0.61l1.08%2C0.1l-0.12%2C0.84l-0.54%2C0.49l0.01%2C0.19l0.47%2C-0.1l0.56%2C-0.77l0.58%2C-0.25l1.4%2C0.81l0.33%2C0.51l-0.69%2C1.18l-0.66%2C0.7l-0.36%2C0.48l-1.12%2C0.88l-0.68%2C0.46l-1.2%2C0.34l-1.91%2C1.07l0.25%2C0.28h0.43l0.1%2C0.38l-0.13%2C0.18l-0.98%2C0.48l-0.82%2C0.75l-1.05%2C0.09l-0.55%2C0.5l-0.84%2C0.12l-0.71%2C0.39l0.34%2C0.47l1.47%2C-0.16l0.9%2C-0.47l1.35%2C-0.28l1.51%2C-0.64l3.19%2C-2.02l1.78%2C-0.85l0.79%2C-0.63l0.87%2C-1.21l1.21%2C-0.9l0.57%2C-0.21l0.32%2C0.12l0.42%2C1.94l-0.06%2C1.08l-0.16%2C0.82l-0.59%2C2.19l-0.49%2C0.91l-0.9%2C1.51l-2.95%2C2.85l-1.35%2C0.97l-1.43%2C1.01l-0.72%2C0.79l-0.69%2C0.61l-0.24%2C0.46l-0.67%2C0.19l-0.88%2C0.67l0.28%2C0.47l0.56%2C-0.31l-0.61%2C2.72h0.38l0.29%2C0.21l0.04%2C0.63l0.18%2C0.28l0.18%2C-0.13l-0.09%2C-1.86l0.41%2C-1.47l0.82%2C-0.82l0.51%2C-0.62l1.13%2C-0.5l-0.2%2C0.53l-0.65%2C0.43l-0.64%2C0.77l-0.44%2C1.5l0.14%2C0.03l1.41%2C-2.37l0.36%2C0.51l0.62%2C-0.19l0.99%2C-0.54l0.64%2C-0.03l1.31%2C-0.88l0.42%2C-0.09l0.61%2C0.21l0%2C0.54l-0.19%2C0.39l-0.91%2C0.44l-0.53%2C-0.01l-0.24%2C0.6l-1.7%2C1.95l-0.11%2C0.47l0.2%2C0.43l0.42%2C-0.45l1.2%2C-1.76l0.93%2C-0.65l1.07%2C-0.45l0.9%2C-1.1l0.27%2C-0.32l0.8%2C-0.17l0.09%2C0.47l0.15%2C0.08l0.81%2C-0.41l0.52%2C-0.56l0.38%2C0.32l-0.07%2C0.78l-0.43%2C0.73l-1.07%2C1.17l0.01%2C0.64l-0.88%2C1.26l-0.33%2C1.19l0.57%2C0.19l0.92%2C-0.95l0.37%2C-0.69l0.02%2C-1.27l0.26%2C-0.52l0.48%2C-0.56l1.17%2C-0.59l0.96%2C0.4l-0.24%2C1.55l0.58%2C0.75l0.71%2C0.31l0.01%2C-0.86l-0.48%2C-0.69l0.45%2C-0.71l0.08%2C-0.76l0.84%2C-0.55l0.06%2C-0.64l-1.03%2C0.35l-0.88%2C-0.27l-0.51%2C-0.95l-1.1%2C-1.38l0.45%2C-1.79l0.25%2C-0.61l0.45%2C-0.86l0.54%2C-0.49l0.17%2C-0.86l0.18%2C-1.76l0.5%2C-1.42l0.1%2C-1.42l-0.17%2C-0.6l0.51%2C-0.06l1.31%2C0.51l0.81%2C0.26l0.29%2C-0.39l-0.34%2C-0.27l-0.77%2C-0.21l-0.68%2C-0.75l-0.76%2C-1.76l0.08%2C-0.62l1.59%2C-2.37l1.73%2C-0.91l-0.23%2C-1.09l0.4%2C-1.17l0.41%2C-0.36l0.74%2C-1.31l0.13%2C-0.55l0.34%2C-0.42l0.24%2C-0.34l1.12%2C-0.96l0.69%2C-0.67l0.61%2C-0.09l0.73%2C-0.17l1.57%2C-0.18l0.46%2C0.34l0.5%2C0.36l0.29%2C0.11l0.85%2C-0.16l0.82%2C0.17l1.1%2C1.47l0.73%2C0.06l0.84%2C-0.34l0.69%2C0.41l0.87%2C1.68l-0.3%2C0.47l0.4%2C0.8l-0.39%2C0.55l0.57%2C0.5l0.65%2C0.01l1.55%2C0.5l0.49%2C-0.01l-0.49%2C0.39l-0.31%2C0.84l-0.02%2C0.27l-1%2C0.84l-1.11%2C0.87l-0.02%2C0.74l1.05%2C-0.52l0.12%2C0.31l0.53%2C0.35l0.35%2C-0.5l0.44%2C0.17l0.69%2C-0.2l0.3%2C0.08l-1.09%2C0.6l-0.54%2C0.12l-0.68%2C0.38l-0.53%2C-0.03l-0.33%2C0.44l0.14%2C0.32l0.59%2C0.42l0.88%2C-0.28l0.5%2C0.31l-0.43%2C0.13l-0.94%2C0.94l-1.65%2C0.86l-0.05%2C0.22l0.31%2C0.15l0.21%2C-0.22l0.55%2C0.2l0.1%2C0.21l-0.3%2C0.22l-0.58%2C0.08l-0.31%2C0.3l0.63%2C0.14l0.12%2C-0.24l1.08%2C-0.21l0.14%2C-0.13l-0.11%2C-0.78l0.35%2C-0.1l0.05%2C-0.51l1.03%2C-0.67l0.3%2C-0.03l0.48%2C0.08l0.7%2C-0.91l1.49%2C0.18l0.54%2C-0.3l0.67%2C-0.11l1.73%2C-0.94l0.66%2C-0.64l0.75%2C-0.4l0.46%2C0.02l1.29%2C0.29l0.46%2C0.34l-0.19%2C0.63l0.11%2C0.87l-0.12%2C0.42l0.43%2C0.38l-0.02%2C0.24l-0.13%2C0.39l-0.31%2C0.41l0.07%2C0.6l-0.08%2C0.94l-1.05%2C0.87l-0.67%2C0.96l-0.55%2C0.34l-0.05%2C0.53l0.14%2C0.05l0.64%2C-0.22l0.67%2C-0.57l0.95%2C-0.14l0.72%2C-0.57l0.55%2C-1.16l0.74%2C-0.96l0.45%2C-1.11l0.46%2C-0.03l0.25%2C-0.42l0.2%2C-0.89l0.68%2C-0.23l1.25%2C-0.18l1.35%2C0.24l0.93%2C0.84l1.13%2C0.53l0.33%2C0.35l0.54%2C0.51l-0.24%2C0.49l-1.03%2C0.64l-0.43%2C0.03l-0.87%2C0.66l-0.03%2C0.35l0.26%2C0.06l1.01%2C-0.39l0.9%2C0.1l0.63%2C0.46l0.49%2C0.06l0.45%2C0.77l1.83%2C1.22l-0.48%2C0.83l0.03%2C0.66l-0.72%2C0.81l-0.62%2C0.42l-0.85%2C0.06l-0.24%2C0.56l0.15%2C0.32l-0.25%2C0.27l-1.43%2C0.36l-1.09%2C-0.12l-0.54%2C0.1l0.1%2C0.54l1.29%2C0.45l-0.01%2C0.23l-0.71%2C0.06l-0.72%2C-0.18l-0.66%2C0.28l-0.41%2C0.34l0.22%2C0.14l1.64%2C0.41l0.08%2C0.65l0.13%2C0.03l0.62%2C-0.36l0.56%2C-0.61l2.52%2C-1.02l1.63%2C-0.88l2.29%2C-0.46l0.1%2C0.45l0.83%2C0.19l0.25%2C-0.24l0.37%2C0.14l0.39%2C0.41l1.36%2C-0.05l0.08%2C-0.63l0.43%2C0.07l0.26%2C0.18l0.18%2C0.73l-0.64%2C-0.04l0.2%2C0.81l-0.15%2C0.27l-0.24%2C0.6l-0.36%2C0.55l0.96%2C0.31l0.17%2C0.17l0.54%2C0.41l0.83%2C0.82l0.5%2C0.35l0.66%2C0.41l-0.49%2C1.41l0.19%2C0.55l0.6%2C0.51l0.35%2C0.32l0.42%2C0.15l0.78%2C-0.53l0.58%2C-0.71l0.13%2C0.27l0.58%2C-0.1l0.69%2C-0.34l0.22%2C-0.28l1%2C0.7l0.01%2C0.95l0.7%2C0.57l0.38%2C0.88l0.37%2C0.75l0.1%2C0.88l-0.37%2C0.6l0.05%2C0.55l0.51%2C0.07l0.21%2C0.04l-0.15%2C0.78l-0.08%2C0.18l-0.07%2C0.61l0.42%2C0.98l0.03%2C0.49l-0.49%2C0.68l-0.01%2C0.33l0.62%2C1.1l-0.9%2C0.52l-1.07%2C-0.3l-0.22%2C0.59l-0.51%2C0.41l-1.09%2C0.16l-0.74%2C0.21l-0.47%2C0.44l-0.29%2C-0.19l0.03%2C-0.31l-0.17%2C-0.16l-0.68%2C0.35l-0.73%2C0.08l-0.95%2C0.25l-0.2%2C0.21l-0.14%2C0.63l-0.47%2C-0.01l-0.34%2C-0.27l-1.24%2C0.24l-0.96%2C-0.22l-0.39%2C0.16l-0.67%2C0.29l-0.45%2C0.26l-0.4%2C1.29l-0.29%2C0.82l-1.61%2C0.26l-0.44%2C0.15l-0.62%2C0.12l-0.21%2C0.23l-0.13%2C0.43l-0.19%2C0.32l-0.18%2C0.14l-0.23%2C1.22l0.32%2C0.52l0.44%2C0.07l0.14%2C0.78l0%2C0.38l-0.6%2C0.18l-1.17%2C1.02l-1.69%2C0.45l-0.54%2C0.81l-0.94%2C0.11l-0.68%2C0.52l-0.57%2C0.46l0%2C0.34l0.24%2C0.28h0.92l0.58%2C0.53l-0.17%2C0.07l-0.78%2C-0.15l-0.74%2C0.26l0.01%2C-0.46l-0.31%2C-0.32l-0.82%2C0.17l-1.1%2C0.56l-2.23%2C0.48l-1.88%2C-0.07l-0.88%2C-0.77l-1.11%2C-0.15l-1.65%2C-0.42l-0.49%2C-0.38l-1.36%2C-0.27l-1.45%2C-0.08l-1.58%2C-0.5l-0.78%2C0.44l-1.59%2C-0.46l-0.32%2C-0.21l-0.18%2C-0.45l-0.47%2C-0.24l-1%2C-0.22l-1.68%2C0.13l-0.45%2C-0.46l-0.38%2C-0.05l-0.49%2C-0.42l-0.56%2C-0.15l-0.46%2C0.1l-0.03%2C0.2l-0.4%2C0.22l-0.59%2C-0.16l-0.65%2C0.16l-0.92%2C-0.85l-1.16%2C-0.18l-0.52%2C-0.6l-0.44%2C0.3l-0.01%2C-0.22l-0.75%2C0.26l0.21%2C-0.39l-0.18%2C-0.3l-0.1%2C0.09l-0.28%2C-0.32l-1.06%2C-0.33l-0.65%2C-0.64l-1.29%2C-0.43l-0.69%2C0.1l-0.6%2C-0.26l-1.86%2C0.47l0.34%2C0.12l-0.18%2C0.18l0.21%2C0.55l0.09%2C-0.24l1.9%2C0.09l1.46%2C-0.11l0.32%2C-0.18l0.41%2C0.45l-0.22%2C-0.02l0.09%2C0.17l-0.2%2C0.02l-0.14%2C0.39l-1.24%2C0.75l-0.45%2C0.48l-0.99%2C0.44l-1.11%2C0.21l-0.03%2C0.65l1.53%2C0.62l0.46%2C0.54l0.85%2C-0.42l0.17%2C0.09l0.01%2C-0.24l0.51%2C-0.15l0.06%2C0.26l0.16%2C-0.16l0.1%2C0.12l0.22%2C-0.11l-0.07%2C-0.13l0.33%2C-0.08l0.13%2C0.11l0.44%2C-0.19l-0.01%2C0.18l0.53%2C0.14l0.11%2C-0.12l0.49%2C0.27l0.17%2C0.31l-0.02%2C0.55l-0.64%2C0.21l-1.22%2C-0.37l-0.14%2C0.09l-0.1%2C-0.16l-0.32%2C0.03l-0.19%2C-0.29l-0.13%2C0.32l0.17%2C0.28l0.56%2C0.26l0.22%2C0.31l1.08%2C0.17l0.16%2C-0.13l0.51%2C0.38l0.59%2C-0.13l0.65%2C0.15l0.12%2C-0.2l0.15%2C0.12l-0.11%2C0.14l0.4%2C0.24l1.22%2C0.52l0.74%2C-0.1l0.29%2C0.28l1.01%2C0.42l0.48%2C-0.26l0%2C-0.28l0.57%2C0.09l-0.17%2C0.17l0.17%2C0.02l-0.14%2C0.29l0.08%2C0.63l0.31%2C-0.36l0.74%2C0.09l0.57%2C0.85l-0.36%2C0.49l-0.72%2C0.25l-0.29%2C0.56l0.2%2C0.28l0.64%2C-0.01l-0.04%2C-0.16l0.65%2C-0.44l0.93%2C0.56l0.34%2C-0.44l0.55%2C0.34l0.42%2C0.05l0.32%2C-0.08l0.47%2C-0.6l1.17%2C0.69l0.71%2C0.17l0.76%2C0.23l0.42%2C0.26l0.79%2C-0.09l0.38%2C0.13l0.13%2C0.09l-0.23%2C0.55l0.14%2C0.2l0.36%2C0.08l0.1%2C-0.17l0.53%2C0.16l0.91%2C0.4l0.35%2C-0.03l0.73%2C0.25l0.45%2C0.25l0.32%2C0.6l0.01%2C0.32l-0.38%2C0.48l-0.22%2C0.32l-1.07%2C0.51l-1.61%2C1.2l-0.48%2C0.42l-0.58%2C-0.09l0.24%2C0.36l-0.05%2C0.35l-0.33%2C0.29l-0.32%2C0.15l-0.63%2C0.07l0.07%2C0.42l-0.64%2C0.47l0.42%2C0.48l-0.12%2C0.48l-0.25%2C0.09l-0.58%2C-0.16l-0.34%2C0.13l-0.23%2C0.17l-0.08%2C0.37l0.8%2C0.35l0.77%2C-0.11l0.1%2C-0.49l0.61%2C-0.43l0.45%2C-0.83l0.01%2C-0.35l0.46%2C-0.61l0.39%2C-0.03l-0.03%2C-0.65l0.31%2C-0.41l0.47%2C-0.15l0.89%2C0.11l0.65%2C0.05l0.71%2C0.78l0.63%2C0.2l0.19%2C-0.39l0.36%2C-0.29l0.46%2C-0.13l0.66%2C0.51l0.14%2C0.45l-0.38%2C0.27l0.85%2C1l-0.26%2C1.45l-0.25%2C0.41l0.45%2C0.35l0.02%2C0.41l0.41%2C0.73l-0.61%2C0.35l-0.5%2C-0.05l-0.15%2C0.13l0.6%2C0.26l0.11%2C0.41l-0.32%2C0.33l-0.28%2C-0.03l-0.61%2C1.21l-0.42%2C0.23l0.02%2C0.44l-0.09%2C0.64l-0.7%2C0.32l-0.54%2C-0.16l-0.23%2C0.11l0.03%2C0.32l0.32%2C0.4l0.56%2C-0.05l0.03%2C0.12l-0.35%2C0.65l-0.56%2C-0.4l-0.19%2C0.04l0.04%2C0.58l-0.25%2C0.9l-0.61%2C0.92l-0.37%2C0.96l-0.88%2C-0.57l-0.37%2C0.6l-0.85%2C-0.19l-0.68%2C0.21l1.07%2C0.23l0.31%2C0.02l0.82%2C-0.35l-0.02%2C0.82l-1.13%2C1.67l-0.55%2C0.91l0.42%2C-0.11l0.48%2C-0.26l0.26%2C-0.15l0.58%2C-0.56l0.65%2C-1.53l1.41%2C-1.01l0.65%2C-1.64l0.7%2C-0.68l0.59%2C-0.03l1.5%2C-0.5l0.61%2C0.3l0.73%2C-0.25l1.02%2C0.72l0.94%2C-1.37l0.58%2C-0.28l0.23%2C-0.38l1.93%2C-0.59l0.51%2C-0.38l0.15%2C0.49l0.81%2C1.03l1.25%2C-0.38l0.27%2C-0.17l0.36%2C-0.22l0.42%2C0.21l0.07%2C-0.23l-0.07%2C-0.58l-0.44%2C-0.45l-0.09%2C-0.33l-0.58%2C-1.24l0.25%2C-0.87l-0.51%2C-1l-0.27%2C-0.95l0.26%2C-0.51l0.1%2C-0.72l0.28%2C-0.43l0.94%2C-0.27l0.44%2C0.15l0.31%2C0.35l0.26%2C-0.13l0.12%2C-0.29l0.26%2C0.35l0.32%2C-0.4l0.71%2C0.04l0.17%2C0.34l-0.19%2C0.06l-0.04%2C0.24l0.47%2C-0.05l0.34%2C0.32l-0.07%2C0.17l-0.47%2C0.68l-0.3%2C-0.05l-0.6%2C0.56l-0.89%2C0.32l0.08%2C0.4l0.68%2C-0.45h0.23l-0.03%2C0.38l0.62%2C-0.42l0.3%2C-0.02l0.18%2C0.28l0.64%2C-0.57l0.47%2C0.16l0.34%2C1.44l-0.16%2C0.14l0.31%2C0.59l-0.11%2C0.17l0.08%2C0.55l-0.18%2C0.39l0.13%2C0.62l0.18%2C0.06l0.42%2C1l-0.3%2C0.37l0.19%2C1.07l-0.13%2C1.24l0.25%2C0.44l-0.14%2C1.03l0.23%2C1.14l-1.37%2C0.99l-1.07%2C0.17l-0.02%2C0.16l0.58%2C0.15l0.76%2C0.19l0.25%2C-0.15l0.12%2C-0.32l0.52%2C-0.01l0.45%2C-0.03l0.5%2C-0.42l0.04%2C-0.22l-0.28%2C-0.36l-0.09%2C-0.48l-0.04%2C-0.71l0%2C-0.6l-0.08%2C-0.56l0.56%2C-0.85l0.18%2C-0.43l-0.77%2C-1.28l0.2%2C-1.47l-0.47%2C-1.06l0.06%2C-0.56l0.14%2C-0.53l0.61%2C-0.14l0.53%2C-0.23l0.69%2C-0.17l0.06%2C0.23l0.56%2C0.27l0.35%2C0.04l0.68%2C0.23l0.04%2C0.27l0.51%2C0.27l0.08%2C-0.17l-0.57%2C-0.53l0.05%2C-0.26l0.33%2C0.11l0.11%2C0.22l0.63%2C0.02l0.27%2C0.47l0.77%2C-0.35l0.22%2C0.21l-0.77%2C0.33l-0.05%2C0.31l0.48%2C0.51l0.29%2C-0.01l-0.29%2C-0.5l0.33%2C0.17l0.29%2C-0.11l0.07%2C-0.54l0.36%2C0.15l0.23%2C0.12l0.15%2C0.29l-0.26%2C0.62l-0.63%2C0.05l-0.17%2C0.17l0.11%2C0.7l-0.18%2C0.64l0.2%2C0.17l0.47%2C-0.02l0.13%2C-0.24l-0.14%2C-0.37l1.12%2C-0.57l0.23%2C-0.5l0.57%2C-0.33l0.42%2C0.25l0.56%2C0.81l0.28%2C0.54l0.42%2C0.81l0.38%2C1.1l0.1%2C0.56l-0.13%2C0.81l0.3%2C0.85l0.17%2C0.24l0.28%2C0.66l0.29%2C0.32l0.28%2C0.01l0.1%2C0.23l-0.02%2C0.35l-0.33%2C0.2l-0.17%2C0.36l0.32%2C1.61l0.29%2C0.55l0.02%2C1.57l-0.41%2C2.17l-0.04%2C1.19l-0.36%2C0.6l-0.56%2C0.33l-0.63%2C0.74l-1.19%2C0.49l-1.7%2C-0.12l-2.32%2C-0.6l-2.9%2C0.07l-0.31%2C-0.66l-2.01%2C-2.7l-4.01%2C-3.78l-2.11%2C-1.36l-1.4%2C0.64l0.08%2C1.02l1.02%2C0.05l0.31%2C1.87l0.81%2C2.58l-0.17%2C2.56l-0.97%2C0.56l-0.34%2C0.7l-0.07%2C3.09l-0.12%2C0.31l-0.8%2C0.95l-0.96%2C1.71l-0.92%2C0.88l-1.09%2C0.38l-0.36%2C-0.57l-0.37%2C-0.25l-1.25%2C-0.39l-1.05%2C0.82l-0.51%2C0.81l-1.5%2C0.46l-0.43%2C0.68l-0.57%2C1.55l-1.29%2C1.33l-1.28%2C1.03l-0.59%2C0.22l-0.31%2C-0.05l-0.26%2C-0.73h-0.35l-0.38%2C0.36l-1.77%2C0.29l-0.52%2C-0.21l-0.58%2C0.64l-1.62%2C1.01l-0.26%2C0.48l-0.16%2C0.93l0.06%2C1.26l0.3%2C0.67l0.48%2C0.36l0.12%2C0.58l-0.35%2C0.8l0.1%2C0.67l-0.15%2C0.71l-0.07%2C0.93l-0.44%2C1.03l-0.35%2C0.83l-0.54%2C2.12l0.18%2C0.63l-0.51%2C0.34l-0.44%2C0.66l-0.69%2C1.69l-0.95%2C0.89l-1.57%2C2.57l-0.54%2C0.4l-0.75%2C-1.02l-3.25%2C-3.17l-1.24%2C-2.33l0.59%2C-3.94l0.03%2C-3.33l8.84%2C-11.17l2.76%2C-5.34l-3.85%2C-10.65l-0.79%2C-3.55l-5.11%2C-2.38l-11.66%2C-5.81l-1.72%2C-2.13l0.37%2C-2.09l-4.22%2C-2.63l-4.06%2C-6.22l-0.21%2C-2.8l-0.42%2C-2.49l-0.2%2C-0.04l-0.82%2C0.35l-2.69%2C0.69l-1.16%2C0.83l-0.66%2C-0.23l-0.79%2C-0.57l-1.58%2C0.08l-0.72%2C0.41l-0.67%2C0.67l-0.35%2C0.86l0.03%2C0.81l-0.34%2C0.73l-2.15%2C0.21l-0.62%2C0.44l-0.46%2C0.81l-0.74%2C0.71l-0.52%2C0.17l-0.44%2C-0.11l-0.75%2C0.68l-0.08%2C0.35l0.33%2C0.27l0.25%2C0.64l-0.07%2C0.43l-1.54%2C0.5l-2.21%2C1.02L519%2C156.7l-0.8%2C-0.03l-0.57%2C0.49l-0.89%2C-0.62l-0.44%2C-0.86l-0.55%2C-0.45h-0.69l-0.44%2C0.35l-0.65%2C0.2l-0.42%2C-0.18l-0.32%2C-0.63l-0.03%2C-1.11l-1.46%2C0.07l-1.18%2C0.84l-0.39%2C0.05l-0.6%2C-0.27l-0.25%2C-0.83l-0.18%2C-0.11l-1.4%2C0.38l-1.37%2C0.7l-1.17%2C0.15l-0.71%2C0.38l-0.2%2C0.34l-0.13%2C1.02l-0.4%2C0.61l-0.64%2C0.56l0.21%2C0.81l-0.06%2C0.57l-0.77%2C1.87l-0.43%2C0.53l-0.71%2C0.61l-1.96%2C1.31l0.06%2C1.25l-0.77%2C1.16l-0.56%2C0.31l-0.18%2C0.37l0%2C0.63l-0.66%2C0.29l-0.29%2C0.93l-0.5%2C0.6l-1.28%2C0.72l-1.43%2C0.26l-0.7%2C0.72l-0.65%2C1.46l-0.77%2C0.59l-0.4%2C0.91l0.17%2C0.29l0.78%2C0.28l0.47%2C0.48l0.2%2C0.96l0.29%2C1.5l-0.22%2C0.76l-0.46%2C1.25l-0.27%2C0.43l-0.98%2C0.98l-1.19%2C0.63l0.06%2C0.42l0.57%2C0.53l0.21%2C0.43l-0.63%2C2.15l0.29%2C1.26l-0.69%2C0.63l-0.2%2C1.14l-0.38%2C0.87l0.03%2C0.48l0.28%2C0.93l0.21%2C0.44l0.34%2C0.76l-0.41%2C0.69l-0.33%2C1.5l-0.83%2C1.03l-0.48%2C1.13l-0.36%2C0.63l0.11%2C0.97l0.01%2C1.04l-0.14%2C0.61l-0.29%2C0.94l-0.51%2C1.28l0.08%2C1.11l-0.02%2C0.87l-0.37%2C0.48l0.01%2C0.53l1.08%2C3.73l-0.48%2C1.51l0.15%2C0.73l-0.09%2C1.56l0.67%2C1.41l-0.09%2C1.21l0.16%2C0.57l0.46%2C0.36l-0.03%2C0.77l-1.09%2C1.42l-0.27%2C0.65l-0.02%2C0.91l-0.44%2C0.9l0%2C0.41l-0.6%2C1.33l-0.28%2C1.15l-0.66%2C0.91l-0.88%2C0.62l-0.67%2C-0.27l-0.4%2C0.03l-1.01%2C-0.73l-0.08%2C-0.36l-0.28%2C-0.08l-1.43%2C0.83l-0.51%2C0.42l-2.33%2C1.55l-0.54%2C0.52l-0.67%2C0.73l-0.77%2C1.4l-1.21%2C1.26l-0.4%2C0.81l-0.13%2C1.45l-0.26%2C0.77l-0.02%2C1.85l-0.17%2C0.99l-0.19%2C1.62l0.19%2C2.62l-0.56%2C0.25l-0.25%2C0.79l-0.27%2C0.2l-0.44%2C-0.43l-0.36%2C0.24l-0.38%2C0.45l-0.48%2C0.25l-0.41%2C-0.35h-0.24l-1.11%2C0.49l-0.28%2C1.68l-0.08%2C1.78l-0.99%2C-0.42l-1.79%2C-4.72l-4.01%2C-2.84l-6.93%2C-2.19l-1.1%2C-0.57l-1.1%2C-1.23l-1.25%2C-0.5l0.1%2C-2.37l-1.9%2C0.65l-2.08%2C-2.99l-2.58%2C-0.62l-2.24%2C1.08l-1.03%2C4.45l-1.31%2C2.83l-5.34%2C0.84l-6.27%2C4l-2.83%2C-3.85l-5.64%2C0.11l-4.59%2C-2.52l-1.46%2C-1.06l-3.63%2C1.64l-0.83%2C-6.93l-3.38%2C-5.86l-0.44%2C-2.46l-5.06%2C-8.34l0%2C0l2.21%2C0.64l2.06%2C-0.24l3.94%2C-0.07l1.06%2C-0.81l2.26%2C-1.04l0.74%2C-1.04l-0.11%2C-0.92l0.59%2C-1.03l-0.12%2C-1.5l0.29%2C-2.36l-0.23%2C-2.21l-0.19%2C-0.6l-0.88%2C-0.56l-0.53%2C-1.58l-0.96%2C-1.5l-0.25%2C-1.13l-0.62%2C-1.54l-0.34%2C-0.36l-0.6%2C-0.28l-0.02%2C-1.63l-0.63%2C-0.78l-0.34%2C-1.27l0.41%2C-1.97l-0.72%2C-1.23l0.04%2C-0.37l0.11%2C-0.22l1.72%2C-0.2l1.02%2C-0.31l2.28%2C-1.34l1.09%2C-0.24l2.2%2C-0.24l2.04%2C0.5l-0.5%2C-2.19l1.08%2C-0.32l-0.08%2C-0.58l0.68%2C-1.59l0.08%2C-1.49l1.53%2C-1.01l1.16%2C-1.74l-1.26%2C-1.23l-2.05%2C1l-0.26%2C-0.11l-3.53%2C-2.58l-0.42%2C-0.48l-0.49%2C-1.4l0.13%2C-1.72l-0.36%2C-1.55l-1.55%2C-0.94l-0.44%2C-0.58l1.11%2C-2.53l1.14%2C-1.21l-0.25%2C-0.59l-0.28%2C-0.23l-1.27%2C-0.15l-0.7%2C-0.88l1.81%2C-1.82l-0.05%2C-0.69l-1.64%2C-0.89l-0.89%2C0.17l-2.46%2C-1.22l-0.69%2C-0.6l-0.56%2C-0.22l-0.08%2C-1.61l-1.28%2C-2.17l-0.02%2C-1.01l0.7%2C-0.75l-0.09%2C-1.08l-0.83%2C-0.96l-0.82%2C-2.42l-0.66%2C-1.27l0.21%2C-0.68l-1%2C-2.8l-0.88%2C-0.43l-1.61%2C2.08l-0.38%2C0.01l-0.72%2C-0.41l-0.21%2C0.03l-0.09%2C0.66l-0.59%2C1.19l-0.11%2C1.05l-1.27%2C0.51l-0.39%2C-0.78l-1.46%2C-0.6l-0.27%2C-0.99l-1.17%2C-0.91l-0.04%2C-0.41l-1.2%2C-0.6l-0.32%2C-0.93l0.42%2C-0.66l-1.81%2C-0.2l-0.57%2C0.58l-0.61%2C0.07l-0.31%2C-0.09l-0.54%2C-0.52l-0.57%2C0.58l-0.29%2C0.01l-0.09%2C-0.52l-1.5%2C-0.44l-3.71%2C-1.63l0%2C0l0.99%2C-1.31l0.52%2C-0.18l0.41%2C-0.6l0.28%2C-0.24l0.37%2C-0.07l0.51%2C0.39l0.25%2C-0.2l0.21%2C-0.69l0.62%2C-0.04l1%2C-0.57l0.37%2C0.83l0.09%2C0.73l-0.4%2C1.37l0.13%2C0.56l1.04%2C1.5l0.42%2C0.42l0.16%2C-0.05l-0.39%2C-0.73l0.4%2C-0.27l-0.63%2C-0.85l0.1%2C-0.81l0.39%2C-0.44l0.08%2C-1.08l-0.16%2C-1.75l-0.32%2C-1.08l0.49%2C-0.89l0.39%2C-0.27l0.63%2C-0.11l0.58%2C-0.42l0.17%2C0.5l-0.32%2C1.18l0.13%2C0.88l0.76%2C1.09l0.93%2C0.57l0.64%2C0.9l0.54%2C0.26l0.43%2C0.77l0.37%2C-0.09l-0.17%2C1.23l0.53%2C-0.28l0.48%2C0.14l0.31%2C0.64l0.35%2C2.09l0.78%2C0.72l0.47%2C1l-0.03%2C0.71l0.22%2C0.16l0.24%2C-0.26l-0.16%2C-0.91l0.16%2C-0.93l-0.91%2C-1.07l-0.2%2C-1.19l0.3%2C-0.5l0.95%2C-0.11l-0.01%2C-0.19l-1.02%2C-0.18l-0.92%2C-1l-0.24%2C-0.77l0.2%2C-0.59l0.03%2C-0.3l0.12%2C-0.56l1.21%2C-0.87l1.35%2C-2.12l0.4%2C-0.31l0.67%2C-1l0.93%2C0.03l0.62%2C0.52l-0.17%2C1.02l-1.27%2C1.35l0.01%2C0.71l0.75%2C-0.58l0.93%2C-1.21l0.75%2C-0.64l0.45%2C-0.03l0.45%2C0.57l0.05%2C1.34l-0.36%2C0.78l0.13%2C1.97l-0.37%2C0.43l0%2C0.26l0.3%2C0.08l0.53%2C-0.56l0.07%2C-2.41l0.31%2C0.14l0.45%2C0.24l-0.17%2C-0.87l0.26%2C-0.27l1.89%2C-0.08l0.75%2C0.19l0.31%2C0.31l0.48%2C0.24l-0.68%2C1.85l0.15%2C0.46l-0.11%2C0.86l-0.63%2C0.3l-0.28%2C0.51l0.25%2C0.07l0.6%2C-0.49l0.2%2C0.62l-0.15%2C1.31l-0.43%2C1.04l-0.28%2C1.69l0.4%2C0.08l0.12%2C0.38l-0.46%2C0.45l-1.01%2C0.36l-0.15%2C0.32l0.43%2C-0.01l0.22%2C0.28l1.01%2C-0.22l0.68%2C-0.38l0.6%2C0.31l0.38%2C-0.54l0.72%2C0.26h0.67l0.93%2C0.56l1.16%2C0.24l0.34%2C0.28l1.08%2C0.59l-0.1%2C-0.45l-1.94%2C-1.8l-0.71%2C-0.32l-1.38%2C0.05l-1.39%2C-0.24l-0.15%2C-0.16l-0.18%2C-0.45l0.07%2C-0.22l0.29%2C-0.51l0.37%2C-0.37l0.23%2C-0.7l0.1%2C-1.51l-0.16%2C-1.28l0.18%2C-0.25l0.15%2C-0.33l-0.06%2C-0.68l0.25%2C-0.22l-0.12%2C-0.46l0.27%2C-0.14l0.57%2C0.31l1.54%2C0.18l0.3%2C0.18l0.11%2C0.37h0.95l0.2%2C0.29l-0.2%2C0.93l0.12%2C0.24l0.33%2C-0.11l0.21%2C-0.39l0.42%2C-0.19l1.27%2C0.71l-0.91%2C1.24l0.1%2C0.11l0.25%2C-0.19l0.64%2C-0.03l0.65%2C-0.92l0.88%2C0.07l1.08%2C0.45l0.48%2C-0.06l1.18%2C0.51l2.32%2C-0.07l0.86%2C0.35l0.4%2C0.39l0.13%2C0.52l-0.07%2C0.62l-0.2%2C0.53l-0.44%2C0.53l-0.23%2C0.41l-0.32%2C0.5l-0.59%2C0.29l-0.37%2C1.13l-0.92%2C0.79l0.22%2C0.32l-0.87%2C0.69l-1.51%2C0.31l-0.97%2C0.5l-1.15%2C-0.13l-0.63%2C0.77l-1.11%2C0.4l-1.02%2C0.08l-1.27%2C-0.49l-0.49%2C-0.03l-0.63%2C0.69l-0.57%2C0.28l-0.63%2C0.07l-0.08%2C0.26l0.14%2C0.42l-0.71%2C0.41l-0.38%2C-0.05l-0.79%2C0.47l-0.14%2C0.25l0.38%2C1.13l0.69%2C-0.99l1.71%2C-1.39l2.44%2C-0.23l3.14%2C-0.9l0.75%2C0.07l1.16%2C-0.8l0.92%2C-0.18l2.21%2C-0.93l0.32%2C-0.21l0.25%2C-0.55l1.03%2C-0.72l0.6%2C-0.78l0.52%2C-0.18l0.32%2C0.15l0.12%2C0.29l-0.34%2C0.34l0.07%2C1.03l0.21%2C0.37l-0.28%2C0.74l-0.06%2C1.37l0.32%2C1.21l-0.3%2C0.26l-0.26%2C0.71l-0.46%2C0.09l0.52%2C0.28l0.03%2C0.4l0.57%2C0.21l0.52%2C0.83l0.46%2C-0.1l0.4%2C-0.96h0.27l0.7%2C2.26l-0.21%2C0.66l0.09%2C0.85l0.21%2C0.11l0.6%2C-0.29l0.17%2C0.24l-0.19%2C0.8l-0.5%2C0.17l-0.67%2C0.75l-0.7%2C0.37l-0.41%2C0.47l-0.42%2C0.82l0.06%2C0.14l0.37%2C0.05l0.46%2C-0.78l0.33%2C-0.29l0.63%2C-0.46l0.25%2C0.01l0.09%2C0.5l-0.23%2C0.12l-0.18%2C0.25l0.3%2C0.17l0.31%2C-0.06l0.17%2C-0.8l0.41%2C-0.44l0.41%2C-0.31l0.61%2C0.08l0.95%2C-0.72l0%2C-0.46l0.46%2C-0.17l0.21%2C-1.11l0.53%2C-0.17l0.3%2C-0.05l0.23%2C0.44l-0.08%2C0.42l0.32%2C0.17l0.41%2C0.02l0.53%2C-0.33l0.34%2C0.04l0.06%2C0.72l0.34%2C0.31l0.31%2C-0.18l0.24%2C-0.2l0.66%2C-0.68l0.21%2C0.25l0.24%2C0.13l0.56%2C-1.12l-0.26%2C-0.59l0.65%2C-0.27l0.14%2C-0.49l0.35%2C-0.12l-0.2%2C-0.56l-0.34%2C-0.28l-1.07%2C-0.05l-1.52%2C0.04l-0.44%2C0.32l-0.61%2C-0.01l-1.01%2C-0.81l-0.27%2C0.05l-1.55%2C-1.03l-0.78%2C-0.85l-0.27%2C-0.75l-1%2C-0.95l0.23%2C-0.28l1.21%2C-0.21l0.83%2C-0.6l1.46%2C-0.01l0.75%2C-0.08l0.43%2C0.27l0.43%2C-0.92l0.56%2C-0.63l-1.41%2C-1.05l-0.52%2C-0.82l-0.65%2C-0.56l0.16%2C-0.41l-0.38%2C-0.53l0.62%2C-0.16l1.02%2C0.05l0.91%2C-0.32l-0.47%2C-0.26l-1.38%2C0.09l-0.92%2C-0.28l-0.9%2C-0.72l-0.32%2C-0.56l-0.56%2C-0.75l0.43%2C0.02l0.25%2C-0.56l0.72%2C0.39l1%2C-0.14l0.93%2C-0.5l1.57%2C0.05l0.29%2C-0.15l0.02%2C-0.47l0.7%2C-0.11l0.26%2C-0.24l1.07%2C0.15l0.33%2C-0.14l-0.61%2C-0.26l-0.83%2C-0.15l-1.09%2C-0.13l-0.12%2C0.03l0.14%2C0.26l-0.4%2C0.06l-0.46%2C-0.18l-0.79%2C0.4l-0.66%2C-0.16l-0.41%2C0.12l-0.6%2C-0.23l-0.24%2C-0.27l0.26%2C-0.39l0.43%2C-0.25l1.33%2C-0.27l0.61%2C-0.45l1.11%2C0.5l0.04%2C-0.31l-0.88%2C-0.57l-0.02%2C-0.35l1.05%2C-0.47l0.92%2C-0.16l0.95%2C0.45l0.71%2C-0.03l0.84%2C-0.35l0.6%2C-0.29l0.23%2C-0.48l-1.51%2C0.49l-0.22%2C-0.28l-1.3%2C-0.49l-0.05%2C-0.18l0.36%2C-0.62l0.61%2C-0.62l-0.2%2C-0.16l-0.97%2C0.88l-0.59%2C0.32l-0.11%2C-0.23l0.27%2C-1.23l1.77%2C-2.35l1.54%2C-1.3l-0.06%2C-0.46l0.3%2C-0.38l1.12%2C-0.82l0.35%2C-0.68l1.73%2C-1.63l0.93%2C-0.5l0.15%2C0.53l0.14%2C-0.56l-0.19%2C-0.28l-0.16%2C-0.18l-0.07%2C-0.71l0.34%2C-0.05l0.56%2C-0.84l1.25%2C-1.17l1.13%2C-0.25l1.03%2C-0.58l0.57%2C-0.01l0.17%2C0.04l1.42%2C-0.3l0.26%2C0.5l1.19%2C0.96l0.53%2C0.02l1.31%2C0.47l0.72%2C-0.14l0.01%2C0.42l0.97%2C-0.07l0.29%2C0.69l-0.15%2C0.78l0.82%2C0.77l0.35%2C-0.08l-0.22%2C-0.89l0.11%2C-0.59l-0.21%2C-0.68l-1.27%2C-1.86l-0.74%2C-0.58l-0.96%2C-0.63l-0.91%2C-0.48l-0.28%2C-0.04l-0.4%2C0.04l-0.35%2C-0.45l0.27%2C-0.96l0.6%2C-0.92l0.23%2C-0.12l0.46%2C-0.47l0.28%2C-0.85l0.67%2C-1.02l0.69%2C0.32l-0.05%2C-2.14l0.12%2C-0.32l-0.15%2C-0.26l0.25%2C-1.48l0.12%2C-0.11l0.87%2C0.06l-0.24%2C-1.16l0.51%2C-0.42l0.08%2C-0.32l0.38%2C-0.22l0.19%2C0.19l-0.12%2C0.26l0.11%2C0.07l1.01%2C-1.05l-0.42%2C0.94l0.39%2C-0.22l0.35%2C0.22l0.47%2C-0.15l0.09%2C0.4l0.8%2C-0.06l0.13%2C-0.18l0.33%2C0.1l0.32%2C0.44l-0.07%2C0.78l0.57%2C0.14l1.48%2C1.2l0.21%2C0.93l0.6%2C0.59l0.15%2C0.5l0.24%2C0.23l0.73%2C-0.06l0.65%2C-0.74l0.38%2C-0.08l0.1%2C-0.29l-0.05%2C-0.28l-0.31%2C-0.31l0.1%2C-0.5l-0.66%2C-0.61l0.09%2C-0.35l-0.77%2C-0.84l-0.25%2C-0.78l-0.54%2C-0.35l0.19%2C-0.04l-0.11%2C-0.33l0.34%2C-0.03l0.11%2C-0.2l1.33%2C0.24l-0.81%2C-0.34l-0.16%2C-0.33l-0.63%2C-0.26l-0.41%2C-0.44l-0.21%2C0.06l0.03%2C0.49l-0.59%2C-0.04l-0.22%2C-0.19l0.05%2C-0.23l0.43%2C0.02l0.16%2C-0.31l-0.82%2C-0.2l-0.56%2C-0.64l0.49%2C-0.24l-0.16%2C-0.58l0.26%2C-0.55l-0.08%2C-0.13l-0.26%2C-0.02l-0.46%2C0.33l-1.27%2C0.03l-0.87%2C-0.31l-0.65%2C0.06l-0.28%2C-0.22l-0.37%2C0.04l-0.01%2C-0.41l0.47%2C-0.2l0.01%2C-0.17l-0.83%2C-0.13l-0.28%2C0.14l-0.3%2C0.02l0.17%2C-0.33l-1.09%2C-0.24l-0.57%2C-0.45l0.18%2C-1.44l0.52%2C-0.71l-0.28%2C-0.8l0.11%2C-0.32l-0.67%2C-0.89l0.06%2C-0.43l1.39%2C-1.2l0.26%2C-0.02l0%2C-0.29l0.7%2C-0.8l0.3%2C-0.1l0.35%2C0.6l0.38%2C-0.06l0.25%2C0.27l-0.24%2C0.81l0.04%2C0.51l0.93%2C-0.04l0.3%2C0.31l-0.08%2C0.48l-0.31%2C0.55l0.19%2C0.33l0.33%2C0.15l0.76%2C0.27l0.71%2C0.33l0.23%2C0.5l0.63%2C0.61l0.44%2C0.49l0.54%2C0.34l0.71%2C-0.64l0%2C-1.44l-0.25%2C-0.48l-0.43%2C0.01l-0.58%2C-0.27l0.15%2C-0.41l0.4%2C-0.03l-0.06%2C-0.39l-0.16%2C-0.56l-0.58%2C-1.21l0.02%2C-0.34l0.61%2C-0.02l0.2%2C-0.42l1.47%2C0.17l0.35%2C0.3l0.73%2C-0.37l-0.11%2C-0.26L463%2C90.87l-2.74%2C-1.42l-0.02%2C-0.29l1.17%2C-0.51l0.4%2C-0.48l-1.31%2C-0.06l-0.34%2C-0.34l0.1%2C-1.33l-0.13%2C-0.7l1.8%2C-0.2l0.6%2C-0.22l-0.7%2C-0.25l-0.9%2C0.23l-0.27%2C-0.1l-0.07%2C-0.25h-0.53l-0.14%2C-0.27l0.48%2C-0.45l0.45%2C-0.08l0.72%2C-0.46l0.44%2C-0.62l1.36%2C-0.02l0.25%2C0.16l-0.29%2C0.49l-0.3%2C0.87l0.1%2C0.61l0.83%2C-1.4l0.24%2C-0.04l0.45%2C-0.49l0.7%2C-0.11l0.05%2C0.77l-0.28%2C0.54l-0.03%2C0.56l0.6%2C0.48l-0.17%2C0.11l0.02%2C0.39l0.23%2C0.31l0.46%2C-0.1l0.29%2C0.34l0.43%2C0.99l-0.21%2C0.25L466.06%2C88l-0.22%2C0.34l0.19%2C0.19l1.04%2C-0.06l0.63%2C-0.53l-0.1%2C-0.11l0.66%2C-0.39l-0.02%2C0.3l0.63%2C0.62l0.62%2C-0.15l-0.24%2C-0.47l-0.46%2C-0.31l-0.01%2C-0.24l0.28%2C-0.31l0.46%2C-1.02l0.23%2C-0.79l-0.08%2C-0.76l0.72%2C-0.08l0.51%2C0.23l0.43%2C0.56l0.05%2C0.44l0.32%2C0.32l0.03%2C0.39l-0.43%2C1.27l-1.45%2C1.59l-0.46%2C0.93L468%2C91.3l0.45%2C-0.01l0.66%2C-0.38l0.18%2C0.33l0.6%2C0.25l0.43%2C0.21l0.31%2C-0.46l0.31%2C0.67l0.29%2C0.02l0.01%2C-0.29l-0.32%2C-0.6l0.1%2C-0.58l0.63%2C-0.9l0.04%2C-0.54l0.58%2C-0.37l0.47%2C-0.59l0.48%2C-0.72l1.06%2C1.7l0.24%2C0.39l0.54%2C0.12l0.43%2C1.03l0.01%2C0.42l0.21%2C0.05l0.25%2C0.59l0.03%2C1.08l0.18%2C0.59l-0.08%2C0.61l0.25%2C1.18l-0.4%2C0.52l0.21%2C0.4l0.19%2C-0.31l0.22%2C-0.06l0.2%2C0.24l0.56%2C-1.24l0.3%2C0.16l0.7%2C1.12l-0.2%2C-1.59l0.3%2C0.1l0.59%2C-1.4l-0.15%2C-0.08l0.08%2C-0.2l-0.81%2C-0.43l-0.08%2C-0.33l0.25%2C-0.01l0.61%2C0.38l-0.03%2C-1.21l0.27%2C0.04l0.54%2C-0.74l-0.17%2C-1.15l-1.06%2C-2.16l-0.72%2C-0.44l-0.21%2C-0.91l0.07%2C-1.26l0.35%2C-0.49l0.42%2C-0.07l0.58%2C0.49l0.01%2C0.47l0.29%2C-0.2l0.26%2C0.06l1.25%2C0.58l0.13%2C0.89l1.09%2C0.81l0.34%2C0.41l0.02%2C0.44l0.47%2C0.13l0.34%2C0.46l-0.75%2C1.14l-0.67%2C0.93l-0.72%2C0.73l-0.47%2C0.42l-0.53%2C0.34l0.12%2C0.32l0.65%2C0.03l-0.2%2C0.41l0.03%2C0.55l0.2%2C0.03l0.32%2C-0.38l0.18%2C-0.62l0.52%2C-0.64l0.04%2C-0.52l0.29%2C-0.3l0.08%2C0.33l-0.3%2C0.75l0.16%2C0.39l0.35%2C-0.54l1.35%2C-1.66l0.13%2C-0.46l0.73%2C-0.71l0.76%2C0.12l0.86%2C-0.26l0.5%2C0.19l0.11%2C0.78l-0.56%2C0.32l0.82%2C0.4l0.28%2C0.55l-0.2%2C1l0.23%2C-0.02l0.35%2C-0.36l0.01%2C-1.48l0.99%2C-0.65l0.65%2C-0.21l1.02%2C-0.16l-0.37%2C0.41l0.05%2C0.18l0.38%2C0.03l0.53%2C-0.22l-0.31%2C0.65l-0.43%2C0.65l-0.31%2C0.36l-0.47%2C0.13l0.06%2C0.31l0.63%2C0.01l1.25%2C-0.53l-0.15%2C0.65l-0.79%2C1.1l-0.84%2C0.73l-0.06%2C0.27l-0.57%2C0.05l0.11%2C0.34l-0.14%2C0.26l-0.5%2C-0.08l-0.25%2C0.29l0.12%2C0.31l-0.48%2C0.64l0.12%2C0.71l-0.2%2C0.82l-0.32%2C0.29l-0.5%2C0.22l-0.32%2C-0.3l-1.9%2C0.84L484.74%2C99l-0.51%2C1.07l0.4%2C0.5l0.26%2C0.03l0.93%2C-0.83l0.4%2C-0.25l0.31%2C-0.26l-0.25%2C2.13l-0.44%2C0.35l-0.12%2C-0.95l-0.19%2C-0.18l-0.23%2C0.1l-1.9%2C2.27l-0.22%2C0.19l-0.4%2C-0.1l-0.19%2C0.1l-0.18%2C0.74l-0.55%2C0.82l-0.59%2C0.57l-0.58%2C0.27l-1.03%2C-0.03l0.31%2C0.84l-0.56%2C0.82l-0.14%2C0.64l-0.35%2C0.64l-0.69%2C1.15L477%2C111l-0.62%2C0.38l-0.35%2C1.32l-1.19%2C0.79l-1.11%2C1.26l-0.86%2C0.33l-0.15%2C0.28l-0.21%2C0.3l-0.13%2C0.58l0.78%2C-0.06l2.49%2C-0.86l0.49%2C0.58l-0.13%2C0.56l-0.49%2C0.87l-1.38%2C0.47l-0.91%2C-0.13l-0.84%2C-0.35l-0.13%2C0.05l-0.34%2C0.49l0.57%2C0.46l-0.23%2C0.4l0.22%2C0.45l3.16%2C-0.62l0.28%2C0.69l-0.08%2C0.29l0.62%2C-0.01l0.09%2C-0.28l0.45%2C0.32l-0.47%2C0.32l-0.26%2C0.12l-0.28%2C0.25l-0.4%2C1l-1.22%2C1.3l0.36%2C0.62h0.8l0.79%2C0.32l-0.18%2C1.2l-0.35%2C0.35l-0.39%2C-0.13l-0.49%2C-0.16l-0.32%2C0.03l0.08%2C-0.55l0.24%2C-0.21l-0.1%2C-0.36l-0.2%2C-0.08l-0.57%2C0.23l-0.97%2C1.51l-0.38%2C1.06l-0.81%2C0.46l-0.4%2C0.45l0.65%2C0.25l0.68%2C-0.67l0.64%2C-0.18l-1.06%2C1.16l-0.02%2C1.07l-0.56%2C0.77l0.22%2C0.17l0.33%2C-0.1l1.56%2C-1.11l0.33%2C0.21l0.38%2C-0.02l0.11%2C0.23l0.08%2C0.53l-0.35%2C0.46l0.18%2C0.42v0.83l-0.41%2C0.39l-0.65%2C0.2l-0.28%2C0.29l-0.83%2C1.21l-0.25%2C0.29l-0.79%2C-0.14l-0.66%2C0.86l-1.61%2C1.23l0.11%2C0.42l-0.09%2C1.29l-0.43%2C0.11l-0.08%2C0.26l0.06%2C0.24l0.08%2C0.46l0.27%2C0.4l0.53%2C0.66l-0.57%2C0.45l-0.39%2C1l-0.14%2C0.37l0.2%2C2.08l-0.14%2C1.09l0.05%2C1l0.52%2C0.29l1.24%2C0.45l-0.04%2C1.38l0.46%2C0.06l0.22%2C-0.19l0.25%2C-0.34l-0.12%2C-0.55l0.27%2C-1.06l-0.31%2C-0.32l-0.86%2C-0.34l-0.21%2C-0.82l0.13%2C-0.32l-0.07%2C-0.63l0.16%2C-0.49l0.2%2C-0.4l0.17%2C-0.67l0.55%2C-0.76l0.43%2C0.36l0.65%2C-0.62l0.18%2C-0.25l0.17%2C0.8l0.13%2C0.72l-0.41%2C0.04l-0.21%2C0.07l-0.3%2C0.32l0.05%2C0.92l0.21%2C-0.08l0.42%2C-0.07l0.73%2C-1.03l0.17%2C-0.12l0.25%2C0.42l0.42%2C0.13l-0.17%2C0.62l-0.36%2C0.13l-0.3%2C-0.01l-0.35%2C0.53l-0.24%2C-0.2l-0.27%2C-0.12l-0.36%2C0.02l0.15%2C0.45l0.1%2C0.45l-0.16%2C0.49l0.55%2C1.39l0.89%2C0.73l0.3%2C0.05l0.28%2C-0.28l0.09%2C-0.5l0.17%2C-0.18l0.2%2C-0.27l0.55%2C-0.41l0.43%2C-0.07l0.26%2C-0.38l0.09%2C-1.11l0.42%2C-1.1l0%2C-0.22l-0.32%2C-0.35l0.17%2C-0.3l0.42%2C-0.17l0.23%2C-0.49l-0.03%2C-0.47l0.06%2C-0.87l0.14%2C-0.7l0.35%2C-0.91l0.16%2C-0.19l0.21%2C0.87l1.05%2C-0.96l1.02%2C-1.57l-0.04%2C-1.02l0.06%2C-0.54l0.13%2C-0.39l1.02%2C-0.79l0.5%2C-0.29l0.67%2C-1.03l-0.39%2C-0.4l0.37%2C-0.66l0.25%2C-0.44l0.22%2C-0.43l-0.29%2C-0.02l-0.51%2C-0.1l-0.51%2C0.29l-0.78%2C-0.69l-0.67%2C-0.31l-0.28%2C0.09l-0.2%2C-0.48l0.38%2C-0.63l0.86%2C-0.45l-0.2%2C-0.57l0.12%2C-0.46l0.07%2C-0.45l1.29%2C-1.03l-0.09%2C-0.79l0.27%2C-0.57l0.35%2C0.19l0.02%2C0.53l0.31%2C0.21l0.25%2C-0.46l0.2%2C-0.66l-0.39%2C-0.21l0.23%2C-0.31l0.19%2C0.11l0.56%2C-0.51l0.08%2C-0.61l0.76%2C-1.01l0%2C-1.02l0.57%2C-0.31l0.39%2C-0.84l0.21%2C-1.22l0.87%2C-0.9l1.02%2C-0.64l0.43%2C-0.56l1.99%2C-3.2l0.33%2C-0.3l0.71%2C-0.26l0.53%2C-0.34l0.11%2C-0.63l0.76%2C-0.66l0.25%2C-0.19l0.39%2C-0.53l-0.31%2C-0.82l0%2C-0.46l0.99%2C-2.2l0.1%2C-1.63l0.61%2C-0.76l-0.09%2C-0.35l-0.37%2C-0.19l0.17%2C-0.87l0.32%2C-0.67l0.58%2C-0.42l0.34%2C0.33l0.02%2C0.47l0.43%2C0.02l0.58%2C-2.42l-0.11%2C-0.69l0.03%2C-0.17l0.8%2C-0.68l0.44%2C-0.22l0.58%2C-0.41l0.46%2C-0.31l-0.06%2C-0.54l0.53%2C-1.16l0.59%2C-0.26l0.03%2C-0.6l0.38%2C-0.57l0.63%2C-0.96l1.1%2C-1.86l0.87%2C-1l0.4%2C-0.45l0.34%2C-0.53l0.3%2C-0.28l0.43%2C-0.79l0.98%2C-1.27l1.22%2C-1.23l0.2%2C-0.06l0.57%2C-0.11l0.54%2C0.12l0.49%2C-0.46l0.41%2C-0.07l0.18%2C-0.52l0.81%2C0.18l-0.21%2C0.63l0.47%2C0.9l0.18%2C0.74l-0.54%2C1.09l0.69%2C0.58l-0.02%2C0.47l-0.24%2C0.21l-0.12%2C0.43l-0.01%2C0.81l-0.4%2C0.29l-0.25%2C0.7l-0.25%2C0.37l-0.2%2C0.38l-0.05%2C0.87l0.14%2C0.71l-0.29%2C0.27l0.11%2C0.23l1.53%2C-1.03l0.12%2C0.2l0.04%2C1.03l-0.13%2C0.15l-0.37%2C0.12l0.1%2C1.27l-0.69%2C1.01l-0.29%2C0.72l-0.04%2C0.54l0.23%2C0.5l0.08%2C1.06l-0.6%2C0.88l-1.42%2C1.34l-0.98%2C0.53l-0.11%2C0.32l-0.74%2C0.51l-1.07%2C0.48l-0.62%2C0.23l-0.95%2C0.31l-0.55%2C1.11l-1.63%2C1.1l0.54%2C0.14l2.03%2C-0.71l2.25%2C-0.85l0.49%2C0.12l1.32%2C0.44l0.98%2C0.92l-0.23%2C1.35l-0.11%2C0.93l-0.13%2C0.83l0.12%2C0.39l-0.55%2C1.64l0.01%2C1.19l0.22%2C0.34l-0.3%2C0.79l-1.17%2C1.53l0%2C0.98l0.32%2C0.47l-0.29%2C0.43l0.06%2C0.21l0.57%2C0.14l0.24%2C0.58l-0.51%2C0.37l-0.07%2C0.54l-0.74%2C0.8l-0.01%2C0.4l-0.19%2C0.79l0.05%2C0.23l-0.33%2C0.32l0%2C0.36l0.21%2C0.12l0.09%2C1.06l0.3%2C0.57l-0.81%2C0.62l-0.09%2C0.41l0.16%2C0.35l-0.55%2C0.46l0.06%2C0.66l0.71%2C0.77l0.17%2C-0.02l0.12%2C-1.37l0.31%2C-0.28l0.08%2C-0.46l0.61%2C-0.32l0.27%2C-0.33l0.41%2C0.38l0.32%2C0.29l0.5%2C-0.2l-0.04%2C-0.35l-0.24%2C-0.27l-0.22%2C-0.35l-0.09%2C-0.28l-0.48%2C-0.23l0.03%2C-0.31l0.3%2C-0.13l0.47%2C-0.79l0.12%2C-0.67l0.4%2C0.21l0.15%2C0.3l0.27%2C0.01l0.49%2C0.06l0.11%2C0.05l0.49%2C0.5l0.32%2C-0.08l0.23%2C-0.23l0.15%2C-0.32l-0.29%2C-0.53l0.19%2C-0.31l0.4%2C0.03l0.28%2C-0.23l-0.12%2C-0.4l0.19%2C-0.99l-0.27%2C-0.67l-0.23%2C-0.58l0.01%2C-0.61l0.09%2C-0.09l0.54%2C0.1l0.31%2C0.44l0.41%2C0.03l0.29%2C-1.09l0.25%2C0.06l0.27%2C0.43l0.37%2C0.63l0.77%2C0.15l0.81%2C-0.16l0.23%2C-0.49l0.27%2C0.2l0%2C0.19l-0.19%2C0.47l-0.43%2C0.44l-0.08%2C0.41l0.91%2C0.31l0.17%2C0.03l0.96%2C-1.37l0.63%2C-0.24l1.04%2C0.69l0.25%2C0.45l0.15%2C-0.06l0.2%2C-1.05l-0.34%2C-0.39l-0.6%2C-0.24l-0.55%2C-0.01l-0.27%2C-1.24l-0.76%2C-0.17l-0.2%2C-1.23l-0.83%2C-1.2l0.29%2C-0.25l1%2C-0.3l0.13%2C-0.23l-0.13%2C-0.73l-0.22%2C-0.28l-0.5%2C0.15l-0.57%2C-0.32l0.42%2C-0.5l0.08%2C-0.52l0.81%2C-1.25l0.59%2C-0.09l0.1%2C-0.27l-0.34%2C-0.33l0.54%2C-0.33l0.58%2C0.28l0.02%2C0.34l0.5%2C0.48l0.71%2C0.26l1.56%2C0.24l1.18%2C0.93l0.68%2C-0.01l0.13%2C-0.13l-0.62%2C-0.19l-0.56%2C-1.29l-1.02%2C-0.5l-0.97%2C-1.09l-0.8%2C-0.02l-0.67%2C-0.73l-0.02%2C-1.27l0.37%2C-0.33l0.38%2C-0.06l0.18%2C-0.43l0.64%2C0.24l-0.44%2C-0.76l-0.87%2C-0.08l-0.11%2C-0.17l0.11%2C-0.22l0.55%2C-0.03l0.44%2C0.22l0.45%2C0.29l0.35%2C-0.42l-0.79%2C-0.58l-1.21%2C-0.19l-0.34%2C-0.34l0.07%2C-0.36l0.28%2C-0.04l0.4%2C-1.17l0.27%2C-2.05l0.66%2C0.45l1.71%2C-0.07l0.4%2C-0.23l0.56%2C0.06l0.44%2C0.7l0.61%2C0.9l0.6%2C-0.53l-0.01%2C-0.86l0.14%2C-0.24l-1.38%2C-0.88l0.22%2C-0.25l0.06%2C-0.47l-0.16%2C-0.91l0.17%2C-1.14l0.14%2C-1.93l0.53%2C-0.07l1.17%2C-0.01l2.01%2C1.31l1.58%2C0.22l1.68%2C0.53l1.76%2C-0.01l-1.97%2C-0.84l-1%2C-0.15l-1.13%2C-0.58l-0.87%2C-0.86l-0.06%2C-0.48l1.25%2C-0.14L528%2C92.95l0.26%2C-0.53L528.7%2C92l-0.68%2C-0.39l-0.28%2C0.13l-0.64%2C-0.22l0.01%2C-0.46l-0.11%2C-0.44l-0.88%2C-0.01l-0.19%2C0.27l-0.62%2C-0.13l0.69%2C-1.43l0.22%2C-0.74l-0.43%2C-0.23l-1.3%2C1.55l-0.68%2C0.29l-1.32%2C-0.07l-1.39%2C-0.37l-0.83%2C-0.52l-0.17%2C-0.61l-0.91%2C-0.29l-0.33%2C-1.07l0.15%2C-0.27l0.38%2C-0.13l-0.04%2C-1.11l0.3%2C-0.87l0.19%2C-0.95l1.17%2C0.11l0.48%2C0.64l0.51%2C0.11l1.41%2C1.53l0.62%2C-0.15l0.29%2C-0.21l-0.43%2C-0.2l-0.41%2C-0.84l-0.06%2C-0.96l-0.88%2C-1.42l-1.01%2C-0.4l-0.46%2C-0.63l0.39%2C-1.09l0.41%2C-0.42l0.6%2C-0.57l0.45%2C-0.06l0.45%2C0.45l0.39%2C0.15l1.28%2C0.73l0.19%2C0.45l1.11%2C-0.35l0.77%2C0.47l0.15%2C0.32l0.81%2C0.17l0.11%2C0.25l-0.17%2C1.54l0.29%2C1.95l0.77%2C0.02l0.38%2C-0.33l-0.29%2C-0.54l0.22%2C-1.44l-0.18%2C-0.71l0.43%2C-1.04l-0.39%2C-0.83l-0.43%2C-0.15l-0.32%2C-0.61l-0.67%2C-0.39l-0.2%2C-0.98l0%2C-0.54l0.29%2C-1.61l0.61%2C-0.38l0.59%2C-0.79l0.59%2C-0.41l0.51%2C0.17l0.55%2C0.72l0.4%2C-0.14l0.13%2C-0.4l-0.07%2C-0.56l-0.26%2C-0.3l-0.08%2C-0.55l0.23%2C-0.52l0.46%2C-0.06l0.1%2C0.42L532.28%2C74.1zM485.99%2C70.36l0.39%2C0.31l-0.21%2C0.67l0.57%2C-0.05l0.48%2C0.14l0.25%2C-0.84l0.57%2C0.09l0.37%2C-0.41l0.79%2C0.26l0.09%2C0.5l-0.22%2C0.72l-0.39%2C0.62l-0.07%2C0.94l-0.35%2C0.96l0.4%2C-0.01l-0.04%2C0.62l0.43%2C-0.62l1.27%2C-0.89l0.2%2C0.11l-0.32%2C0.47l-0.62%2C0.66l0.01%2C0.4l1.01%2C-0.28l0.41%2C-0.45l0.22%2C-0.65l0.3%2C-0.31l0.18%2C-0.05l0.17%2C0.44l-0.04%2C0.58l0.26%2C0.37l0.41%2C-1.7l0.56%2C-0.45l0.25%2C0.05l0.1%2C0.43l0.82%2C0.51l0.31%2C1.18l-0.63%2C0.9l-0.59%2C0.23l0.1%2C0.33l-0.34%2C0.55l-0.31%2C0.09l-0.76%2C0.11l-0.69%2C0.4l-0.83%2C0.01l-0.7%2C0.14l0.16%2C0.59l0.55%2C-0.05l0.06%2C0.35l0.39%2C0.41l0.44%2C0.43l0.61%2C0.36l0.04%2C0.45l0.68%2C0.46l-0.15%2C0.49l-0.2%2C0.08l-0.52%2C-0.19l-0.42%2C0.3l-0.43%2C-0.25l-0.17%2C0.41l0.27%2C0.57l0.6%2C-0.12l1.11%2C0.19l0.05%2C-0.3l0.27%2C-0.16l0.63%2C0.11l0.33%2C-0.14l0.19%2C-0.11l0.19%2C0.13l0.32%2C0.33l0.18%2C-0.21l0.18%2C-0.92l0.66%2C-1.14l0.54%2C-0.42l0.31%2C-0.16l0.79%2C-0.45l0.84%2C-0.34l0.36%2C0.05l-0.02%2C1.7l-0.25%2C0.71l-0.91%2C1.33l-1.21%2C0.35l-0.05%2C0.23l0.31%2C0.4l-0.11%2C0.18l-2.14%2C1l-0.39%2C0.35l-0.58%2C0.15l-0.59%2C-0.46l0.13%2C-0.13l-0.11%2C-0.73l-0.15%2C-0.18l-0.46%2C0.02l-0.18%2C0.18l0.19%2C0.19l-0.03%2C0.33l-0.51%2C0.38l0.05%2C0.43l-0.21%2C0.35l-0.65%2C-0.46l-0.52%2C-0.03l-0.14%2C-0.26l-1.4%2C0.06l0.24%2C0.31l-0.6%2C-0.1l-0.27%2C-0.56l-0.15%2C-0.31l-0.32%2C-0.3l-0.36%2C0.36l-0.07%2C0.47l-0.35%2C0.2l0.08%2C0.28l-0.34%2C0.53l-0.5%2C0.2l0.44%2C0.41l0.19%2C-0.24l0.47%2C0.12l0.11%2C0.15L487.02%2C86l0.49%2C0.36l-1.15%2C0.33L484.65%2C86l0.17%2C0.48l-0.1%2C0.38l-1.56%2C0.44l-0.86%2C-0.98L482%2C86.16l-0.23%2C-0.56l-0.44%2C-0.84l0.19%2C-0.42l-1.64%2C-1.02l-0.29%2C-0.33l0.32%2C-0.43l0.54%2C-0.18l1.09%2C-0.74l0.29%2C-0.01l0.66%2C-0.67l0.54%2C-0.24l0.04%2C-0.52l-0.49%2C0.17l-0.36%2C-0.18l-0.52%2C-0.01l-0.05%2C-0.3l-0.34%2C-0.12l-0.57%2C0.59l-0.38%2C0.15l-0.37%2C0.32l-0.97%2C0.35l-0.51%2C0.23l-0.99%2C0.16l-0.57%2C-0.23l-0.24%2C-0.28l-0.45%2C-1.17l0.27%2C-0.39l0.25%2C-0.52l-0.3%2C-0.22l-0.02%2C-0.62l0.57%2C-0.37l0.86%2C-0.23l-0.03%2C-0.34l-0.58%2C-0.3l-0.44%2C-0.42l-0.08%2C-0.26l0.19%2C-0.22l-0.17%2C-0.54l0.92%2C0.42l0.26%2C-0.03l1.95%2C-0.1l0.18%2C0.37l0.33%2C0.11l0.4%2C0.19l0.14%2C-0.01l0.17%2C-0.3l-0.29%2C-0.69l0.11%2C-1.22l0.37%2C0.15l-0.06%2C0.2l0.41%2C0.63l0.26%2C-0.26l0.13%2C-0.46l0.51%2C-0.15l0.96%2C0.23l0.19%2C0.32l-0.43%2C1.11l0.51%2C-0.08l0.6%2C-0.56l0.19%2C-0.05l1.07%2C0.69l1.16%2C1.32l-0.01%2C0.42l0.45%2C-0.06l0.17%2C-0.7l-0.9%2C-0.93l-0.31%2C-0.7l-0.33%2C-0.28l-0.29%2C-0.54l-0.94%2C-0.46l-0.8%2C-0.95l0.05%2C-0.11l0.65%2C0.04l-0.02%2C-0.12l-1.24%2C-0.74l-0.48%2C-0.21l-0.12%2C-0.29l0.5%2C-1l0.22%2C0.12l0%2C0.51l0.35%2C0.33l1.02%2C-1h0.37l0.36%2C-0.24l0.4%2C-0.96l0.22%2C0.13L485.99%2C70.36z%22%2F%3E%0A%09%09%3Cpath%20fill%3D%22white%22%20stroke%3D%22none%22%20id%3D%22NO-04%22%20title%3D%22Hedmark%22%20%20d%3D%22M121.42%2C592.45L121.9%2C592.01L122.36%2C591.17L122.31%2C590.72L122.05%2C590.64L122%2C590.31L122.09%2C590.15L122.49%2C590.08L122.5%2C589.89L122.01%2C589.63L122.38%2C588.78L123.68%2C589.6L123.89%2C589.53L124.56%2C589.1L124.96%2C587.99L124.92%2C587.08L128.19%2C585.48L127.72%2C582.83L126.66%2C578.86L127.05%2C578.46L126.84%2C577.42L127.16%2C577.29L127.5%2C576.7L127.94%2C576.7L128.18%2C575.59L129.08%2C573.4L129.42%2C573.19L129.55%2C572.52L129.94%2C572.49L129.87%2C572.16L130.32%2C571.8L130.75%2C572.65L133.3%2C572.21L135.47%2C572.61L139.43%2C573.7L140.07%2C573.6L140.92%2C572.98L141.7%2C572.99L142.59%2C573.49L142.59%2C574.33L143.13%2C574.59L144.35%2C573.03L147.48%2C572.22L150.36%2C573.68L152.04%2C573.85L152.16%2C574.39L152.66%2C574.53L152.77%2C576.28L153.38%2C577.25L153.54%2C578.44L154.07%2C578.4L154.56%2C578.72L154.75%2C580.33L155.73%2C580.56L155.84%2C580.77L156.92%2C581.37L157.58%2C582.23L159.19%2C583.25L160.24%2C585.12L160.44%2C586.25L161.09%2C587.47L161.78%2C588.33L164.44%2C587.78L164.98%2C589.49L165.62%2C589.46L165.72%2C588.92L166.09%2C588.83L166.4%2C588.17L166.89%2C587.98L171.65%2C588.83L173.55%2C589.57L174.21%2C590.53L175.08%2C591.22L176.13%2C590.99L176.46%2C590.6L176.81%2C590.47L177.13%2C590.56L177.86%2C590.41L177.86%2C590.41L178.86%2C593.46L175.14%2C619.96L178.38%2C624.1L181.63%2C627.78L185.07%2C627.49L192%2C637.7L191.15%2C642.37L190.16%2C645.26L188.23%2C647.85L187.64%2C651.83L187.14%2C652.13L186%2C652.43L182.23%2C652.25L177.62%2C653.68L177.15%2C654.04L179.63%2C659.83L179.67%2C661.62L181.08%2C667.22L183.73%2C671.5L183.84%2C673.45L185.38%2C675.8L185.92%2C677.51L185.91%2C682.48L184.54%2C685.2L183.46%2C686.28L183.63%2C688.58L184.44%2C692.32L183.5%2C696.66L182.31%2C699.41L181.07%2C700.52L179.84%2C702.79L177.41%2C704.46L175.99%2C706.27L175.56%2C706.39L173.22%2C706.43L171.59%2C705.81L170.33%2C706.47L170.06%2C707.05L169.35%2C707.79L168.33%2C708.49L168.33%2C708.49L167.53%2C705.4L167.86%2C703.98L167.29%2C702.9L167.51%2C701.9L168.08%2C701.22L168.24%2C700.25L168.02%2C698.96L167.92%2C698.35L166.91%2C697.07L164.32%2C695.64L163.41%2C694.86L162.47%2C693.29L162.37%2C691.98L162.36%2C690.51L162.7%2C689.63L162.72%2C688.89L160.53%2C687.02L160.07%2C685.83L159.52%2C685.76L158.75%2C685.14L158.02%2C683.44L157.41%2C680.79L157.11%2C680.15L156.09%2C679.75L155.24%2C678.61L154.64%2C678.28L153.85%2C678.11L154.07%2C675.26L152.63%2C673.42L152.63%2C673.42L151.52%2C671.19L151.19%2C670.83L149.01%2C668.91L147.44%2C667.89L146.35%2C666.83L143.46%2C665.3L142.89%2C664.74L142.17%2C663.5L141.99%2C662.89L142.59%2C661.08L142.6%2C660.34L141.76%2C659.15L141.03%2C657L139.91%2C655.49L137.44%2C654.04L136.38%2C652.5L136.31%2C651.89L138.13%2C651.57L139.26%2C650.54L140.49%2C648.55L141.1%2C646.92L142.19%2C645.3L142.66%2C644.86L143.13%2C643.38L145.52%2C641.93L144.85%2C639.42L143.54%2C635.71L141.62%2C632.21L142.18%2C630.81L141.12%2C626.34L140.57%2C620.85L139.17%2C619.13L137.19%2C620.21L136.81%2C620.72L136.29%2C621.08L135.31%2C622.65L132.76%2C620.54L131.26%2C620.22L130.72%2C620.25L127.3%2C618.64L128.95%2C614.76L129.78%2C612.23L128.87%2C612.08L127.12%2C610.42L126.37%2C611.04L126.32%2C612.19L124.26%2C611.36L122.65%2C611.31L122.55%2C611.18L123%2C609.1L122.6%2C607.71L122.35%2C605.83L123.41%2C604.45L124.2%2C604.37L124.13%2C603.27L123.06%2C601.97L121.73%2C601.04L120.59%2C600.5L118.23%2C599.73L116.4%2C597.55L117.22%2C596.77L117.83%2C596.88L118.22%2C596.52L119.83%2C593.46z%22%2F%3E%0A%09%09%3Cpath%20fill%3D%22white%22%20stroke%3D%22none%22%20id%3D%22NO-12%22%20title%3D%22Hordaland%22%20%20d%3D%22M26.89%2C710.15l0.45%2C-0.37l0.38%2C-0.19l0.47%2C0.42l-0.06%2C0.46l0.17%2C0.3l0.82%2C-0.04l0.38%2C0.05l0.8%2C0.83l0.21%2C0.81l-1.05%2C-0.2l-0.42%2C1.44l-0.76%2C0.25l-0.21%2C-0.72l0.32%2C-0.81l-0.41%2C-0.31l0%2C-0.56l-0.05%2C-0.44l-0.7%2C0.13l-0.76%2C-0.02l-0.47%2C-0.66l-0.37%2C-0.51l0.06%2C-0.24l0.6%2C-0.15l0.18%2C0.58L26.89%2C710.15zM27.62%2C714.92l0.3%2C-0.15l-0.1%2C-0.43l-0.14%2C-0.45l-0.18%2C-0.38l-0.71%2C-0.52l-0.56%2C-0.08l-0.19%2C0.64l0.1%2C0.64l0.68%2C0.34l0.57%2C0.3L27.62%2C714.92zM17.15%2C696.77l-0.46%2C-0.72l-0.53%2C-0.68l-0.2%2C0.03l-0.14%2C0.46l0.32%2C0.49l0.28%2C0.98l0.27%2C0.72l0.19%2C1.24l-0.29%2C0.2l-0.31%2C-0.17l-0.06%2C-0.63l-0.14%2C-0.74l-0.04%2C-0.92l-0.13%2C-0.08l-0.32%2C0.68l-0.31%2C0.46l-0.05%2C0.6l0.25%2C0.14l-0.07%2C0.52l0.22%2C0.22l0.18%2C0.17l-0.1%2C0.48l0.39%2C0.53l0.2%2C0.16l0.88%2C-0.04l-0.42%2C0.56l0.35%2C0.28l0.36%2C-0.23l0.43%2C-0.78l0.28%2C-0.88l-0.01%2C-1.4l-0.23%2C-0.73L17.15%2C696.77zM12.01%2C668.2l-0.8%2C-0.67l-0.73%2C-0.02l-0.5%2C-0.31l-1.31%2C-0.65l-0.3%2C0.35l0.37%2C0.66l0.37%2C0.47l-0.2%2C0.74l0.28%2C0.43l0.65%2C0.78l0.47%2C0.48l0.82%2C0.68l0.21%2C0.6l1.48%2C0.51l0.23%2C0.58l0.39%2C0.26l0.8%2C0.15l0.3%2C-0.24l1.72%2C2.15l0.17%2C-0.11l-0.03%2C-0.34l-0.97%2C-2.1l-0.75%2C-0.92l-0.93%2C-0.48l-0.71%2C-0.82l-0.46%2C-0.88l-0.19%2C-0.82L12.01%2C668.2zM19.39%2C699.14l-0.36%2C0.66l0%2C0.38l0.24%2C0.5l0.2%2C0.54l0.83%2C-0.45l0.7%2C-0.12l0.28%2C-0.11l0.11%2C-0.26l0.05%2C-0.53l-0.05%2C-0.69l-0.23%2C-0.57l-0.16%2C-0.66l-0.22%2C-0.25l-0.44%2C-0.16l-0.78%2C-0.12l-0.2%2C0.24L19.39%2C699.14zM21.17%2C701.32l-0.69%2C-0.27l-0.53%2C0.45l-0.17%2C0.33l0.19%2C0.37l0.43%2C0.35l0.73%2C0.26l1.08%2C1.13l0.19%2C-0.52l0.44%2C0.43l0.2%2C0.73l0.48%2C1.46l0.2%2C0.33l0.33%2C0.02l1.17%2C-1.56l0.31%2C0.56l0.4%2C0.49l0.51%2C-0.15l0.12%2C-0.12l-0.15%2C-0.56l-0.06%2C-0.25l-0.56%2C-0.41l0.06%2C-0.35l0%2C-0.68l0.08%2C-0.57l0.54%2C-0.67l0.79%2C-0.79l-0.06%2C-0.6l0.38%2C-1l-0.21%2C-0.69l-0.09%2C-1.29l-0.61%2C-0.27l-0.61%2C0.23l-0.49%2C0.99l-0.37%2C-0.17l-0.12%2C-0.54l-0.97%2C0.29l-1.1%2C0.41l-0.66%2C0.08l-0.36%2C0.43l-0.12%2C0.86l0.1%2C0.43l0.12%2C0.44l0.4%2C0.63l-0.32%2C0.24l-0.18%2C-0.05l-0.28%2C-0.51L21.17%2C701.32zM13.93%2C702.41l0.52%2C0.33l0.65%2C-0.15l1%2C-0.49l0.17%2C-0.38l-0.34%2C-0.53l-0.54%2C-0.81l-0.38%2C0.08l-0.27%2C0.18l-0.5%2C0.34l-0.71%2C0.24l-0.04%2C0.54L13.93%2C702.41zM23.63%2C710.94l-0.05%2C-0.66l-0.34%2C-0.81l0.19%2C-0.93l-0.2%2C-2.1l-0.57%2C-1.16l-0.99%2C-1.09l-0.76%2C-0.48l-0.75%2C-0.56l-0.61%2C-0.5l-0.85%2C-0.35l-0.28%2C0l-0.61%2C0.55l-0.07%2C0.25l0.54%2C0.33l0.34%2C-0.14l0.16%2C0.76l-0.47%2C0.23l0.11%2C0.67l-0.5%2C0.11l-0.43%2C0.88l-0.02%2C0.55l0.62%2C1.15l0.17%2C0.39l0.25%2C1.47l0.2%2C0.93l0.19%2C0.74l0.25%2C0.27l0.41%2C0.15l0.82%2C0.59l0.05%2C0.43l1.22%2C0.21l0.42%2C-0.24l0.51%2C-0.61l0.47%2C-0.45L23.63%2C710.94zM16.73%2C719.65l0.26%2C-0.63l-0.08%2C-0.89l-0.56%2C-0.78l0.53%2C-0.55l0.06%2C-0.27l-0.46%2C0.03l-0.07%2C-0.45l0.37%2C-0.85l0.12%2C-0.76l-0.21%2C-1.57l0.28%2C-0.08l0.35%2C-0.12l0.61%2C0.76l0.07%2C0.27l0.95%2C0.68l-0.01%2C0.3l-0.08%2C0.35l-0.46%2C0.48l-0.32%2C0.42l0.38%2C0.2l0.67%2C-0.32l0.56%2C-0.5l0.31%2C-0.16l0.27%2C-0.65l-0.17%2C-0.07l-0.5%2C-0.22l-0.63%2C-1.5l-0.08%2C-0.51l-0.29%2C-0.42l-0.16%2C-0.79l-0.56%2C-1.15l-0.33%2C-0.38l-0.46%2C-0.07l-0.03%2C-0.53l0.09%2C-0.56l-0.11%2C-0.08l-0.49%2C-0.12l-0.52%2C-0.48l-0.71%2C-0.84l-0.53%2C0.07l0.13%2C1.17l-0.05%2C0.63l-0.23%2C0.33l-0.17%2C0.29l0.02%2C0.26l-0.16%2C0.6l-0.17%2C0.23l-0.51%2C0.67v0.67l0.12%2C0.22l0.17%2C0.35l0.34%2C0.07l0.26%2C-0.16l0.63%2C-0.36l-0.09%2C0.56l0.1%2C0.24l0.57%2C-0.02l0.48%2C0.15l-0.79%2C0.64l-0.48%2C0.85l-0.01%2C0.53l0%2C0.31l-0.04%2C0.37l-0.14%2C0.94l0.09%2C0.87l0.19%2C1l-0.07%2C0.54l0.14%2C0.74l0.14%2C0.69l0.16%2C0.36l0.4%2C-0.06l0.57%2C-0.59L16.73%2C719.65zM20.03%2C675.8L19%2C676.17l0.09%2C0.43l0.45%2C0.48l0.84%2C0.36l0.19%2C0.19l0.92%2C1.33l1.18%2C1.65l0.65%2C0.31l0.77%2C0.07l1.1%2C-0.08l0.4%2C-0.9l0.94%2C-0.87l0.37%2C0.16l0.61%2C0.13l0.07%2C-0.55l-0.39%2C-2.43L27.7%2C674l-0.03%2C-1.71l0.23%2C-1.83l-0.21%2C-1.21l-0.22%2C-0.37l-0.33%2C-0.08l-0.36%2C0.4l-0.21%2C-0.21l-0.35%2C-0.58l-0.98%2C0.73l0.03%2C0.51l0%2C0.72l-0.3%2C1.34l-0.2%2C0.76l-2.08%2C0.58l-0.34%2C0.34l-0.29%2C0.61l-0.24%2C0.63l-0.51%2C0.35l-0.44%2C0.27l-0.47%2C0.31L20.03%2C675.8zM23.48%2C713.47l-0.2%2C-0.1l-0.64%2C0.79l-0.51%2C0.27l-0.28%2C0.27l-0.64%2C0.76l-0.13%2C0.4l-0.46%2C0.7l0.4%2C0.51l0.47%2C0.7l0.6%2C0.56l-0.61%2C0.93l-0.1%2C-0.21l-0.58%2C-0.85l-0.28%2C-1.15l-0.39%2C0.06l-0.47%2C0.36l-0.31%2C0.49l-0.93%2C0.6l0.06%2C0.6l-0.1%2C0.38l-0.58%2C0.4l-0.36%2C1.11l-0.44%2C0.46l-0.35%2C0.45l-0.28%2C0.75l0.05%2C0.64l0.35%2C0.43l0%2C0l1.25%2C1.27l0.66%2C-0.43l0.4%2C-0.51l0.21%2C0.01l0.14%2C0.58l0.62%2C0.03l0.21%2C-0.15l-0.23%2C-0.27l0.18%2C-0.18l1.3%2C-0.31l0%2C0l-0.08%2C-0.46l0.3%2C-0.47l0.36%2C-0.05l0.33%2C0.21l0.17%2C-0.06l0.27%2C-0.27l-0.24%2C-1.17l0.36%2C-0.21l0.33%2C-0.19l0.2%2C-0.4l-0.38%2C-0.93l-0.01%2C-1.15l0.22%2C-1.46l0.05%2C-0.31l0.17%2C-1.19l0.06%2C-1.31L23.48%2C713.47zM32.61%2C694.76l0.33%2C1.65l0.26%2C0.53l0.24%2C0.81l0.63%2C-0.29l0.11%2C-0.46l0.87%2C-0.78l-0.08%2C-0.44l0.58%2C-0.48l0.01%2C-0.84l-0.51%2C-0.69l-0.61%2C-0.28l-0.34%2C0.2L32.61%2C694.76zM14.05%2C662.7l0.43%2C-0.51l0.34%2C-0.05l0.34%2C-0.05l0.57%2C0.2l0.31%2C0.19l0.43%2C0.31l0.26%2C0.13l-0.04%2C-0.36l0.43%2C-0.07l0.46%2C0.57l0.07%2C0.36l0.41%2C0.13l0.32%2C-0.27l0.1%2C-0.63l0.43%2C-0.06l0.3%2C-1.85l0.85%2C-0.45l0.6%2C0.17l1.38%2C-0.55l0.34%2C0.02l0.15%2C0.36l0.54%2C0.18l1.17%2C-0.05l0.53%2C0.12l-0.85%2C0.37l-0.94%2C0.6l-0.33%2C-0.45l-0.14%2C-0.44l-0.4%2C-0.19l-1.28%2C0.55l-0.78%2C-0.12l-0.39%2C0.16l-0.4%2C1.3l0.68%2C0.64l0.04%2C0.23l-0.41%2C-0.08l-0.77%2C0.2l-0.04%2C0.59l-0.25%2C0.2l-0.43%2C-0.08l-0.73%2C1.47l0.05%2C0.42l1.09%2C0.55l0.69%2C0.16l0.45%2C0.28l0.25%2C0.4l0.38%2C0.42l0.45%2C0.65l0.16%2C0.27l0.56%2C0.56l0.62%2C0.76l-0.02%2C0.74l-1.63%2C-1.88l-0.18%2C-0.05l-0.15%2C0.66l-0.2%2C0.55l-0.47%2C0.18l-0.56%2C-1.28l0.4%2C-0.47l-0.91%2C-1.22l-0.79%2C-0.34l-0.38%2C-0.3l-1.52%2C-0.33l-0.91%2C-0.82l-0.42%2C-0.3l-0.65%2C-0.13l-0.55%2C0.07l-0.5%2C-1.04l-0.52%2C-0.66l-0.23%2C-0.16l-0.95%2C0.07l-0.5%2C0.31L10%2C663.62l0.1%2C0.3l0.75%2C0.35l0.73%2C0.42l0.5%2C0.24l0.35%2C0.79l0.25%2C0.59l0.62%2C0.65l0.43%2C0.46l-0.1%2C0.48l0.74%2C0.74l0.83%2C0.45l1.53%2C1.45l-0.21%2C0.9l-0.44%2C0.15l-0.36%2C-0.87l-0.79%2C-0.66l-0.84%2C-0.35l-0.21%2C0.15l-0.02%2C0.2l-0.04%2C0.62l2.13%2C1.7l0.58%2C1.7l0.96%2C1.52l0.15%2C0.59l0.4%2C-0.1l0.36%2C-0.56l0.51%2C-0.35l0.71%2C-0.02l0.51%2C-0.35l0.44%2C-0.72l0.46%2C-0.48l0.36%2C-0.1l0.59%2C-0.58l0.13%2C-0.43l0.63%2C-0.45l0.43%2C-0.12l0.32%2C0.28l0.27%2C-0.01l0.41%2C-0.33l0.31%2C-0.46l0.03%2C-0.77l-0.68%2C-1.92l0.5%2C0.17l0.79%2C-0.28l0.33%2C-0.57l0.62%2C-0.59l0.21%2C-0.16l0.37%2C-0.4l0.27%2C0.12l-0.33%2C0.71l-0.06%2C0.32l0.6%2C0.53l0.56%2C0.08l0.45%2C0.5l0.13%2C1.06l-0.13%2C3.16l-0.29%2C1.58l-0.1%2C1.31l0.31%2C2.83l0.21%2C0.35l-0.18%2C0.72l-0.74%2C0.15l-0.81%2C-0.41l-0.34%2C0.07l-0.3%2C0.21l-0.46%2C1.25l-0.65%2C0.04l-0.67%2C0.17l-0.78%2C0.14l-0.46%2C-0.17l-0.63%2C-0.73l-0.81%2C-0.65l-1.52%2C-2.29l-1.38%2C-0.89l-0.5%2C-0.14l-0.46%2C0.55l-0.37%2C0.44l-0.17%2C1.24l0.32%2C0.78l0.08%2C0.22l0.12%2C0.49l0.14%2C0.73l0.5%2C0.71l0.38%2C0.16l0.02%2C0.2l-0.31%2C0.21l-0.15%2C0.09l-0.63%2C0.2l-0.48%2C0.16l-0.24%2C-0.33L16.3%2C683l-0.38%2C0.25l-0.46%2C0.45l-0.11%2C0.91l-0.13%2C0.66l0.52%2C0.43l0.14%2C0.39l0.03%2C0.77l-0.09%2C0.95l0.32%2C0.83l0.2%2C0.25l0.18%2C0.71l0.42%2C0.47l0.84%2C-0.73l0.95%2C-0.53l0.14%2C0.51l-0.79%2C0.88l-0.22%2C0.49h-0.3l-0.29%2C-0.06l-0.35%2C0.28l0.02%2C0.73l0.54%2C0.01l0.96%2C-0.46l0.49%2C-0.48l0.56%2C-0.17l0.53%2C0.56L20%2C691.43l-0.36%2C0.48l-0.32%2C-0.42l-0.38%2C0.21l-0.14%2C0.62l0.16%2C0.21l0.37%2C0.04l0.59%2C1.29l-0.17%2C0.57l0.08%2C0.15l1.14%2C-0.82l0.05%2C0.71l0.02%2C0.1l0.31%2C0.56l0.3%2C-0.51l0.09%2C-0.57l-0.14%2C-0.58l0.27%2C-0.54l0.32%2C-0.1l0.59%2C-0.32l0.41%2C-0.16l0.41%2C-0.47l0.16%2C-0.37l0.68%2C-1.64l-0.29%2C-0.49l0.04%2C-0.22l1.1%2C-1.05l0.3%2C-1.77l0.06%2C-0.51l0.42%2C-1.82l0.45%2C0.09l0.37%2C0.06l0.69%2C-0.34l0.17%2C-0.27l-0.15%2C-0.51l0.12%2C-0.41l0.17%2C-0.07l0.65%2C0.23l0.17%2C0.19l0.08%2C0.48l-0.42%2C0.64l-1.47%2C1.17l-0.63%2C0.41l-0.08%2C1.39l-0.35%2C1.13l0%2C0.45l-0.99%2C0.5l0.18%2C0.52l-0.16%2C0.67l0.63%2C0.12l0.94%2C-0.56l1.66%2C-0.06l0.3%2C0.29l-1.26%2C0.59l-0.64%2C-0.14l-1.01%2C1.2l-0.7%2C-0.09l0.09%2C1.09l-0.19%2C0.5l-0.25%2C0.62l0.04%2C0.28l0.3%2C0.41l1.22%2C-0.25l0.95%2C-0.66l0.19%2C-0.4l0.61%2C0.01l0.21%2C0.93l0.53%2C0.5l0.31%2C0.6l-0.65%2C0.18l-0.23%2C0.25l-0.16%2C0.57l0.28%2C0.46l1.16%2C0.97l0.3%2C-0.81l0.93%2C0.1l-1.02%2C1.79l-0.62%2C-0.65l-0.33%2C-0.11l-0.54%2C-0.4l-0.21%2C0.15l0.06%2C2.09l0.14%2C1.14l0.43%2C0.04l0.72%2C0.88l0.84%2C0.05l0.44%2C-0.07l0.42%2C-0.3l0.17%2C-0.45l0.87%2C-0.72l0.4%2C-0.75l0.21%2C-0.62l0.06%2C-0.75l-0.06%2C-1l-0.13%2C-1.13L31.85%2C695l0.1%2C-1.03l0.18%2C-0.29l0.3%2C-0.11l0.05%2C0.72l0.58%2C-0.39l0.06%2C-0.91l0.34%2C-0.95l-0.11%2C-0.63l0.96%2C-0.88l-0.08%2C-0.44l0.36%2C-0.8l-0.09%2C-0.53l0.38%2C-0.19l0.36%2C0.45l1.03%2C0.56l0.88%2C-0.06l0.25%2C-0.29l-0.08%2C0.43l0.28%2C0.33l0.33%2C-0.72l0.3%2C-0.15l0.23%2C-0.45l0.2%2C-0.54l-0.28%2C-0.24l-0.18%2C0.09l-0.01%2C-0.78l-0.19%2C-0.37l0.25%2C-0.45l0.9%2C-0.38l0.1%2C-0.38l-0.28%2C-0.47l-0.77%2C-0.15l-0.68%2C-1.01l0.51%2C0.48l0.81%2C-0.3l0.05%2C-0.56l-0.17%2C-0.06l0.11%2C-0.19l0.67%2C0.21l0.44%2C0.49l0.61%2C-0.55l-0.41%2C-0.91l0.56%2C0.52l0.28%2C0.02l1.05%2C-0.39l0.24%2C-0.46l0.34%2C-0.2l0.67%2C0.01l0.23%2C-0.75l0.32%2C-0.11l0.36%2C0.13l0.64%2C-0.24l1.45%2C-1.02l0.3%2C-0.07l0.51%2C0.17l0.94%2C-0.19l0.1%2C-0.6l0.75%2C-0.18l0.21%2C-0.52l0.88%2C-0.86l0.29%2C-0.66l0.34%2C-0.15l-0.54%2C1.12l-0.33%2C0.19l-1.07%2C1.24l0.05%2C0.79l0.5%2C0.09l0.54%2C0.82l0.52%2C-0.06l0.13%2C-0.43l1.16%2C-0.77l-0.04%2C-0.43l0.21%2C-0.24l0.66%2C-0.09l0.84%2C-0.61l0.77%2C-0.08l0.39%2C0.21l0.31%2C-0.19l0.61%2C-1.56l-0.21%2C-0.36l0.08%2C-1.18l-0.12%2C-0.43l0.44%2C-0.36l0.36%2C-0.05l-0.12%2C0.28l-0.43%2C0.29l0.14%2C0.48l-0.15%2C0.7l0.14%2C0.3l1.77%2C-2.35l0.46%2C-0.35l0.17%2C0.08l-1.73%2C2.38l-0.12%2C0.61l-0.81%2C1.22l0.44%2C0.2l0.5%2C-0.42l1%2C-0.26l1.77%2C0.82l1.24%2C-0.58l0.38%2C0.05l-0.18%2C0.21l-0.92%2C0.33l-0.14%2C0.27l-0.28%2C0.08l-0.24%2C0.55l-0.3%2C0.12l-0.66%2C-0.59l-0.83%2C-0.23l-0.36%2C0.03l-0.86%2C0.46l-1.14%2C0.21l-0.73%2C-0.28l-0.58%2C0.02l-0.65%2C1l-0.73%2C0.68l-0.38%2C0.15l-0.46%2C1.14l-0.62%2C0.54l0.39%2C0.86l-0.29%2C0.17l-0.61%2C-0.53l-0.67%2C1.71l-0.17%2C1.72l-0.79%2C1.48l0.16%2C0.97l-0.2%2C0.4l0.14%2C0.42l-0.38%2C0.72l-0.37%2C2.02l-0.43%2C0.67l0.17%2C0.31l-0.19%2C0.61l0.08%2C0.27l-0.36%2C0.86l0.02%2C0.6l-0.23%2C0.63l0.14%2C0.96l-0.18%2C0.26l-0.34%2C-0.39l-0.09%2C-0.63l0.3%2C0.27l-0.18%2C-0.53l0.22%2C-0.64l0.06%2C-1.54l0.25%2C-0.43l-0.14%2C-0.78l0.21%2C-1.18l0.27%2C-0.22l-0.1%2C-0.25l0.2%2C-0.6l-0.19%2C-1.08l0.31%2C-1.22l0.37%2C-0.34l0.43%2C-1.3l-0.14%2C-1.11l0.43%2C-0.41l0%2C-0.86l0.47%2C-0.73l-0.03%2C-0.72l0.58%2C-0.77l-0.03%2C-0.16l-1.24%2C-0.94l-0.85%2C-0.37l-0.43%2C0l-1.24%2C1.49l-0.27%2C0.97l-1.83%2C0.69l-0.71%2C0.05l-0.58%2C-0.17l-0.21%2C0.3l0.17%2C0.38l-0.06%2C0.31l0.53%2C0.38l-0.73%2C0.27l-0.57%2C0.9l-0.73%2C0.49l-0.35%2C-0.1l-1.18%2C0.69l0.45%2C0.16l0.24%2C0.72l-0.41%2C-0.1l-0.02%2C0.75l-0.65%2C0.1l-0.1%2C0.26l0.11%2C0.32l-0.34%2C0.4l0.12%2C0.48l-0.43%2C0.47l-0.33%2C0.12l-0.3%2C-0.29l-0.71%2C0.04l-0.31%2C0.84l-0.47%2C0.56l0.28%2C0.2l-0.05%2C0.37l0.3%2C0.27l0%2C0.34l0.55%2C0.99l0.38%2C0.2l0.44%2C0.54l-0.31%2C0.45l-0.32%2C0.11l-0.07%2C0.28l1.52%2C-0.33l0.99%2C-0.72l0.37%2C-0.42l0.34%2C-1.14l0.46%2C0.02l-0.35%2C0.67l0.01%2C0.64l0.77%2C0.19l0.01%2C0.17l-1.8%2C0.52l-0.72%2C0.6l-0.27%2C-0.08l-1.23%2C0.53l-0.6%2C-0.09l-0.31%2C0.37L35%2C698.11l-0.46%2C0.57l-0.39%2C1.34l-0.44%2C1.17l0.08%2C0.52l0.58%2C0.23l-0.37%2C0.92l-0.82%2C0.8l-0.96%2C-0.4l-1%2C0.73l-0.39%2C0.43l-1.07%2C-0.15l-0.41%2C0.33l-0.43%2C0.66l-0.19%2C0.52l0.2%2C0.81l-0.53%2C0.21l-0.92%2C0.77l-0.42%2C0.34l-0.34%2C0.18l-0.02%2C0.41l0.29%2C0.28l0.13%2C0.11l0.37%2C0.2l0.47%2C-0.04l0.68%2C-0.12l0.37%2C0.03l0.46%2C0.4l0.02%2C0.12l0.47%2C1.19l1.22%2C1.1l0.23%2C0.04l0.76%2C-1.02l0.47%2C-0.1l0.56%2C-0.82l0.54%2C0.12l-0.58%2C0.77l0.02%2C0.38l0.53%2C0.89l0.29%2C0.2l0.76%2C0.33l0.63%2C-0.05l0.44%2C-0.39l0.59%2C-1.1l0.28%2C-0.09l1.15%2C-0.38l0.16%2C-0.42l0.64%2C-0.4l0.64%2C-0.71l2.72%2C-1.03l0.68%2C-1l0.22%2C-0.02l-0.46%2C0.46l-0.14%2C0.55l-0.34%2C0.26l-1.48%2C0.72l-0.58%2C0.05l-0.82%2C1.19l-0.76%2C0.67l-0.86%2C0.3l-0.54%2C1.45l-0.51%2C0.63l-1.19%2C-0.31l-1.16%2C-0.05l-0.87%2C-0.03l-1.19%2C0.23l-0.43%2C0.26l-0.74%2C0.4l-0.65%2C0.77l-1.02%2C1.14l0.23%2C1.82l-0.45%2C-0.2l-2.06%2C-0.88l-0.41%2C-0.07l-0.55%2C0.01l-0.61%2C-0.42l-0.06%2C-0.31l-0.47%2C-0.04l-0.06%2C0.28l-0.63%2C0.67l-0.26%2C0.81l0%2C0.33l-0.01%2C0.51l0.03%2C1.16l0.11%2C0.33l0.12%2C0.54l0.06%2C1.13l-0.18%2C0.29l-0.22%2C0.22l-0.13%2C0.34l0%2C0l0.36%2C0.31l0.85%2C-0.05l0.92%2C-0.56l0.25%2C-0.28l-0.36%2C-0.81l0.77%2C-0.75l0.96%2C0.3l0.12%2C0.57l1.51%2C-0.24l0.77%2C0l0.69%2C0.2l0.41%2C-0.68l1.11%2C-1.14l0.47%2C-0.06l0.88%2C0.45l0.06%2C0.81l2.15%2C-0.73l0.56%2C0.08l0.75%2C0.4l0.94%2C0.09l0.53%2C-0.12l0.21%2C-0.99l-0.24%2C-0.63l0.07%2C-0.4l0.54%2C-0.98l0.28%2C-1.07l1.05%2C-1.07l0.13%2C-0.31l-0.15%2C-0.67l0.68%2C-1.72l0.81%2C-0.08l0.1%2C-0.61l3.02%2C-1.58l1.86%2C-1.32l1.13%2C0.31l0.99%2C-0.17l0.45%2C-0.24l0.6%2C0.2l0.31%2C0.5l-0.15%2C1.3l-0.17%2C0.16l0.14%2C1.38l-0.78%2C2.66l0.37%2C0.42l0.5%2C0.21l1.66%2C-0.44l1.8%2C-1.27l3%2C-1.72l2.94%2C-0.57l0%2C0l1.1%2C-1.41l-0.02%2C-0.33l0.36%2C-0.51l-0.4%2C-1.19l0.43%2C-0.67l-0.31%2C-0.38l0.39%2C-1.12l-0.52%2C-0.12l1.57%2C-3.04l1.39%2C-1.32l1.09%2C-0.26l1.35%2C-0.06l0.86%2C-0.65l0.2%2C-0.34l-0.03%2C-0.76l0.28%2C-1.34l1.11%2C-1.26l0%2C0l2.14%2C-3.79l0.64%2C-3.34l1.49%2C-2.32l0.13%2C-4.06l1.12%2C-6.37l-0.43%2C-0.35l-0.63%2C-0.15l-1.03%2C-1.34l-0.4%2C-2.2l0.3%2C-1.24l-1.73%2C-1.13l-1.22%2C0.04l-1.81%2C-0.31l0.57%2C-0.46l0%2C0l-2.01%2C-0.01l-3.25%2C-0.89l-0.7%2C-0.05l-0.47%2C0.48l-0.87%2C0.09l-0.88%2C-0.96l-0.61%2C0.07l-1.9%2C-0.34l0.05%2C-1.01l-0.74%2C-4.82l-1.99%2C-0.61l-0.57%2C0.15l-0.85%2C0.56l-1.93%2C-0.1l-0.09%2C-0.2l1.06%2C-1.61l0.66%2C-0.15l0.64%2C-0.48l0.08%2C-0.43L53%2C658.69l-0.32%2C-0.07l0.04%2C-0.3l-0.17%2C-0.15l-1.05%2C0.61l-0.14%2C-1.15l-0.77%2C0.13l-0.23%2C-0.69l-0.44%2C-0.51l-0.52%2C0.09l-0.01%2C1.21l-1.37%2C0.59l-0.6%2C0.85l-0.71%2C0.33l-0.49%2C-0.61l-0.51%2C-0.27l0.21%2C-0.8l-0.38%2C-0.96l-0.54%2C0.2l-0.65%2C0.83l-0.38%2C0.12l-0.88%2C-0.19l-2.02%2C2.32l-1.95%2C-1.54l-1.19%2C-0.31l-0.52%2C-0.84l0.23%2C-2.08l-0.44%2C-0.45l-1.12%2C-0.37l-0.67%2C-1.33l-0.59%2C-0.33l-1.75%2C1.2l-0.41%2C-0.01l-0.39%2C0.51l-0.8%2C2.02l-0.67%2C-0.07l-1.32%2C-1.4l-1.33%2C0.45l-0.72%2C0.86l-0.75%2C-0.2l-0.62%2C-0.75l-0.5%2C0.03l-0.95%2C0.74l-0.96%2C1.17l-0.74%2C0.52l-0.63%2C0.18l-0.25%2C-0.71l-1.13%2C0.48l-0.89%2C0.66l-1.16%2C-0.16l-0.68%2C-1.1l-0.52%2C-0.02l0.07%2C0.31l-0.24%2C0.23l-1.24%2C0.34l-0.47%2C0.55L15%2C659.38l-0.22%2C0.75l-0.74%2C1.39l-0.11%2C1.15l0%2C0L14.05%2C662.7zM16.68%2C681.36l-0.1%2C-1.15l0.03%2C-0.35l-0.28%2C-0.82l-0.27%2C-0.34L15%2C677.82l-0.65%2C-0.26l-0.94%2C-0.6l-0.51%2C0.18l-0.78%2C-0.48l-0.31%2C-0.28l-0.74%2C-0.52l-0.26%2C0.26l0.03%2C0.54l0.37%2C0.08l0.32%2C1.01l0.59%2C0.4l0.32%2C0.28l0.29%2C-0.41l0.3%2C0.2l-0.04%2C0.33l0.06%2C0.6l-0.18%2C0.56l0.02%2C0.58l-0.06%2C0.49l0.15%2C0.09l1.65%2C-0.23l0.48%2C0.25l-0.36%2C0.48l-0.35%2C0.15l0.15%2C0.72l0.26%2C0.18l0.58%2C0.32l0.38%2C0.17l1.1%2C-0.84L16.68%2C681.36zM14.96%2C691.71l0.06%2C-0.48l-1.13%2C-2.34l0.37%2C-0.25l0.15%2C-0.24l-0.13%2C-0.99l0.11%2C-1.03l0.29%2C-0.55l0.28%2C-1.33l-0.2%2C-1.24l-0.46%2C-0.34l-0.56%2C-0.14l-0.2%2C0.32l-0.22%2C0.28l-0.27%2C0.35l-0.46%2C0.12l-0.04%2C-0.56l-0.14%2C-0.23l-0.29%2C-0.33l-0.53%2C-0.33l-0.36%2C-0.59l0.39%2C-0.54l-0.53%2C-0.59l-0.6%2C-0.05l0.01%2C-0.28l-0.06%2C-1.58l-0.21%2C-0.53l-0.36%2C-0.08l-0.2%2C0.34l-0.08%2C0.4l-0.02%2C0.55l0.64%2C2.04l0.34%2C1.07l-0.17%2C0.8l0.28%2C0.76l0.2%2C1.17l0.73%2C2.32l-0.52%2C0.49l-0.41%2C-0.21l-0.07%2C-0.61l-0.59%2C-0.05l-0.01%2C1.27l0.51%2C1.17l0.23%2C0.41l-0.01%2C0.62l0.47%2C0.82l1.13%2C0.24l1.07%2C1.5l0.4%2C-0.11l0.48%2C-0.09l0.25%2C-0.19l0.34%2C-0.39L14.96%2C691.71zM7.67%2C674.1l0.1%2C-0.61l0.2%2C-0.56l0.06%2C-0.25l-0.72%2C-1.39l-0.08%2C-0.51l-0.32%2C-0.52l-0.4%2C-0.31l-0.24%2C0.86l0.24%2C2.27l0%2C0.89l0.24%2C0.06l0.32%2C-0.08l0.48%2C0.35L7.67%2C674.1zM9.41%2C678.45l0.27%2C-0.51l-0.24%2C-0.45l-0.23%2C-0.82l-0.23%2C-0.35l-0.24%2C-0.5l-0.28%2C-0.45l-0.15%2C-0.33l-0.15%2C-0.75l-0.75%2C0.44l-0.16%2C0.29l0.04%2C0.87l0.11%2C0.19l0.45%2C-0.19l0.09%2C0.69l-0.02%2C0.8l0.13%2C0.06l0.31%2C-0.39l0.61%2C0.75L9.41%2C678.45zM16.2%2C675.58l-1.52%2C-1.7l-1.22%2C-0.31l-0.51%2C-0.17l-0.63%2C-0.59l-1.42%2C0.33l-0.5%2C-0.42l-0.44%2C-0.02l0.13%2C0.55l0.76%2C0.63l0.69%2C0.53l-0.49%2C0.47l0.55%2C0.61l0.65%2C0.63l0.68%2C0.27l0.42%2C-0.09l1.29%2C0.51l1.05%2C0.75l0.76%2C0.31l0.29%2C-0.11l0.18%2C-0.36l0.04%2C-0.74L16.2%2C675.58zM8.32%2C665.39L8.3%2C665.8l1.64%2C0.99l0.46%2C0.49l0.54%2C-0.03l0.06%2C-0.06l-0.12%2C-0.62l-0.41%2C-1.07l-0.28%2C-0.59l-0.69%2C-0.71l-0.14%2C-0.81l-0.24%2C0.16l-1.01%2C0.29L8%2C664.84L8.32%2C665.39z%22%2F%3E%0A%09%09%3Cpath%20fill%3D%22white%22%20stroke%3D%22none%22%20id%3D%22NO-15%22%20title%3D%22M%C3%B8re%20og%20Romsdal%22%20%20d%3D%22M39.44%2C572.76l-0.02%2C-0.47l0.56%2C0.12l0.45%2C0.17l0.21%2C-0.15l1.24%2C0.58l0.43%2C0.52l0.03%2C0.34l-0.34%2C0.5l-0.29%2C0.05l-0.98%2C-0.42l-0.43%2C-0.38l-0.23%2C-0.52L39.44%2C572.76zM42.59%2C572.09l0.98%2C0.59l0.61%2C-0.34l0.11%2C-0.35l-0.18%2C-0.47l-0.26%2C-0.18l-0.47%2C0.01l-0.93%2C0.33l-0.93%2C0.04l0.21%2C0.2L42.59%2C572.09zM77.05%2C550.67l-0.13%2C-0.26l-0.58%2C-0.54l-0.32%2C0.15l-0.29%2C0.04l-0.63%2C0.45l-0.7%2C-0.01l-0.23%2C-0.18l-0.05%2C-0.23l-0.19%2C0.09l-0.34%2C0.08l-0.48%2C0.09l-0.09%2C0.25l0.02%2C0.3l-0.06%2C0.25l0.61%2C0.39l0.77%2C0.02l0.83%2C0.07l1.68%2C-0.27l0.21%2C-0.18L77.05%2C550.67zM52.69%2C566.74l0.15%2C0.15l0.77%2C0.52l0.47%2C0.43l0.56%2C0.34l0.57%2C0.06l0.23%2C-1.03l-0.43%2C-0.09l-0.09%2C-0.42l0.34%2C-0.38l0.29%2C-0.16l0.68%2C-0.49l-0.21%2C-0.62l0.42%2C-0.68l-0.07%2C-0.13l-0.49%2C-0.35l-0.62%2C0.14l-0.77%2C0.53l-0.21%2C0.47l-0.3%2C0.05l-0.49%2C-0.79l-0.45%2C-0.13l-0.43%2C0.15l-0.53%2C0.38l0.34%2C0.63l0.53%2C0.18l-0.01%2C0.37l-0.53%2C0.01l-0.47%2C0.09l-0.18%2C0.56L52.69%2C566.74zM44.53%2C569.36l-0.7%2C0.44l0.27%2C0.48l0.3%2C0.36l0.28%2C0.09l0.34%2C-0.25l0.46%2C-1.08l-0.39%2C-0.68l-0.04%2C-0.39l0.17%2C-0.2l-0.12%2C-0.48l-0.11%2C0.03l-0.49%2C0.11l-0.06%2C0.39l-0.5%2C0.29l-0.24%2C0.36l0.83%2C0.23L44.53%2C569.36zM48.17%2C574.22l0.82%2C-0.04l0.57%2C-0.26l-0.59%2C-0.6l0.04%2C-0.77l0.12%2C-0.5L49.01%2C572l-0.68%2C0.31l-0.29%2C0.3l-0.2%2C0.45l-0.44%2C0.77l-0.25%2C0.6l0.55%2C0.11L48.17%2C574.22zM49.33%2C572.89l0.36%2C0.28l0.19%2C0.41l-0.07%2C0.33l2.73%2C-1.15l2.97%2C-1.03l0.29%2C-0.27l-0.27%2C-1.51l-0.19%2C-0.5l-1.61%2C0.66l-0.95%2C0.2l-1.51%2C0.41l-0.29%2C0.33l-0.16%2C-0.74l0.08%2C-0.33l-0.39%2C0l-0.73%2C0.55l-0.05%2C0.57l0.36%2C0.33l0.12%2C0.26l0%2C0.32l-0.54%2C0.32L49.33%2C572.89zM73.41%2C556.13l-0.47%2C-0.2l-0.23%2C-0.56l-0.03%2C-0.42l-0.02%2C-1.07l0.09%2C-0.54l-0.16%2C-0.48l-0.12%2C-0.47l0.23%2C-0.53l-0.44%2C-0.18l0.07%2C-0.23l0.2%2C-0.25l-0.06%2C-0.29l-0.48%2C-0.1l-0.22%2C-0.08l-0.79%2C0.3l-0.08%2C0.64l0.44%2C0.05L71.7%2C552l-0.02%2C0.39l-0.03%2C0.15l-0.52%2C0.02l-0.04%2C0.08l-0.49%2C-0.26l-0.26%2C-0.11l-0.41%2C0.26l-0.02%2C0.26l0.23%2C0.09l0.02%2C0.22l-0.2%2C0.38l0.12%2C0.13l0.56%2C-0.03l-0.03%2C0.34l-0.46%2C0.36l0.03%2C0.17l0.13%2C0.15l0.34%2C0.19l-0.13%2C0.46l0.28%2C0.43L70.69%2C556l-0.1%2C0.11l-0.32%2C0.12l-0.01%2C-0.15l0.01%2C-0.17l-0.12%2C-0.5L69.84%2C555l-0.09%2C-0.27l-0.11%2C-0.29L69%2C554.41l0.11%2C-0.42l-0.19%2C-0.25l-1.11%2C0.11l-0.24%2C0.27l-0.6%2C0.22l-0.02%2C0.27l0.02%2C0.31l0.06%2C0.23l-0.46%2C0.31l0.47%2C0.24l0.63%2C-0.2l0.15%2C0.21l-1.09%2C0.42l-0.23%2C0.23l-0.93%2C0.69l-0.39%2C0.51l0.56%2C0.56l1.03%2C0.17l1.46%2C0.72l0.17%2C0.68l0.14%2C0.46l1.29%2C-0.48l2.09%2C-1.57l2.07%2C-1.16L73.41%2C556.13zM86.42%2C543.53l-0.08%2C0.49l-0.21%2C0.71l0.22%2C0.48l0.28%2C0.78l0.97%2C1.14l0.5%2C1.27l0.54%2C0.31l1.15%2C0.06l1.46%2C0.06l1.56%2C-0.66l0.65%2C-0.51l-0.13%2C-1.08l-0.89%2C-1.13l-0.55%2C-0.04l-0.62%2C-0.66l-0.14%2C-1.05l-0.31%2C-0.59l-0.31%2C-0.71l-0.16%2C0.02l-0.87%2C0.36l-0.53%2C0.25l-0.64%2C0.53l-0.83%2C-0.02l-0.45%2C-0.78L86.1%2C543l-0.21%2C0.22L86.42%2C543.53zM76.64%2C556.7l-0.25%2C0.09l-0.76%2C0.47l-0.49%2C0.91l0.67%2C0.32l1.23%2C-0.45l-0.21%2C-1.11L76.64%2C556.7zM81.04%2C549.31h1.4l1.24%2C-0.27l0.84%2C-0.11l-0.16%2C-1.2l-0.39%2C-0.94l-0.27%2C-0.64l-0.19%2C-0.47l-0.14%2C-0.38l-0.18%2C-0.58l0.01%2C-0.18l-0.47%2C0.09l-1.78%2C1.4l-0.39%2C0.26l-1.19%2C0.41l-0.87%2C0.53l-0.27%2C0.51l0.6%2C0.52l0.23%2C0.71l0.11%2C0.26l0.56%2C0.12L81.04%2C549.31zM95.97%2C539.5l0.06%2C-0.33l0%2C-0.32L96%2C538.58l-0.66%2C-0.1l-0.43%2C-1l-1.02%2C-0.03l-0.16%2C-0.4l-0.42%2C-0.12l-1.29%2C0.44l-0.36%2C0.34l0.05%2C0.13l0.12%2C0.58l-0.39%2C0.24l-0.87%2C1.14l-0.08%2C0.06l-0.45%2C0.05l-0.43%2C0.15l-0.21%2C0.09l-0.52%2C0.2l-0.56%2C0.82l0.21%2C0.21l0.3%2C0.15l1.67%2C-0.16l0.5%2C-0.23l0.14%2C-0.39l0.02%2C-0.41l0.03%2C-0.06l1.52%2C0.2l0.09%2C-0.1l-0.24%2C-0.22l-0.49%2C-0.69l0.71%2C-0.05l0.39%2C0.35l0.02%2C0.33l0.03%2C0.21l-0.03%2C0.47l0.75%2C0.02l0.87%2C-0.54L95.97%2C539.5zM75.27%2C537.91l0.58%2C0.1l0.42%2C-0.09l-0.1%2C0.73l0.34%2C0.04l0.48%2C0.05l0.93%2C0.21l0.29%2C0.18l0.45%2C0.32l0.65%2C0.68l0.9%2C0.39l0.44%2C0.01l0.54%2C-0.07l0.55%2C-0.09l0.59%2C-0.11l0.35%2C-0.26l1.35%2C-0.54l0.45%2C-0.59l0.12%2C-0.4l0.26%2C-0.4l0.09%2C-0.27l-0.14%2C-0.63l-0.01%2C-0.1l0.03%2C-0.26l-0.3%2C-0.18L84.06%2C536l-0.25%2C-0.78l0.08%2C-0.29l-0.45%2C-0.79l-0.67%2C-0.92l-0.45%2C-0.28l-0.25%2C0.24l-0.57%2C0.09l-0.58%2C-0.06L80.63%2C533l-0.36%2C0.06l-0.47%2C0.02l-0.12%2C0.34l-0.06%2C0.11l-0.5%2C0.44l-0.15%2C0.11l-0.36%2C0.4l-0.59%2C-0.17l-0.35%2C0.26l-0.35%2C0.01l-0.45%2C-0.06l-0.23%2C0.7l-0.56%2C0.09l-0.25%2C0.12l-0.1%2C0.23l-0.29%2C0.12l-0.07%2C0.39l0.57%2C0.32l-0.17%2C0.38l-0.44%2C0.32l-0.19%2C0.33L75.27%2C537.91zM77.41%2C551.85l-0.61%2C-0.16l-1.44%2C0.23l-0.02%2C0.34l-0.1%2C0.3l-0.5%2C0.04l-0.47%2C-0.29l-0.9%2C0.5l-0.02%2C0.47l-0.14%2C0.94l-0.08%2C0.74l0.8%2C0.3l0.51%2C0.22l1.36%2C0.24l0.2%2C-0.55l0.88%2C-0.61l0.41%2C-0.49l0.26%2C-0.59l0.1%2C-0.4l0.08%2C-0.88L77.41%2C551.85zM84.88%2C540.46l-0.64%2C0.56l-0.31%2C0.22l0%2C0l-0.68%2C0.79l-0.47%2C0.25l-0.15%2C0.42l1.55%2C-0.76l0.92%2C-0.74l0.11%2C-0.48l-0.1%2C-0.23L84.88%2C540.46zM87.32%2C547.35l-0.61%2C-0.61l-0.79%2C-0.61l-0.33%2C-1.18l-0.32%2C-0.58l-0.52%2C-0.2l-0.17%2C-0.11l-0.29%2C0.03l-0.4%2C0.09l-0.27%2C0.57l0.17%2C0.28l0.5%2C0.13l0.1%2C0.32l-0.27%2C0.2l0.35%2C0.66l0.17%2C1.83l0.29%2C0.74l1.58%2C-0.41l0.71%2C0.07l0.53%2C-0.16L87.32%2C547.35zM43.36%2C581.36l-0.79%2C-0.03l-0.26%2C0.23l-0.5%2C-0.04l-0.43%2C-0.49l-0.79%2C0.07l-0.65%2C0.11l-0.18%2C0.04l-0.22%2C0.45l-1.19%2C0.26l-0.33%2C0.38l0.74%2C0.03l1.64%2C-0.1l0.42%2C0.24l1.46%2C-0.42l0.78%2C0l1.42%2C-0.6l0.41%2C-0.37l-0.42%2C-0.17L43.36%2C581.36zM22.29%2C590.52l-0.06%2C0.37l0.2%2C0.05l1.34%2C-0.75l0%2C0l1.43%2C-1.11l-0.4%2C-0.38l-0.56%2C0.08L24%2C588.37l0.11%2C-0.38l-0.48%2C0.08l-0.95%2C0.5l0.62%2C0.4l-0.71%2C0.64l-0.51%2C0.62L22.29%2C590.52zM28.39%2C591.45h-0.71l-0.12%2C0.54l-0.58%2C-0.38l-0.81%2C0.05l-0.8%2C0.26l-1.06%2C0.1l-0.46%2C0.48l-0.04%2C0.76l0.24%2C0.55l-0.69%2C0.01l0.14%2C0.64l0.91%2C0.57l0.96%2C0.14l-0.64%2C0.39l-0.93%2C-0.5l-0.36%2C0.2l-0.03%2C0.23l0.85%2C0.92l0.24%2C0.43l0.31%2C0.4l0.48%2C0.09l2.92%2C-0.83l0.76%2C-0.05l1%2C-1.18l-0.06%2C-0.64l-0.48%2C-0.02l-0.13%2C-0.43l0.47%2C-0.45l0.54%2C-0.69l0.05%2C-0.3l-0.04%2C-0.41L30%2C592.32l-0.5%2C-0.12l-0.46%2C0.1l-0.83%2C0.3l0.11%2C-0.88L28.39%2C591.45zM20.58%2C594.63l1.08%2C0.22l0.43%2C-0.05l0.52%2C0.29l-0.1%2C-0.66l-0.05%2C-0.3l-0.15%2C-0.59l-1.09%2C-0.2l-0.5%2C0.13l-0.54%2C0.43L20.58%2C594.63zM26.55%2C589.47l-0.62%2C0.19l-0.67%2C0.13l-0.4%2C0.58l1.15%2C0.58l0.34%2C-0.15l0.68%2C-0.02l1.13%2C-0.12l0.09%2C-0.37l0.1%2C-0.88l0.12%2C-0.59l-0.12%2C-0.37l-0.53%2C0.04l-1.18%2C0.56L26.55%2C589.47zM62.52%2C573.27l-0.31%2C0.47l0.36%2C0.63l0.9%2C0.22l1.03%2C0.01l1.65%2C-0.65l-0.43%2C-0.34l-1.3%2C-0.06l-0.48%2C-0.48L63.34%2C573L62.52%2C573.27zM114.73%2C556.07l-0.34%2C-0.57l-0.3%2C-0.01l0.08%2C-0.69l-1.09%2C-0.2l-0.12%2C-0.36l0.2%2C-0.68l-0.01%2C-1.47l0.53%2C-2.28l-0.17%2C-1.05l0.26%2C-0.81l-1.35%2C-0.38l-0.66%2C-0.36l-0.4%2C-1.23l-1.3%2C1.06l-0.38%2C-0.24l-0.76%2C-0.07l-0.13%2C-0.32l-0.34%2C-0.04l-0.96%2C1l-1.05%2C0.75l1.21%2C1.92l-0.53%2C0.29l-1.76%2C0.1l-1.44%2C-0.95l-1.74%2C0.39l-0.86%2C0.67l-0.25%2C0.12l-0.32%2C-0.1l-0.42%2C0.27l-1.61%2C-0.54l0.34%2C-1.09l-1.58%2C-1.19l-0.01%2C-0.29l0.07%2C-0.34l1.6%2C-0.46l0.6%2C-0.75l0.03%2C-0.4l-0.94%2C-1.88l0.79%2C-1.33l0.28%2C-0.78l0.1%2C-1.63l0.65%2C-1.03l-0.1%2C-0.34l-0.5%2C-0.29l-0.86%2C-0.17l-0.61%2C-0.1l-0.13%2C-1.73l-0.8%2C-0.66l-0.25%2C-0.57L97%2C535.5l-0.59%2C0.15L95.24%2C536L95%2C536.39l0.17%2C0.45l0.23%2C0.26l0.75%2C1.11l0.23%2C0.41l0.59%2C0.45l0.31%2C0.18l0.09%2C0.17l-0.66%2C0.61l-0.75%2C0.22l-0.69%2C0.41l-1.4%2C0.3l-1.24%2C0.26l-0.56%2C0.34l0.25%2C0.43l-0.09%2C0.1l-0.35%2C0.09l-0.42%2C-0.02l-0.03%2C0.8l0.52%2C-0.1l0.2%2C0.24l0.06%2C0.81l0.58%2C0.03l0.15%2C0.4l0.54%2C1.16l1.01%2C1.9l0.56%2C-0.09l0.73%2C-0.28l0.48%2C0.1l-0.07%2C0.38l-2.08%2C0.76l-0.88%2C0.1l-0.61%2C0.53l0.22%2C0.72l1.08%2C0.77l0.17%2C0.21l0.19%2C0.22l0.2%2C0.23l0.13%2C0.63l-0.16%2C0.33l-0.45%2C-0.33l-0.82%2C-0.96l-0.64%2C-0.86l-0.24%2C-0.02l-0.75%2C-0.06l-0.95%2C-0.05l-1.91%2C0.28l-0.89%2C-0.91l-0.56%2C0.17l-1.49%2C0.25l-1.68%2C0.63l-0.28%2C0.4l-0.06%2C0.41l0.11%2C0.38l0.44%2C0.29l-0.04%2C0.65l0.57%2C0.46l0.64%2C0.54l-0.36%2C1.65l0.12%2C0.39l0.9%2C0.55l1.05%2C0.52l1.09%2C-0.66l0.62%2C0.1l1.16%2C0.21l0.98%2C-0.32l0.46%2C0.15l-0.86%2C0.49l-1.56%2C-0.04l-1.04%2C0.1l-0.59%2C0.78l0.6%2C0.28l0.68%2C1.01l1.08%2C-0.41l3.23%2C-2.24l0.74%2C-0.07l-0.04%2C0.15l-1.68%2C1.12l-1.19%2C0.67l-0.16%2C0.71l0.51%2C-0.08l0.4%2C0.19l1.47%2C-0.91l0.79%2C-0.25l0.96%2C-0.07l0.19%2C0.04l0.08%2C0.93l-1.57%2C0.3l-0.96%2C0.47l-0.7%2C0.09l-1.26%2C0.1l-0.52%2C0l-0.27%2C0.24l0.19%2C0.7l0.61%2C0.54l0.16%2C0.84l1.39%2C0.99l0.36%2C0l1.13%2C0.07l0.19%2C0.08l0.66%2C0.92l0.07%2C0.94l0.11%2C0.43l1.49%2C0.35l0.03%2C0.52l-0.34%2C0.06l-1.06%2C-0.41l-0.61%2C-0.66l-0.31%2C-0.43l-0.39%2C-0.86l-1.47%2C0.17l-0.37%2C-0.24l-0.26%2C-0.49l-0.89%2C-0.34l-0.71%2C-0.77l-0.1%2C0.04l0.15%2C0.44l0.75%2C0.96l1.25%2C0.75l0.14%2C0.67l-0.19%2C0.32l-0.22%2C0.09l-0.8%2C-0.48l-0.4%2C-0.22l-0.74%2C-1.12l-0.88%2C-0.81l-0.7%2C-0.21l-0.52%2C-1.14l-0.72%2C-0.66l0.92%2C-1.3l0.09%2C-0.56l-1.33%2C-1.02l-0.44%2C-0.58l-0.86%2C-0.73l-0.74%2C-0.29l-0.73%2C-0.68l-0.5%2C-0.46l-0.07%2C-0.41l-0.08%2C-0.15l0.01%2C-0.25l-0.03%2C-0.43l0.42%2C-0.61l-0.09%2C-0.65l-0.23%2C-0.38l-0.4%2C-0.81l-0.23%2C-0.13l-0.8%2C-0.06l-2.15%2C1.04l-0.25%2C0.7l0.25%2C0.7l-0.02%2C0.67l-0.36%2C0.36l-0.82%2C-0.05l-0.49%2C0.47l-0.46%2C0.61l0.06%2C0.53l-0.06%2C0.27l-0.1%2C0.64l0.22%2C0.55l0.2%2C0l1.66%2C-0.99l1.2%2C0.42l1.1%2C1.27l0.58%2C0.54l0.43%2C0.54l0.54%2C0.33l0.43%2C1.15l-0.51%2C0.35l0.02%2C0.17l0.45%2C0.18l1.02%2C-0.2l0.2%2C0.21l-1.19%2C0.83l0.3%2C0.96l0.18%2C1.13l0.48%2C1.12l1.33%2C0.92l0.64%2C0.16l0.87%2C0.12l0.66%2C0.98l1.04%2C0.35l1.23%2C1.04l1.9%2C1.14l0.49%2C0.78l0.13%2C0.98l-0.09%2C0.64l-0.01%2C0.69l-0.45%2C0.16l-0.29%2C-0.33l-0.37%2C-0.97l-0.4%2C-1.31l-0.41%2C-0.44l-0.81%2C-0.09l-0.68%2C-0.66l-0.45%2C-0.51l-1.14%2C-0.53l-1.34%2C-0.7h-0.45l-0.34%2C-0.24l-0.93%2C-0.75l-1.35%2C-1.02l-0.76%2C-2.16l-0.39%2C-1.35l0.36%2C-1.88L82%2C560.22l-0.45%2C-1.05l-0.6%2C-0.7l-1.35%2C-0.32l-1.33%2C0.48l-1.05%2C0.4l-0.82%2C0.26l-2.76%2C1.95l-0.81%2C0.86l-0.07%2C-0.34l0.66%2C-0.95l1.98%2C-1.95l-0.52%2C-0.57l-0.54%2C0.16l-0.75%2C-0.27l-0.7%2C0.14l-2.13%2C1.92l-0.15%2C0.31l-1.24%2C0.75l-1.15%2C0.29l-0.42%2C0.36l-0.31%2C-0.22l0.09%2C-0.51l-0.21%2C-1.02L66%2C558.94l-1.56%2C-0.82l-0.1%2C-0.46l0.21%2C-0.54l-0.18%2C-0.73l-0.08%2C-0.36l-1.75%2C0.44l-1%2C0.5l-1%2C-0.2l-0.23%2C0.15l-0.47%2C0.12l-0.31%2C0.13l-0.29%2C0.23l0.17%2C0.42l-1.39%2C0.42l-0.19%2C0.15l-0.38%2C0.57l-0.46%2C0.38l-0.26%2C0.59l-0.16%2C0.14l-1.88%2C1.25l0.28%2C0.28l0.31%2C0.24l0.82%2C0.26l0.45%2C0.02l-0.26%2C0.9l0.75%2C0.08l-0.18%2C0.28l0.02%2C0.34l0.39%2C0.12l0.12%2C0.32l-0.06%2C0.28l-0.46%2C0.36l0.12%2C0.38l0.43%2C-0.26l1.19%2C0.06l0.78%2C-0.45l0.68%2C-0.17l0.97%2C0.03l0.07%2C0.17l0.61%2C0.71l-0.53%2C0.4l0.64%2C0.61l-0.57%2C0.4l-0.39%2C-0.13l-0.17%2C-0.64l-1.01%2C0.26l-0.21%2C-0.24l0.04%2C-0.4l-0.14%2C-0.23l-0.6%2C0.12l-0.37%2C0.13l-0.3%2C0.19l-0.62%2C0.26l-0.5%2C0.68l-0.41%2C0.64l-0.14%2C0.69l0.55%2C1.3l-0.52%2C0.91l0.25%2C0.58l0.8%2C-0.03l1.26%2C-0.47l1.15%2C-0.07l0.64%2C0.15l2.18%2C-0.51l0.61%2C-0.12l0.93%2C-0.36l1.75%2C-0.31l2.57%2C-1.18l1.32%2C-0.17l1.79%2C-0.5l0.83%2C0.03l-0.37%2C0.41l-0.64%2C0.19l-2.31%2C0.43l-0.73%2C0.51l-2.98%2C1.47l0.2%2C0.25l0.51%2C0.51l0.33%2C0.69l-0.67%2C0.04l-0.77%2C0.47l0.29%2C0.25l1.25%2C0.02l0.85%2C0.31l1.16%2C-0.17l4.34%2C-2.06l3.07%2C-1.04l1.19%2C-0.67l1.59%2C-0.41l0.6%2C-0.01l2.35%2C-0.32l-0.01%2C0.27l-1.09%2C0.5l-0.12%2C0.5l0.73%2C0.65l0.7%2C0l0.51%2C0.32l0.67%2C0.98l0.25%2C1.31l-0.03%2C0.16h-0.41l-0.51%2C-0.78l-0.44%2C-0.54l-0.75%2C-0.45l-0.95%2C-1.08l-1.09%2C-0.3L78.59%2C570l-0.88%2C0.2l-1.45%2C0.15l-2.88%2C1.19l-2.6%2C1.38l-2.22%2C0.89l0.79%2C1.92l0.23%2C0.53l0.11%2C1.03l-0.21%2C0.37l-0.68%2C0.04l0.11%2C-1.21l-0.38%2C-0.51L68%2C574.86l-1.44%2C0.45l-0.24%2C0.22l0.41%2C1.54l0.71%2C0.75l0.44%2C-0.12l-0.18%2C0.56l0.46%2C0.44l0.82%2C0.14l1.01%2C0.46l0.8%2C-0.32l0.15%2C-0.22l0.28%2C0.08l1.76%2C-0.87l0.89%2C-0.22l0.65%2C0.36l0.76%2C0.06l-0.24%2C0.29l-0.53%2C0.13l-1.58%2C-0.12l-0.15%2C0.37l0.04%2C0.15l-0.18%2C0.27l-0.42%2C0.22l-2.13%2C0.55l-0.04%2C1.94l-0.43%2C-0.22l-0.36%2C-1.44l-0.33%2C-0.24l-0.23%2C-0.22l-0.6%2C-0.28l-0.11%2C0.43l-0.42%2C0.2l-0.25%2C-0.21l-0.32%2C-0.97l-1.13%2C-0.66l-0.41%2C-1.75l-0.47%2C-0.2l-0.36%2C0.21l-0.78%2C0l-0.41%2C-0.33l-0.08%2C-0.33l-0.5%2C-0.14l-0.08%2C0.53l-0.36%2C0.07l-1.56%2C-1.11l-0.44%2C0.26l0.1%2C0.51l0.12%2C2.39l-0.16%2C1.77l-0.13%2C0.41l-0.14%2C0l-0.12%2C-0.17l-0.03%2C-0.79l-0.07%2C-1.18l-0.34%2C-0.84l-0.31%2C-1.54l-0.1%2C-0.6l-0.06%2C-0.76l-0.06%2C-0.51l-0.15%2C-0.08l-0.86%2C-0.06l-1.02%2C0.01l-0.66%2C0.05l-1.37%2C0.39l0.02%2C0.47l0.58%2C0.5l0.07%2C0.58l-0.2%2C0.29l-0.29%2C0.39l-0.33%2C0.17l-0.73%2C-0.95l-1.1%2C-0.96L53%2C574.61l-0.45%2C-0.34l-0.93%2C-0.1l-1.29%2C0.92l-0.86%2C0.23l-0.34%2C0.05l-0.4%2C0.08l-0.29%2C0.91l0.31%2C0.31l0.04%2C0.52l-0.48%2C0.37l-0.58%2C-0.11l-0.3%2C-0.31l-0.06%2C-1.48l-1.14%2C0.44l-0.75%2C-0.2l-0.69%2C0.15l-0.36%2C0.05l-1.45%2C0.43l-1%2C-0.39l-0.57%2C0.68l-0.83%2C0.7l-0.45%2C0.27l0.48%2C1.1l-0.25%2C0.67l-0.18%2C0.89l0.48%2C0.09l2.33%2C-0.41l1.61%2C0.17l1.43%2C-0.46l1.35%2C-0.02l0.29%2C0.46l-0.11%2C0.09l-0.68%2C0.21l-0.9%2C-0.1l0.19%2C0.49l0.6%2C0.06l1.4%2C-0.29l0.4%2C0.08l-0.05%2C0.21l-0.09%2C0.33l0.38%2C0.34l1.08%2C0.13l0.67%2C0.12l0.41%2C0.45l-0.55%2C0.44l0.1%2C0.37l1.19%2C-0.08l1.11%2C-0.31l-0.01%2C0.42l-0.83%2C0.31v0.41l1.09%2C-0.15l0.6%2C0.02l0.6%2C0.11l0.35%2C0.36l1.16%2C1.23l0.4%2C1.8l0.65%2C0.31l0%2C0.26l-0.31%2C0.18l-0.75%2C-0.04l0.05%2C0.53l0.4%2C0.74l0.65%2C1.67l0.37%2C0.34l1.39%2C-0.06l0.59%2C0.33l1.37%2C0.27l0.73%2C0.56l0.45%2C0.06l0.52%2C-0.06l0.51%2C-0.48l0.26%2C-0.03l0.44%2C0.03l0.59%2C0.08l0.79%2C0.02l0.6%2C0.27l1.56%2C1.79l-0.02%2C0.28l-0.22%2C0.09l-0.62%2C-0.39l-1.07%2C-1.1l-0.96%2C-0.33l-0.75%2C-0.18l-0.63%2C0.79l-0.2%2C0.82l-1.3%2C-0.55l-1.4%2C-0.63l-1.5%2C-0.2l-0.3%2C0.22l0.06%2C5.29l-0.59%2C0.78l-0.57%2C0.45l-0.62%2C1.47l0.63%2C0.2l0.86%2C0.75l0.61%2C0.06l0.01%2C0.47l-0.62%2C0.04l-0.59%2C-0.25l-2.1%2C-0.87l0.45%2C-0.64l0.31%2C-1.01l0.68%2C-1.03l1%2C-0.92l-0.02%2C-0.93l-0.26%2C-0.84l0.08%2C-1.49l-0.18%2C-1.5l-0.46%2C-0.6l-0.26%2C-0.19l-0.43%2C-1.04l-0.55%2C-0.52l-0.48%2C-1.26l-0.29%2C-0.67l-0.18%2C-0.8l0.68%2C-1.64l-0.55%2C-0.32l-0.43%2C-0.6l-0.34%2C-0.11l-1.07%2C-0.13l-0.73%2C0.28l-0.61%2C-0.26l0.05%2C-0.68l-0.57%2C-0.22l-2.64%2C1.1l-1.53%2C1.1l0.78%2C0.39l-0.6%2C0.45l-1.13%2C-0.43l-0.85%2C0.02l-1.02%2C0.44l-0.28%2C0.38l0.56%2C2.29l0.16%2C1.27l0.46%2C0.86l0.84%2C1.56l0.62%2C1.37l0.23%2C1.09l-0.12%2C0.41l1.43%2C-0.3l0.17%2C0.38L47%2C596.98l1.04%2C1.87l0.22%2C1.02l-0.09%2C0.36l-0.35%2C0.3l-0.34%2C-0.59l-0.78%2C-2.02l-0.77%2C-0.81l-0.31%2C-0.79l-0.07%2C-0.47l-0.13%2C-0.63l-0.49%2C-1.1l-1.02%2C-0.66l0.05%2C-1.31l-0.55%2C-1.48l-1.07%2C-1.49l-0.15%2C-0.94l-0.44%2C-0.23l-1.33%2C0.79l-2.35%2C1.3l-1.42%2C1.01l-0.32%2C0.48l-1.55%2C1.18l-0.57%2C0.34l-0.21%2C-0.03l-0.26%2C0.27l-0.45%2C0.96l0.78%2C0.29l0.32%2C0.5l0.15%2C0.92l2.36%2C0.6l0.17%2C0.27l-0.11%2C0.25l-0.75%2C0.05l-1.22%2C-0.47l-0.48%2C-0.04l-0.44%2C-0.63l-0.17%2C-0.79l-0.25%2C-0.13l-1.02%2C0.49l-0.02%2C0.21l0.46%2C0.82l0.35%2C0.41l0.37%2C0.11l0.61%2C1.09l0.73%2C0.57l0.72%2C0.85l0.08%2C0.4l0.44%2C0.61l0.38%2C0.13l0.43%2C0.47l0.29%2C0.72l0.84%2C-0.27l0.65%2C0.16l0.99%2C0.3l0.76%2C0.19l0.69%2C0.31l0.16%2C0.35l-0.15%2C0.41l-1.19%2C-0.27l-0.44%2C-0.21l-0.39%2C-0.18l-0.94%2C-0.43l-0.97%2C0.4l-0.46%2C-0.14l-0.35%2C0.09l-0.41%2C0.26l-0.25%2C0.8l-0.18%2C-0.25l-0.03%2C-0.7l0.4%2C-0.66l-0.03%2C-0.37l-0.46%2C-0.49l-0.66%2C-0.34l-0.75%2C-1.4l-0.59%2C-0.12l-0.43%2C0.32l0.26%2C0.95l-0.23%2C0.92l-0.58%2C0.9l-0.56%2C1.41l-0.71%2C0.84l-0.66%2C1.47l-0.18%2C0.02l-0.1%2C-0.36l0.19%2C-0.55l1.16%2C-2.3l0.37%2C-0.89l0.52%2C-0.81l0.1%2C-0.5l-0.14%2C-1.08l0.29%2C-1.02l-0.22%2C-0.71l-0.6%2C-0.94l-0.33%2C-0.38l-0.33%2C-0.12l-0.68%2C-0.12l-0.38%2C0.28h-0.85l-0.16%2C0.6l-0.38%2C0.23l-0.96%2C0.33l-0.25%2C0.14l-1.16%2C-0.15l0.53%2C1.95l-0.11%2C0.58l1.25%2C1.27L28%2C602.27l-1.24%2C-1.52l-0.54%2C-2.61l-0.68%2C0.2l-0.49%2C0.1l-0.93%2C-0.15l-0.94%2C-1.04l-0.68%2C-0.5l-1.04%2C1l-0.18%2C1.05l-0.23%2C0.17l-0.56%2C1.29l0.59%2C0.58l0.16%2C0.68l0.56%2C0.19l0.55%2C-0.16l1.79%2C0.15l0.22%2C0.33l1.02%2C0.7l0.17%2C0.53l-0.05%2C0.58l-0.14%2C0.26l-0.24%2C-0.27l-0.76%2C-0.72l-0.52%2C-0.52l-0.62%2C0.16l0.17%2C1.52l-0.35%2C0.42l-0.13%2C0.46l-0.33%2C0.24L22.46%2C606l0.11%2C0.25l-0.1%2C0.27l-0.7%2C0.56l-0.17%2C0.71l0.65%2C-0.61l1.65%2C1.24l1.15%2C-0.05l1.65%2C-0.61l0.3%2C0.29l0.3%2C0.02l0.28%2C-0.44l0.29%2C-0.14l0.4%2C0l0.25%2C0.38l0.69%2C-0.11l0.55%2C0.48l0.9%2C-0.42l1.07%2C-0.79l1.32%2C-0.29l0.94%2C0.34l0.66%2C1.18l0.55%2C0.3l2.01%2C-0.69l0.08%2C-0.68l0.87%2C-0.44l0.21%2C-0.76l1.25%2C0.08l0.65%2C0.21l-0.63%2C0.77l1.45%2C0.91l0.18%2C0.57l0.13%2C0.11l1%2C-0.71l1.02%2C-1.02l0.18%2C-0.73l0.37%2C-0.43l0.36%2C-0.08l0.61%2C0.18l0.75%2C-0.09l0.08%2C-1.02l0.71%2C-0.24l0.61%2C-0.5l0.61%2C-0.43l0.71%2C0.37l0.25%2C-0.06l0.68%2C-0.97l0.72%2C0.58l0.24%2C0.91l1.1%2C2.03l0.58%2C0.42l0.14%2C1.09l0.25%2C0.15l0.77%2C0.12l1.02%2C-0.22l0.98%2C-0.32l0.75%2C-0.49l0.75%2C0.34l0.77%2C-0.4l0.77%2C0.2l0.3%2C-0.48l0.7%2C-0.93l1.69%2C-0.23l0.65%2C0.11l0.33%2C-0.34l0.03%2C-0.47l0.68%2C-0.17l0.32%2C0.71l1.19%2C-0.06l1.09%2C0.61l0.2%2C-0.37l-0.1%2C-1l1.08%2C-1.06l0.44%2C-1.68l1.61%2C0.09l0.52%2C-0.27l1.04%2C1.35l0.65%2C0.11l0.17%2C-0.36l0.94%2C-0.41l-0.32%2C-0.81l-0.83%2C-1.3l1.69%2C-0.75l1.76%2C-2.16l2.14%2C-0.27l0.88%2C0.96l2.75%2C-0.4l2.41%2C-3.68l0.99%2C-1.94l0.85%2C-0.68l0.76%2C-1.21l1.4%2C-0.86l2.35%2C-0.7l2.63%2C-0.35l2.37%2C-0.11l2.94%2C-0.44l4.04%2C0.12l0.6%2C0.98l1.47%2C0.28l0.96%2C-0.2l0.78%2C-0.85l2.21%2C-1.12l1.12%2C-2.44l-0.29%2C-0.62l0.59%2C-2.21l-0.12%2C-0.72l0.1%2C-0.19l0.29%2C0.02l0.12%2C-1.07l-0.78%2C-1.76l-0.93%2C0.13l-0.91%2C-1.22l-0.17%2C-1.38l-0.83%2C-0.17l-0.48%2C-0.32l-0.97%2C-1.34l-0.78%2C0.08l-1.34%2C-2.09l-0.18%2C-0.54l2.08%2C-1.32l0.85%2C-0.08l0.96%2C-0.53l1.05%2C0.03l5.48%2C-2.01l1.18%2C-0.74l1.06%2C-1.81l-0.2%2C-2.35l-0.54%2C-1.61l0.13%2C-1.38l0.9%2C-1.03l0.29%2C-0.85l2.21%2C-1.08l0.01%2C-0.18L114.73%2C556.07zM38.17%2C574.17l0.8%2C0.22l1.01%2C1l0.5%2C0.13l0.21%2C-0.33l-0.76%2C-0.94l-0.17%2C-0.51H39.4l-0.74%2C-0.97l-0.51%2C-0.05l-0.23%2C0.9L38.17%2C574.17zM36.49%2C584.24l1.3%2C-0.13l0.38%2C-0.29l0.55%2C-0.26l1.57%2C-0.31l-0.2%2C-0.26l-1.66%2C-0.21l-0.82%2C0.48l-1.16%2C0.07l-0.17%2C0.19l-0.06%2C0.53L36.49%2C584.24zM29.38%2C591.6l0.23%2C0.38l0.73%2C-0.68l0.42%2C0.3l-0.05%2C0.44l0.17%2C0.25l0.34%2C0.73l-0.7%2C0.5l-0.29%2C0.27l-0.01%2C0.24l0.94%2C0.26l1.11%2C-0.2l0.21%2C-0.35l0.58%2C-0.97l0.41%2C-0.78l0.7%2C-0.24l2.85%2C-2.58l-1.02%2C-0.43l-1.02%2C-0.46l0.1%2C-0.55l-0.64%2C-1.06l-0.17%2C-0.99l-1.22%2C-0.16l-1.3%2C0.26L31%2C586.2l-0.96%2C1.7l-0.09%2C0.67l0.28%2C0.87l-0.11%2C0.43l0.11%2C0.5l-1%2C-0.01l-0.18%2C0.4L29.38%2C591.6zM36.93%2C582.24l0.47%2C-0.39l0.04%2C-1.01l-0.37%2C-0.19l-0.2%2C-0.31l-0.42%2C0.32v0.85l0.01%2C0.39L36.93%2C582.24zM42.7%2C585.84l-0.03%2C-0.3l-0.26%2C-0.25l-1.25%2C0.12l-0.14%2C0.29l-0.37%2C-0.04l0.2%2C-0.66l-0.48%2C-0.36l-0.51%2C0.37l-0.22%2C-0.58l-0.38%2C-0.17l-0.31%2C0.15l-0.43%2C0.19l-0.16%2C0.25l-2.48%2C-0.06l-0.32%2C0.14l0.04%2C0.39l0.38%2C0.71l0.99%2C0.78l1.19%2C0.33l1.17%2C-0.16l0.93%2C-0.17l1.17%2C-0.22l0.17%2C-0.08L42.7%2C585.84zM44.64%2C582.14l-1.21%2C0.41l-0.34%2C0.1l-0.35%2C0.31l-0.44%2C0.23l-2.26%2C0.55l0%2C0.45l1.67%2C-0.34l0.66%2C0.08l-0.22%2C0.3l0.07%2C0.58l0.8%2C0.4l0.33%2C0.82l0.89%2C-0.62l0.53%2C-0.12l0.54%2C0.11l1.35%2C-0.4l1.17%2C-0.69l0.96%2C-0.44l0.93%2C-0.71l0.44%2C-0.46l-0.31%2C-0.44l-0.27%2C0.23l-0.54%2C0.19l-0.41%2C-0.44l-1.07%2C-0.3l-0.82%2C0.01l-0.94%2C-0.42L44.64%2C582.14zM34.54%2C579.57l0.1%2C0.35l-0.04%2C0.3l1.03%2C-0.26l0.15%2C-0.1l-0.03%2C-0.34l0.56%2C-0.24l0.99%2C1.14l-0.22%2C-0.96l0.23%2C-0.57l-0.34%2C-0.61l0.19%2C-0.57l-0.11%2C-0.23l-0.2%2C-0.15l-0.81%2C0.2l-0.25%2C0.27l0.45%2C0.14l0.25%2C0.45l-0.48%2C0.03l-0.31%2C-0.01l-0.84%2C0.39l-0.48%2C0.52L34.54%2C579.57zM34.53%2C583.56l0.51%2C0.11l0.26%2C-0.88l-0.15%2C-0.15l-0.9%2C0.05l-0.54%2C-0.2l-0.33%2C0.05l-0.45%2C0.35l-0.22%2C0.66l0.75%2C0.13L34.53%2C583.56zM38.93%2C576.96l0.36%2C-0.13l0.09%2C-0.58l-0.21%2C-0.51l-0.66%2C-0.59l-0.75%2C-0.04l-0.24%2C-0.05l-0.4%2C0.22l0.5%2C0.98L38.93%2C576.96z%22%2F%3E%0A%09%09%3Cpath%20fill%3D%22white%22%20stroke%3D%22none%22%20id%3D%22NO-18%22%20title%3D%22Nordland%22%20%20d%3D%22M205.59%2C273.32l0.22%2C-0.16l0.17%2C-0.62l-0.03%2C-0.86l0.89%2C-0.99l0.57%2C-0.08l-0.06%2C-0.29l-0.25%2C0.01l-0.03%2C-0.12l0.56%2C-0.8l0.4%2C-0.01l0.14%2C0.2l0.19%2C-0.09l-0.01%2C-0.54l0.26%2C-0.15l0.32%2C-0.41l-0.03%2C-0.46l-0.2%2C0.07l-0.26%2C0.64l-0.25%2C0.23l-0.55%2C0.29l-0.87%2C0.72l-0.03%2C0.16l-0.59%2C0.27l-0.34%2C-0.3l0.41%2C-0.26l0.23%2C-0.65l0.31%2C-0.02l0.17%2C-0.19l-0.16%2C-0.1l-0.42%2C-0.31l-0.2%2C-0.27l0.2%2C-0.26l0.49%2C0.02l0.24%2C0.01l0.04%2C-0.28l0.28%2C-0.25l-0.42%2C-0.48l-0.71%2C0.17l-0.3%2C-0.37l0.16%2C-0.3l0.45%2C-0.17l0.62%2C-0.8l1.21%2C-0.48l0.68%2C0.04l1.21%2C-0.37l-0.32%2C-0.12l-0.29%2C-0.01l-0.58%2C-0.04l-0.23%2C-0.11l0.28%2C-0.29l0.44%2C-0.02l0.02%2C-0.25l-0.46%2C0.03l-0.67%2C0.25l-0.26%2C0.04l-0.13%2C-0.01l-1.42%2C-0.06l0.66%2C-1.05l0.99%2C-0.32l-0.43%2C-0.85l0.23%2C-0.35l0.58%2C-0.06l1.11%2C-0.88l0.37%2C-0.49l0.66%2C-0.01l0.27%2C0.44l0.35%2C0.19l-0.01%2C0.41l0.24%2C0.34l-0.07%2C0.4l0.08%2C0.38l0.32%2C0.15l0.25%2C0.42l0.67%2C0.24l0.24%2C0.16l0.22%2C0.21l0.3%2C-0.11l-0.29%2C-0.24l-0.06%2C-0.38l-0.28%2C-0.14l-0.22%2C-0.61l-0.63%2C0.35l-0.25%2C-0.35l0.32%2C-0.3l-0.08%2C-0.2l0.23%2C-0.14l0.47%2C0.01l0.59%2C0.76l0.2%2C-0.26l0.17%2C-0.11l0.23%2C-0.27l0.12%2C-0.19l-0.25%2C-0.47l0.08%2C-0.24l0.45%2C0.04l0.08%2C-0.27l0.11%2C-0.29l0.28%2C-0.13l0.17%2C-0.86l0.61%2C0.11l0.24%2C-0.04l-0.1%2C-0.79l0.79%2C-0.43l0.91%2C0.03l0.34%2C1.13l0.4%2C0.64l0.04%2C0.81l-0.33%2C0.48l0.12%2C0.5l0.37%2C0.3l-0.29%2C0.22l0.03%2C0.16l-0.45%2C-0.04l-0.25%2C0.37l0.02%2C0.26l0.18%2C0.4l0.17%2C0.07l0.34%2C-0.03l0.4%2C-0.21l0.14%2C-0.26l0.17%2C-0.49l0.25%2C0.1l0.51%2C-0.68l0.29%2C-0.14l0.23%2C0.19l0.36%2C0.01l1.23%2C1.58l-0.25%2C0.58l-0.86%2C0.64l0.1%2C1.23l-0.37%2C0.57l-0.2%2C0.01l0.11%2C-0.79l-0.2%2C-0.34l-0.2%2C-0.09l-0.33%2C0.4l0.23%2C0.41l-0.15%2C0.09l-0.25%2C0.01l-0.12%2C0.2l-0.12%2C0.27l0.02%2C0.48l-0.24%2C0.14l-0.11%2C0.19l-0.5%2C0.22l-0.12%2C0.23l-0.57%2C-0.57l0.1%2C-0.3l-0.54%2C0.2l-0.39%2C0.14l-0.96%2C0.99l-0.58%2C-0.22l0.13%2C-1.09l-0.15%2C-0.19l-0.11%2C0.09l0.09%2C0.36l-0.23%2C0.3l-0.42%2C0.11l-0.69%2C-0.31l-0.12%2C0.14l0.31%2C0.25l0.63%2C0.07l0.21%2C0.24l-0.09%2C0.23l-0.34%2C0.08l-0.33%2C0.9l-0.83%2C-0.12l0.08%2C0.2l-0.42%2C0.2l0.32%2C0.22l1.45%2C0.06l-0.51%2C0.2l0.26%2C0.39l-0.37%2C0.07l0.03%2C0.35l0.35%2C0.16v0.68l-0.22%2C0.33l-0.12%2C0.04l-0.02%2C-0.27l-0.8%2C0.52l-0.68%2C-0.03l0.02%2C-1.13l-0.35%2C0.01l0.15%2C-0.41l-0.29%2C-0.68l-0.16%2C0.39l0.19%2C0.45l-0.24%2C0.06l-0.1%2C0.29l0.15%2C0.31l-0.09%2C0.49l-0.56%2C0.11l-0.15%2C0.47l0.55%2C0.13l-0.24%2C0.74l0.02%2C0.34l0.17%2C0.13l-0.56%2C0.54l-0.35%2C-0.04l0.09%2C-0.5l-0.16%2C-0.22l-1.43%2C0.58l0.57%2C-1.01l-0.72%2C0.27l0.21%2C-0.36l-0.2%2C-0.3l-0.16%2C-0.09l0.78%2C-0.4l-0.52%2C-0.49l0.05%2C-0.32l0.29%2C-0.33l-1.01%2C-0.06l-0.26%2C-0.23l-0.21%2C0.14l0.07%2C0.23l-0.51%2C0.21l-0.18%2C0.15l-0.03%2C0.26l0.75%2C0.15l-0.17%2C0.25l-0.23%2C-0.09l-0.09%2C0.28l-0.12%2C0.26l0.62%2C0.02l-0.14%2C0.4l0.17%2C0.3l-0.29%2C0.6l-0.4%2C0.18l-0.19%2C0.09l-0.36%2C0.2l0.03%2C0.39l0.18%2C0.07l-0.16%2C0.29l-0.84%2C0.45l-0.21%2C-0.21l0.11%2C-0.31l-0.46%2C-0.74l-0.31%2C-0.18l0%2C-0.57L205.59%2C273.32zM219.61%2C260.44l0.27%2C0.14l0.13%2C0.21l0.35%2C-0.01l1.2%2C-0.43l-0.28%2C0.72l-0.21%2C0.3l-0.06%2C0.42l0.17%2C0.37l0.29%2C0.06l0.26%2C0.3l-0.1%2C0.31l1.05%2C0.73l1%2C-0.48l0.53%2C-1.62l0.03%2C-0.53l-0.46%2C-0.6l-0.31%2C-0.88l-0.82%2C-0.03l-0.82%2C-0.65l-0.16%2C-0.33l-0.26%2C-0.42l-0.97%2C0.21l-0.14%2C0.16l-0.4%2C-0.22l-0.18%2C0.17l0.19%2C0.7l0.36%2C0.28l0%2C0.24l-0.28%2C-0.17l-0.71%2C-0.16l-0.08%2C0.63L219.61%2C260.44zM215.63%2C333.48l0.46%2C-0.12l0.39%2C-0.38l-0.16%2C-0.2l-0.66%2C-0.34l-1.14%2C-0.48l-0.35%2C0.62l0.02%2C0.64l0.21%2C0.12l0.11%2C-0.02l0.28%2C0.03l0.41%2C0.03L215.63%2C333.48zM210.23%2C347.1l-0.73%2C0.4l-0.59%2C0.82l0.06%2C0.19l0.09%2C0.41l0.99%2C0.09l0.49%2C-0.49l0.06%2C-0.6l0.03%2C-0.46l0.06%2C-0.33L210.23%2C347.1zM224.41%2C263.07l-0.31%2C0.3l0.24%2C0.51l0.03%2C0.25l-0.06%2C0.14l0%2C0.19l-1.15%2C0.25l-0.37%2C0.4l-0.03%2C0.2l0.05%2C0.72l0.23%2C0.27l-0.03%2C0.3l-0.02%2C0.51l0.01%2C0.6l-0.28%2C0.62l0.02%2C0.59l0.35%2C0.06l0.46%2C-0.04l0.36%2C-0.1l0.62%2C-0.52l1.17%2C-0.07l0.21%2C-0.15l0.12%2C-0.23l0.1%2C-0.22l0.17%2C-0.01l0.29%2C0.06l0.22%2C-0.21l0.32%2C-0.13l0.28%2C-0.14l-0.19%2C-0.32l-0.23%2C-0.06l0.25%2C-0.75l0.29%2C0.34l0.25%2C0.04l0.29%2C0.17l0.36%2C-0.01l0.72%2C0.06l0.05%2C-0.2l0.12%2C-0.19l0.3%2C-0.21l0.16%2C-0.09l0.05%2C-0.4l0.54%2C0.25l-0.1%2C-0.79l0.05%2C-0.37l0.02%2C-0.24l0.3%2C0.06l0.14%2C0.38l0.03%2C0.39l0.35%2C-0.47l0.04%2C-0.35l1.22%2C-0.17l0.08%2C0.6l0.21%2C-0.01l0.12%2C-0.07l0.48%2C-0.12l0.08%2C-0.2l-0.17%2C-0.43l-0.23%2C0.04l-0.35%2C-0.27l-0.21%2C-0.05l-0.04%2C-0.18l0.2%2C-0.28l0.18%2C-0.17l0.16%2C0.03l0.23%2C0.72l0.3%2C-0.05l0.2%2C-0.25l-0.09%2C-0.81l0.17%2C-0.24l-0.28%2C-0.1l-0.44%2C-0.04l-0.7%2C-0.14l-0.02%2C-0.16l0.23%2C-0.38l0.51%2C0.13l0.6%2C0.14h0.11l0.23%2C-0.3l0.06%2C-0.53l0.32%2C-0.47l0.03%2C-0.66l0.26%2C-0.31l-0.53%2C-0.02l-0.14%2C-0.38l0.08%2C-0.26l0.31%2C-0.12l-0.03%2C-0.58l0.16%2C-0.26l-0.25%2C-0.77h0.31l0.43%2C0.29l-0.01%2C0.93l0.37%2C0.22l-0.02%2C0.33l1%2C-0.09l-1.34%2C0.78l-0.08%2C0.25l0.05%2C0.22l0.06%2C0.17l-0.27%2C0.56l-0.05%2C0.82l-0.12%2C0.3l0.05%2C0.2l-0.02%2C0.8l0.24%2C0.03l0.28%2C-0.2l0.09%2C-0.39l0.29%2C-0.06l0.61%2C-0.24l0.54%2C-0.56l0.24%2C-0.55l0.51%2C-0.23l0.22%2C-0.25l0.43%2C-0.32l0.11%2C-0.3l0.48%2C-0.47l0.36%2C-0.12l0.13%2C-0.2l0.26%2C-0.19l0.56%2C-0.76l0.26%2C-0.11l0.08%2C-0.62l0.4%2C-0.57l0.06%2C-0.21l0.25%2C-0.45l0.4%2C0.17l0.28%2C0.06l0.38%2C-0.2l0.69%2C-1.05l0.06%2C-0.55l0.31%2C0.07l0.79%2C-1.21l0.27%2C-0.96l0.59%2C-0.7l0.43%2C-0.91l0.19%2C-0.61l-0.87%2C0.08l-0.62%2C0.17l-1.73%2C0.07l-0.21%2C0.21l0.04%2C0.51l-0.18%2C0.21l-0.2%2C-0.5l-0.72%2C0.09l0.08%2C0.83l-0.14%2C0.19l-0.2%2C-0.02l-0.06%2C-0.41l-0.19%2C-0.22l-0.41%2C0.07l-0.47%2C-0.03l-0.7%2C-0.07l-0.62%2C0.17l0.25%2C0.92l-0.58%2C1.07l0.23%2C0.15l0%2C0.31l0.46%2C0.92l-0.18%2C0.16l-0.54%2C-0.43l-0.67%2C0.83l-1.52%2C1.06l-0.04%2C-0.12l0.85%2C-0.94l0.67%2C-0.49l-0.1%2C-0.43l0.31%2C-0.46l0.1%2C-0.71l-0.27%2C-0.17l0.12%2C-0.41l-0.09%2C-0.47l-0.29%2C0.03l-0.26%2C-0.17l-0.56%2C-0.02l-0.27%2C0.13l-0.71%2C-0.16l-0.41%2C0.04l-0.33%2C-0.09l-0.2%2C0.11l-0.12%2C0.48l0.15%2C0.84l-0.08%2C0.62l0.35%2C0.96l-0.38%2C0.02l-0.49%2C-0.69l-0.01%2C-0.59l0.16%2C-0.41l-0.03%2C-0.7l-0.61%2C-0.68l-1.17%2C0.11l-0.38%2C0.51l-0.81%2C0.24l-0.56%2C0.51l0.03%2C0.29l0.22%2C-0.08l0.39%2C0.19l0.09%2C0.6l0.49%2C0.22l0.16%2C0.56l-0.13%2C0.3l-0.08%2C0.13l-0.39%2C-0.03l-0.15%2C0.17l-0.31%2C-0.29l-0.19%2C-0.98l-0.41%2C-0.5l-0.32%2C0.06l-0.56%2C0.64l-0.31%2C-0.11l-0.46%2C-0.01l-0.37%2C0.07l-0.29%2C0.06l-0.26%2C0.21l-0.09%2C0.39l0.02%2C0.16l0.05%2C0.27l0.17%2C-0.06l0.53%2C0.31l-0.01%2C0.09l0.02%2C0.36l-0.26%2C0.16l0.09%2C0.3l0.09%2C0.39l0.11%2C0.16l0.12%2C0.14l0.68%2C-0.12l0.16%2C-0.24l0.34%2C0.19l0.04%2C0.15l-0.29%2C0.23l0.02%2C0.36l0.31%2C0.37l0.16%2C0.09l0.12%2C0.15l-0.14%2C0.16l-0.16%2C0.42l-0.25%2C0.07l-0.25%2C0.11l-0.11%2C-0.58l0.02%2C-0.47l-0.11%2C-0.49l-0.13%2C-0.21l-0.41%2C-0.01l0.07%2C0.37v0.25l0.05%2C0.66l-0.02%2C0.24l-0.87%2C-0.2l-0.02%2C0.12l0.66%2C1.25l-0.23%2C0.12l-0.59%2C-1.01l-0.16%2C-1l-0.49%2C-0.52l-0.74%2C-0.2l-0.24%2C0.3l-0.12%2C0.75l-0.31%2C0.29l0.11%2C0.71l-0.13%2C0.39l0.15%2C0.43l-0.18%2C0.26l0.27%2C0.44l0.62%2C0.21l0.17%2C0.37l-0.36%2C0.15l-0.71%2C-0.32l-0.48%2C0.2l0.03%2C0.47L224.41%2C263.07zM218.34%2C329.5l-0.39%2C-0.1l-0.39%2C0.16l-0.26%2C0.43l-0.18%2C0.23l-0.33%2C0.45l-0.11%2C0.27l-0.19%2C0.28l-0.21%2C0.44l0.27%2C0.56l0.88%2C-0.97l0.34%2C-0.43l0.48%2C-0.66L218.34%2C329.5zM214.4%2C334.53l-0.55%2C-0.29l-0.34%2C0.35l-0.9%2C0.06l-0.28%2C0.37l-0.13%2C0.35l0.03%2C0.92l-0.06%2C0.39h0.29l0.34%2C-0.46l0.65%2C0.06l1.34%2C-0.46l0.19%2C-0.64l-0.17%2C-0.22L214.4%2C334.53zM227.29%2C314.08l-0.04%2C-0.42l-0.08%2C-0.32l-0.36%2C-0.35l-0.17%2C0.02l-0.88%2C0.58l-0.37%2C0.45l-0.61%2C0.26l-0.69%2C0.86l-0.08%2C0.41l-0.48%2C0.74l-0.43%2C0.19l-0.31%2C0.67l0.32%2C0.1l0.54%2C0.07l1.32%2C-0.92l0.9%2C0.07l0.54%2C-0.32l0.33%2C-0.05l0.62%2C-1.18l0.35%2C-0.67L227.29%2C314.08zM224.58%2C327.8l-0.3%2C-0.21l-0.52%2C0.53l-0.44%2C0.78l-0.68%2C1.53l-0.27%2C0.8l-0.61%2C0.71l-0.28%2C-0.32l-0.49%2C-0.59l-0.59%2C-0.54l-0.55%2C-0.76l-0.49%2C0.16l-0.1%2C0.76l-0.45%2C0.63l-0.02%2C0.49l0.36%2C-0.05l-0.08%2C0.56l-0.39%2C0.17l-0.41%2C0.5l-0.15%2C1l0.32%2C0.41l0.2%2C-0.34l0.42%2C-0.01l0.97%2C0.9l0.47%2C0.01l0.33%2C0.26l0.33%2C1.25l0.32%2C0.37l0.35%2C1.65l0.3%2C0.64l0.52%2C-0.23l0.37%2C-0.43l0.23%2C-0.66l0%2C-0.28l0.08%2C-0.89l0.1%2C-0.42l-0.42%2C-0.51l-0.15%2C-0.17l-0.09%2C-0.54l0.01%2C-0.91l-0.04%2C-0.67l0.74%2C-0.84l0.43%2C-0.99l0.01%2C-0.55l0.7%2C-0.69l-0.23%2C-1.12l0.53%2C-0.84L224.58%2C327.8zM190.98%2C289.49l0.02%2C0.29l-0.24%2C0.19l0.11%2C0.18l0.31%2C-0.29l0.45%2C0.12l0.56%2C-0.13l0.19%2C-0.84l0.18%2C-0.31l0.35%2C-0.18l-0.03%2C-0.82l0.62%2C0.07l0.21%2C-0.6l0.51%2C0.01l0.18%2C-0.38l0.31%2C-0.07l0.12%2C-0.22l0.42%2C-0.29l0.23%2C0.05l0.01%2C0.25l0.37%2C0.02l0.25%2C-0.34l-0.08%2C-0.27l-0.2%2C-0.46l0.27%2C-0.06l0.13%2C0.22l0.19%2C-0.08l0.19%2C-0.58l0.21%2C-0.16l0.18%2C-0.17l0.35%2C-0.6l0.03%2C-0.69l0.28%2C-0.33l-0.05%2C-0.17l-1.09%2C0.2l-0.45%2C-0.22l-0.03%2C-0.22l-0.9%2C-0.1l-0.51%2C0.48l0%2C-0.31l0.63%2C-0.81l0.2%2C0.07l0.3%2C-0.01l-0.24%2C-1.27l-0.22%2C-0.12l0.1%2C-0.63l0.29%2C-0.1l-0.06%2C0.28l0.45%2C0.8l0.14%2C0.95l0.56%2C0.54l0.57%2C-0.14l0.02%2C-0.76l0.26%2C-0.11l0.28%2C0.93l0.37%2C0.11l0.29%2C-0.48l0.45%2C-0.25l0.48%2C-0.75l0.02%2C-0.23l-0.45%2C-0.78l0.13%2C-0.77l-0.23%2C-0.42l0.11%2C-0.67l-0.23%2C-0.18l0%2C-0.39l-0.01%2C-0.83l-0.2%2C0.01l-1.64%2C1.69l-0.18%2C-0.02l0.1%2C-0.45l-0.68%2C-0.52l0.14%2C-0.21l0.69%2C-0.06l0.23%2C-0.36l0.33%2C0.15l0.19%2C-0.17l-0.01%2C-0.22l1.07%2C-0.67l-0.08%2C-0.62l-0.47%2C0.32l-0.1%2C0.51l-0.24%2C-0.01l-0.11%2C-0.26l0.35%2C-0.9l0.46%2C-0.17l0.3%2C-0.51l0.33%2C-0.03l0.12%2C-0.89l-0.13%2C-0.09l-0.58%2C-0.02l-0.05%2C0.3l-0.35%2C0.03l-0.12%2C-1.11l-0.52%2C0.09l-0.19%2C0.26l-0.54%2C-0.31l-0.2%2C0.12l0.42%2C2.06l-0.34%2C0.28l-0.73%2C-0.12l-0.19%2C0.67l-0.48%2C0.31l-0.1%2C0.77l-0.27%2C0.04l-0.38%2C0.6l0.07%2C0.74l-0.66%2C-0.36l0.22%2C0.91l-0.37%2C0.45l0.25%2C0.48l-0.08%2C0.42l0.28%2C0.7l-0.5%2C0.2l-0.49%2C-0.15l-0.38%2C0.62l0.09%2C0.65l-0.07%2C0.35l0.04%2C0.73l-0.62%2C0.49l0.34%2C0.32l0%2C0.5l-0.76%2C0.6l-0.17%2C0.37l-0.06%2C0.23l0.18%2C0.49l-0.08%2C0.18l-0.18%2C0.2l-0.06%2C0.55l0.23%2C0.29l-0.01%2C0.33l-0.21%2C0.15l-0.11%2C0.54l0%2C0.57l-0.34%2C0.08l-0.2%2C0.26h-0.44l-0.12%2C0.18l0.07%2C0.4l0.15%2C-0.16L190.98%2C289.49zM197.82%2C360.81l-0.05%2C0.27l-0.61%2C0.73l0.21%2C0.87l-0.12%2C0.35l0.32%2C0.74l0.33%2C-0.55l0.13%2C-0.76l0.03%2C-0.95l-0.18%2C-0.14L197.82%2C360.81zM199.12%2C277.72l0.18%2C0.58l0.17%2C0.39l0.06%2C0.5l0.49%2C0.1l0.2%2C-0.68l-0.04%2C-0.9l0.31%2C-0.8l-0.08%2C-1.22h0.13l0.12%2C0.72l0.27%2C0.43l0.08%2C2.55l0.55%2C-0.18l0.65%2C-0.51l0.05%2C-0.35l0.44%2C-0.45l0.27%2C-0.14l0.06%2C-0.39l0.18%2C-0.2l0.27%2C0.48l0.29%2C0.01l0.24%2C-0.32l0.21%2C-1.44l-0.2%2C-0.5l0.22%2C-0.21l0.14%2C-0.05l-0.04%2C-0.28l0.22%2C-0.24l0.13%2C-0.66l-0.11%2C-0.86l0.33%2C-0.93l0.31%2C-0.41l-0.22%2C-0.49l0.15%2C-0.1l0.41%2C-0.46l-0.25%2C-0.59l-0.16%2C0.1l-0.4%2C-0.41l-0.34%2C-0.03l-0.52%2C-0.68l-0.37%2C0.05l-1.11%2C-0.33l-0.28%2C0.8l0.05%2C1.07l-0.4%2C0.71l0.76%2C0.44l0.27%2C0.44l-0.13%2C1.89l0.16%2C0.6l-0.12%2C0.08l-0.12%2C-0.23l-0.25%2C-0.12l-0.6%2C-0.14l-0.01%2C-0.17l0.36%2C-0.13l0.35%2C-0.98l-0.57%2C-0.66l-0.31%2C0.49l-0.59%2C-0.12l-0.63%2C0.14l0.2%2C0.55l-0.42%2C0.1l0.29%2C1.14l-0.28%2C-0.12l-0.51%2C0.18l-0.71%2C1.84L199.12%2C277.72zM197.24%2C358.36l0.01%2C-1.01l-0.3%2C-0.41l-0.22%2C0.28l-0.17%2C0.3l-0.44%2C0.05l-0.17%2C0.27l0.05%2C0.49l0%2C0.43l0.24%2C0.25l0%2C0.43l0.84%2C-0.27l0.11%2C-0.3L197.24%2C358.36zM192.93%2C371.5l-0.08%2C-0.59l-0.28%2C-0.01l-1.44%2C0.7l-0.05%2C0.88l0.13%2C0.48l0.17%2C0.43l0.47%2C0.44l-0.48%2C0.46l-0.89%2C0.58l0.15%2C0.36l0.51%2C0.18l0.07%2C0.58l0.55%2C-0.34l0.64%2C-0.14l0%2C-1.5l0.14%2C-1.73l0.33%2C-0.34L192.93%2C371.5zM195.17%2C362.36l0.81%2C0.08l0.4%2C-2.23l-0.89%2C0.02l-0.35%2C0.39l0.14%2C0.05l0.07%2C0.34l-0.36%2C0.21l-0.11%2C0.38l-0.12%2C0.23l0.15%2C0.44l0.17%2C0.18L195.17%2C362.36zM194.13%2C384.85l-1.23%2C0.3l-0.69%2C0.64l-0.1%2C0.77l-0.58%2C0.8l0%2C0.26l0.65%2C0.14l0.56%2C-0.33l0.6%2C-0.09l0.68%2C-0.5l0.15%2C-1.43L194.13%2C384.85zM204.99%2C348.32l-0.53%2C0.19l-0.34%2C0.26l-0.64%2C0.13l-0.28%2C0.24l-0.39%2C1.29l0.99%2C-0.24l1.06%2C-0.21l0.96%2C-0.41l0.93%2C0.01l0.85%2C-0.31l0.64%2C-0.49l-1.47%2C-0.46l-1.24%2C0.13L204.99%2C348.32zM208.34%2C345.88l-0.3%2C0.46l0.13%2C0.95l0.9%2C-0.54l0.64%2C-0.82l-0.87%2C-0.29L208.34%2C345.88zM201.44%2C354.01l0.9%2C-0.1l0.62%2C0.04l1.05%2C-0.29l0.63%2C0.06l0.85%2C-0.39l0.41%2C-0.38l0.1%2C-0.35l-0.39%2C-0.19l-0.48%2C-0.15l-0.6%2C0.15l-0.61%2C-0.17l-0.32%2C-0.29l-0.36%2C-0.2l-0.28%2C0.11l-0.81%2C0.68l-1.19%2C0.94L201.44%2C354.01zM247.13%2C279.44l-0.28%2C-0.4l-0.34%2C-1.48l-0.41%2C-0.99l-0.28%2C0.64l-0.13%2C0.58l-0.34%2C0.46l-0.46%2C0.03l-0.08%2C0.87l-0.29%2C0.2l-0.03%2C0.28l0.25%2C1.04l0.2%2C0.58l0.28%2C0.2l0.44%2C-0.08l0.37%2C0.01l0.74%2C0.1l0.73%2C-0.08l0.21%2C-0.17l0.13%2C-0.2l-0.17%2C-0.73l-0.35%2C-0.65L247.13%2C279.44zM240.46%2C262.45l0.2%2C0.22l0.18%2C0.22l0.2%2C0.05l0.34%2C-0.01l0.06%2C-0.2l0.56%2C-0.21l0.33%2C-0.64l0.27%2C-0.22l0.16%2C0.12l0.38%2C-0.4l-1.39%2C-0.4l-0.91%2C0.35L240.46%2C262.45zM239.14%2C262.29l0.31%2C-0.3l0.36%2C-0.01l0.24%2C-0.33l-0.07%2C-0.65l-0.32%2C-0.37l-0.04%2C-0.12l-0.06%2C-0.16l-0.38%2C-0.21l-0.43%2C0.11l-0.12%2C0.19l-0.23%2C-0.04l-0.35%2C0.29l-0.16%2C0.4l-1.15%2C1.23l-0.54%2C1.46l0.05%2C0.84l0.33%2C0.09l0%2C0.25l0.19%2C0.36l0.23%2C0.01l0.21%2C-0.03l0.32%2C-0.4l0.14%2C0.07l-0.14%2C0.4l0.1%2C0.09l0.13%2C0.06l0.18%2C-0.1l0.23%2C-0.31l-0.18%2C-0.22l0.21%2C-0.64l0.13%2C-0.17l0.31%2C-0.14l-0.08%2C0.44l0.49%2C-0.43l0.08%2C-0.28l0.15%2C-0.41l0%2C-0.2l0.15%2C-0.63L239.14%2C262.29zM236.9%2C266.57l0.15%2C-0.33l-0.12%2C-0.27l-0.65%2C-0.25l-0.27%2C0.14l-0.8%2C-0.23l-0.34%2C0.22l-0.06%2C0.67l-0.52%2C0.68l0.4%2C0.04l0.46%2C0.41l0.85%2C-0.31l0.04%2C-0.67l0.38%2C-0.64l0.26%2C0.35l-0.19%2C0.45L236.9%2C266.57zM248.02%2C282.7l-0.32%2C-0.04l-0.45%2C0.2l-0.38%2C-0.3l-0.67%2C-0.27l-0.85%2C0.11l-0.34%2C-0.39l-0.91%2C-0.2l-0.99%2C-1.26l0.67%2C-0.74l-0.14%2C-0.56l-0.43%2C-0.12l-0.09%2C0.12l0.21%2C0.35l-0.53%2C0.32l-0.29%2C0.43l-0.36%2C0.42l0.29%2C0.27l-0.03%2C0.18l-0.59%2C0.27l-0.32%2C-0.37l-0.8%2C-0.18l-0.57%2C0.25l-0.09%2C0.45l-0.05%2C0.55l-0.22%2C0.29l0.55%2C0.96l-0.23%2C0.38l-0.13%2C0.74l0.07%2C0.11l1.4%2C-0.51l0.32%2C0.35l1.46%2C-0.24l0.62%2C0.13l-0.14%2C0.24l0.1%2C0.27l0.61%2C-0.2l0.38%2C0.15l0.95%2C-0.48l0.53%2C-0.01l0.21%2C0.22l1.66%2C-1.03l0.19%2C-0.43L248.02%2C282.7zM267.97%2C258.41l0.17%2C-0.44l-0.62%2C-0.66l-1.43%2C-0.06l-0.63%2C0.47l-0.74%2C1.13l0.28%2C-0.16l-0.11%2C0.21l0.29%2C0.09l0.41%2C-0.28l0.39%2C0.17L267.97%2C258.41zM274.79%2C250.38l0.89%2C0.14l0.11%2C-0.3l-0.14%2C-0.58l-0.49%2C-0.71l-0.79%2C-0.54l-0.42%2C-0.54l-0.18%2C-1.69l-0.85%2C-1.1l-0.87%2C-0.28l-1.05%2C0.33l-0.41%2C0.44l-0.85%2C-0.14l-0.48%2C0.14l-0.27%2C0.75l0.08%2C0.55l-0.14%2C0.14l-0.69%2C0.24l-0.15%2C0.78l-0.82%2C0.71l0.06%2C0.93l-0.13%2C0.24l-0.31%2C0.22l-0.21%2C1.25l0.15%2C1.1l-0.34%2C0.38l-0.82%2C0.77l0.01%2C0.38l0.4%2C0.67l0.68%2C0.83l0.77%2C-0.11l0.98%2C-0.7l0.11%2C-0.35l0.85%2C-0.55l0.57%2C-0.59l0.81%2C0.34l0.71%2C-0.1l1.72%2C-0.14l0.82%2C-0.58l0.51%2C-0.77l-0.38%2C-0.58l-0.71%2C-0.29l0.11%2C-0.41L274.79%2C250.38zM259.95%2C270.02l0.24%2C-0.03l0.15%2C-0.39l-0.11%2C-0.17l-0.53%2C-0.09l-0.81%2C0.35l-0.49%2C0.44l-0.42%2C0.71l0.55%2C0.28l0.53%2C0.1l0.11%2C0.29l0.39%2C0.28l0.36%2C-0.03l-0.07%2C-0.31l0.27%2C-0.43l-0.15%2C-0.28l-0.04%2C-0.51L259.95%2C270.02zM274.54%2C245.9l0.03%2C0.31l0.14%2C0.86l0.79%2C1.57l0.58%2C0.81l-0.09%2C1.06l-0.25%2C0.85l-0.34%2C0.31l0.12%2C0.16l1.21%2C-0.19l0.42%2C-0.07l0.79%2C-0.32l0.65%2C-0.05l0.3%2C-1.87l0.05%2C-1.38l-0.74%2C0.26l-1.05%2C-0.07l-0.5%2C-2.04l0.66%2C-0.24l-0.55%2C-0.63l-0.07%2C-0.35l-0.47%2C-0.33l-0.39%2C0.16l-0.18%2C0.6L274.54%2C245.9zM265.85%2C242.02l-0.9%2C1.5l-0.46%2C0.01l-0.43%2C-0.35l-0.26%2C-1.04l-0.33%2C-0.08l-0.41%2C-0.87l-0.97%2C1.19l0.08%2C0.82l-0.83%2C1.46l-0.06%2C1.48l-1.44%2C0.15l-1.49%2C2.23l-0.46%2C0.47l-0.81%2C0.41l-0.45%2C0.82l-0.34%2C1.13l-0.76%2C0.37l-0.32%2C-0.49l0.04%2C-0.36l0.95%2C-1.39l0.06%2C-0.34l-0.24%2C-0.58l0.14%2C-0.43l-0.11%2C-0.41l-0.35%2C-0.35l0%2C-0.45l-0.5%2C-0.43l-0.35%2C-2.42l0.06%2C-0.28l0.75%2C-0.14l0.42%2C-0.36l0.23%2C-0.59l0.05%2C-0.36l-0.26%2C-0.68l0.15%2C-0.35l-0.53%2C-0.73v-0.5l0.94%2C-0.35l0.62%2C-0.55l0.65%2C0.39l0.27%2C-0.01l0.27%2C-0.21l0.82%2C-1.68l-0.38%2C-1.21l0.23%2C-0.4l-0.01%2C-0.36l-0.26%2C-0.35l-1.69%2C-0.4l-0.13%2C-0.35l0.06%2C-1.17l0.4%2C-1.34l0.71%2C-0.92l0.81%2C-1.09l-0.4%2C-0.79l0.67%2C-1.01l0.5%2C-0.7l0.35%2C-1.24l-0.45%2C-0.8l0.59%2C-0.8l0.24%2C-1.18l-0.45%2C-1.85l0.04%2C-0.68l0.32%2C-0.84l1.25%2C-1.11l-0.43%2C-0.33l-0.8%2C0.05l-1.21%2C0.82l-0.59%2C-0.3l-0.91%2C-0.09l-1.07%2C0.1l-1.04%2C0.74l-0.77%2C1.81l0.12%2C1.28l-0.84%2C0.69l-0.58%2C1.66l0.13%2C0.53l0.46%2C0.32l0.58%2C0.83l1.14%2C0.55l0.77%2C0.65l-0.3%2C0.22l-0.61%2C-0.02l-0.58%2C-0.38l-1.42%2C-0.32l-0.57%2C0.55l-0.53%2C0.1l-0.82%2C-0.04l-0.36%2C0.23l0.36%2C0.44l0.09%2C0.27l-0.27%2C0.77l0.13%2C0.22l-0.25%2C1.08l0.01%2C0.85l0.97%2C0.92l0.35%2C0.22l0.48%2C0.16l1.18%2C-0.32l0.61%2C-0.41l0.63%2C0.41l-0.4%2C0.18l-1.42%2C0.65l-1.07%2C0.24l-1%2C-0.25l-0.33%2C-0.17l-0.2%2C0.26l-0.22%2C0.2l-0.13%2C0.49l0.29%2C1.38l0.6%2C1.21l-0.3%2C0.61l0.65%2C0.67l0.34%2C0.66l1.33%2C0.3l-0.01%2C0.22l-0.44%2C0.32l-0.77%2C0.21l-0.83%2C-0.06l-0.41%2C-0.3l-0.46%2C0.23l-0.55%2C0.5l-0.75%2C1.05l-0.65%2C0.38l-0.91%2C0.32l-0.06%2C0.3l0.47%2C0.56l-0.05%2C0.26l-0.37%2C0.19l-0.22%2C-0.26l-0.71%2C-0.21l-0.86%2C-0.1l-0.68%2C0.28l0.04%2C0.6l-0.28%2C0.94l-0.35%2C1.03l1%2C0.28l0.89%2C-0.01l0.05%2C0.47l-0.65%2C0.43l-0.4%2C0.71l0.11%2C0.43l0.36%2C0.19l0.41%2C0.9l2.32%2C0.57l1.08%2C0.23l-0.69%2C0.21l-0.98%2C0.22l-1.87%2C-0.53l-0.39%2C-0.09l-0.49%2C0.31l-0.25%2C1.24l-0.42%2C0.52l-0.56%2C0.83l-0.35%2C0.19l-0.71%2C1.27l-0.12%2C0.28l-0.72%2C1.36l-0.19%2C0.47l-0.35%2C1.08l-0.21%2C0.6l-0.56%2C0.42l-0.79%2C1.03l-0.1%2C0.33l0.19%2C0.33l1.6%2C-0.02l0.08%2C0.01l0.04%2C0.25l0.24%2C0.09l0.38%2C0.07l0.56%2C-0.07l0.52%2C-0.61l0.05%2C-0.85l0.48%2C-0.17l0.44%2C0.06l-0.27%2C0.42l0.32%2C0.29l0.33%2C-0.87l0.57%2C-0.43l0.17%2C-0.02l0.69%2C-1.41l0.14%2C-0.63l-0.01%2C-0.2l0.33%2C-0.39l0.49%2C-0.43l0.54%2C-0.77l0.4%2C0.06l0.63%2C-0.67l0.76%2C-0.49l0.36%2C-0.35l1.33%2C-1.72l0.84%2C-0.83l0.27%2C-0.38l0.91%2C-1.31l0.09%2C-0.79l0.29%2C-0.09l0.05%2C0.48l0.61%2C0.21l0.22%2C0.36l-0.65%2C0.01l-0.84%2C0.81l-0.91%2C1.28l-0.28%2C0.62l0.02%2C0.48l-0.45%2C0.71l-0.84%2C0.89l-1.09%2C0.81l-0.56%2C0.81l-0.25%2C0.5l-0.44%2C0.65l-0.24%2C0.86l0.38%2C0.4l0.35%2C0.11l0.36%2C-0.19l0.29%2C-0.6l0.45%2C-0.13l0.64%2C0.67l0.05%2C0.04l0.68%2C0.37l0.2%2C-0.81l0.69%2C-0.07l-0.25%2C0.58l0.15%2C0.49l0.16%2C0.19l0.32%2C0.09l0.62%2C-0.43l1.19%2C0.76l-0.14%2C0.22l-0.61%2C-0.06l0.15%2C0.99l0.36%2C-0.24l0.63%2C0.47l0.95%2C-0.5l-0.26%2C-0.53l-0.07%2C-0.33l0.29%2C-0.31l0.38%2C-0.25l0.92%2C-0.8l-0.12%2C-0.55l0.21%2C-0.62l-0.38%2C-0.12l-0.1%2C-0.21l0.67%2C-0.64l0.55%2C0.07l0.14%2C-0.75l-0.48%2C-0.37v-0.62l0.4%2C-0.32l0.5%2C0.16l0.52%2C0.66l0.57%2C0.01l0.27%2C-0.36l0.09%2C-0.86l0.1%2C-0.63l0.56%2C-0.87l0.16%2C-1.16l0.21%2C-0.13l0.23%2C0.21l-0.14%2C1.15l-0.05%2C1.02l-0.31%2C1l-0.17%2C0.79l-0.11%2C0.75l0.18%2C0.42l0.76%2C-0.14l1.32%2C-0.72l0.66%2C-0.62l0.11%2C-0.31l-0.04%2C-0.74l0.47%2C-0.82l-0.06%2C-0.69l0.56%2C-0.93l1.03%2C-0.8l0.3%2C-0.74l0.31%2C-1.74l-0.02%2C-0.46l0.71%2C-0.68l1.42%2C-0.88l0.32%2C-0.62l0.68%2C-0.51l0.23%2C-0.02l0.4%2C0.39l0.36%2C0.11l0.71%2C-0.55l2.03%2C-0.18l0.96%2C0.61l0.37%2C0.02l-0.07%2C-0.23l0.23%2C-0.46l-1.3%2C-0.78l-0.94%2C-0.35l-0.78%2C-0.5l-0.47%2C-0.7l-0.91%2C-0.41l0.12%2C-0.48l-0.36%2C-0.65l-1.13%2C0.31l-0.6%2C0.54l-0.78%2C-0.06l-0.48%2C0.65L265.85%2C242.02zM236.36%2C229.7l-0.21%2C-0.31l-0.4%2C-0.01l0.27%2C-0.28l-0.12%2C-0.35l-0.95%2C0.9l-0.39%2C1.01l0.93%2C-0.22L236.36%2C229.7zM235.83%2C228.36l-0.24%2C-0.8l0.48%2C-0.65l-0.33%2C-0.76l-0.64%2C0.48l-0.02%2C0.3l0.54%2C0.17l-0.25%2C0.26l-0.05%2C0.34l-0.05%2C0.24l-0.53%2C0.3l0.02%2C0.31l0.43%2C0.3L235.83%2C228.36zM236.01%2C228.38l0.76%2C0.41l-0.08%2C0.7l0.22%2C0.1l0.48%2C-0.32l0.17%2C-0.32l-0.02%2C-0.37l-0.26%2C0.02l0.01%2C-0.6l0.13%2C-0.1l-0.09%2C-0.52l-0.3%2C0.15l-0.23%2C-0.26l-0.41%2C0.01l-0.28%2C0.19l0.07%2C0.35L236.01%2C228.38zM227.45%2C237.04l0.13%2C0.2l-0.74%2C0.19l0.28%2C0.8l0.52%2C-0.05l0.15%2C-0.13l0.23%2C-0.71l0.27%2C-0.01l-0.02%2C0.33l0.23%2C-0.04l0.11%2C0.42l-0.65%2C0.71l-0.37%2C0.56l0.11%2C0.47l0.31%2C0.39l-0.46%2C0.65l0.17%2C0.23l0.18%2C0.11l-0.07%2C0.29l-0.07%2C0.38l0.25%2C0.06l0.44%2C0.02l0.15%2C0.07l0.49%2C0.25l0.75%2C-0.52l0.1%2C0.5l0.34%2C-0.6l0.19%2C-0.01l0.47%2C-0.33l0.01%2C-0.36l0.15%2C-0.11l0.68%2C0.31l0.17%2C0.1l0.3%2C-0.4l-0.12%2C-0.28l0.38%2C-0.23l0.27%2C-0.07l0.19%2C-0.25l-0.44%2C-0.22l0.28%2C-0.41l-0.08%2C-0.35l-0.24%2C-0.04l-0.26%2C-0.14l0.25%2C-0.27l0.27%2C-0.23l0.35%2C0.06l-0.08%2C0.54l0.37%2C-0.31l0.08%2C-0.72l-0.12%2C-0.1l0.06%2C-0.23l-0.07%2C-0.15l0.19%2C-0.46l-0.12%2C-0.89l0.19%2C-0.9l0.19%2C0.34l-0.02%2C0.76l0.31%2C0.04l0.14%2C-0.42l0.18%2C0.04l-0.29%2C1.14l0.57%2C-0.23l0.14%2C0.17l-0.07%2C0.48l-0.33%2C0.4l0.1%2C0.54l0.48%2C-0.31l0.32%2C0.28l0.35%2C-0.03l0.19%2C-0.19l-0.11%2C-0.38l0.18%2C-0.5l-0.13%2C-0.06l0.19%2C-0.75l0.31%2C-0.26l0.17%2C-0.08l-0.02%2C-0.47l-0.16%2C-0.25l0.35%2C-0.83l0.06%2C0.48l0.22%2C0.32l-0.17%2C0.7l-0.51%2C0.66l-0.06%2C0.66l0.26%2C0.14l0.16%2C0.58l0.88%2C-1.01l0.13%2C-1.19l0.19%2C0.2l-0.09%2C0.44l0.16%2C0.14l0.02%2C0.44l0.92%2C-0.13l0.24%2C-0.16l0.06%2C-0.43l0.34%2C-0.01l-0.12%2C-0.61l-0.03%2C-0.11l-0.18%2C-0.15l0.26%2C-0.56l0.5%2C-0.27l0.13%2C-0.57l-0.43%2C-0.46l0.22%2C-0.18l0.49%2C0.36l0.11%2C0.3l0.02%2C0.6l-0.07%2C0.15l-0.02%2C0.26l0.16%2C0.33l-0.11%2C0.13l0.22%2C0.25l0.41%2C-0.15l0.95%2C-1.46l-0.17%2C-0.11l0.13%2C-0.27l0.16%2C-0.24l0.1%2C-0.26l0.33%2C0.23l0.17%2C-0.09l-0.16%2C-0.15l-0.04%2C-0.25l-0.4%2C-0.06l-0.19%2C-0.87l-0.43%2C-0.35l-0.64%2C-0.04l-0.21%2C-0.35l0.45%2C0.24l0.79%2C0.08l1.15%2C0.33l0.34%2C0.21l0.86%2C0.08l0.06%2C0.13l-0.14%2C0.42l-0.16%2C0.39l-0.13%2C0.4l0.54%2C0.92l-0.23%2C0.72l0.58%2C0.33l0.17%2C0.57l-0.62%2C-0.3l-0.44%2C-0.64l-0.61%2C-0.35l-0.73%2C1.11l-0.32%2C0.22l-0.13%2C0.52l0.29%2C0.4l-0.29%2C0.1l-0.21%2C0.2l-0.62%2C-0.18l-0.85%2C0.28l-0.22%2C0.23l-0.16%2C-0.06l-0.39%2C-0.11l-0.01%2C0.21l-0.73%2C0.49l-0.11%2C0.25l-0.57%2C0.15l0.08%2C-0.3l-0.54%2C0.12l-0.19%2C0.13l-0.23%2C-0.05l-0.63%2C0.74l-0.55%2C0.12l-0.16%2C0.6l0.13%2C0.06l0.51%2C-0.4l0.08%2C0.08l-0.07%2C1.02l0.21%2C0.31l0.93%2C-0.17l0.51%2C0.68l-0.1%2C0.18l-0.6%2C-0.2l-0.23%2C0.78l0.26%2C0.18l-0.14%2C0.16l0.12%2C0.14l1.32%2C0.21l0.99%2C-0.28l0.88%2C0.19l0.52%2C0.39l0.73%2C-0.01l0.7%2C-1.1l1.23%2C-0.8l-0.05%2C-0.2l0.29%2C-0.16l0.4%2C0.2l0.38%2C-0.22l0.42%2C-0.7l1.52%2C-0.5l0.51%2C-0.63l1.05%2C-0.5l1.03%2C-0.78l1.02%2C-1.34l-0.2%2C-2.76l-0.95%2C-1.03l-0.59%2C-0.27l-1.65%2C-0.34l0.68%2C-0.39l-0.02%2C-0.82l0.36%2C-0.23l-0.02%2C-0.36l-0.43%2C-0.46l-0.39%2C-0.05l-0.13%2C-0.27l0.62%2C-0.3l0.64%2C0.34l0.95%2C-0.28l0.17%2C-0.56l-0.28%2C-0.06l0.06%2C-0.77l0.37%2C-0.46l0.26%2C-0.97l-0.04%2C-0.51l-0.15%2C-0.28l-0.35%2C0.16l-0.28%2C-0.13l-0.55%2C-0.68l-0.23%2C0.01l-0.1%2C0.59l-0.43%2C0.53l-0.44%2C0.76l-0.5%2C0.27l-0.08%2C-0.17l0.03%2C-0.6l0.29%2C-0.08l-0.11%2C-0.53l0.12%2C-0.1l0.26%2C0.04l0.2%2C-0.38l-0.08%2C-0.37l0.33%2C-1.27l0.06%2C-0.58l-0.24%2C-0.27l-0.34%2C-0.4l-0.58%2C-0.33l-0.19%2C-0.38l-0.35%2C-0.19l-0.19%2C0.19l-0.32%2C-0.12l0.22%2C-0.24l0.03%2C-0.35l-0.57%2C0.27l-0.34%2C-0.24l-0.15%2C-0.13l0.13%2C-0.31l-0.11%2C-0.12l0.21%2C-0.08l0.61%2C0.36l0.34%2C-0.12l-0.25%2C-0.18l-0.08%2C-0.31l-0.61%2C-0.15l-0.03%2C-0.34l-0.26%2C-0.24l0.14%2C-0.29l0.19%2C-0.31l-0.14%2C-0.11l-0.26%2C-0.24l-0.02%2C-0.38l0.54%2C-0.27l-0.06%2C-0.11l-0.13%2C-0.19l-0.06%2C-0.99l0.13%2C-0.06l-0.04%2C-0.29l-0.19%2C-0.13l0.14%2C-0.45l-0.24%2C-0.06l-0.12%2C-0.29l-0.32%2C-0.1l-1.14%2C0.11l-0.17%2C0.14l0.02%2C0.24l-0.77%2C0.73h-0.48l-0.19%2C0.21l-0.34%2C0.03l0.19%2C0.57l-0.27%2C0.68l0.02%2C0.65l-0.2%2C0.22l0.29%2C0.86l-0.24%2C0.37l0.08%2C0.4l0.56%2C0.22l0.17%2C0.96l0.98%2C0.73l0.01%2C0.33l-0.22%2C0.11l-0.54%2C-0.75l-0.11%2C0.26l-0.33%2C0.13l0.45%2C0.55l-0.31%2C0.28l-0.26%2C0.28l0.34%2C0.27l0.37%2C-0.49l0.55%2C-0.27l-0.05%2C0.31l0.15%2C0.18l-0.33%2C0.82l-0.24%2C0.3l-0.07%2C0.2l0.79%2C0.46l0.28%2C0.08l0.08%2C0.35l0.78%2C0.36l-0.06%2C1.77l0.37%2C0.59l-0.41%2C0.02l-0.38%2C-0.41l-0.09%2C-0.57l-0.1%2C-0.38l0.09%2C-0.45l-0.38%2C-0.12l-0.45%2C-0.81l-0.88%2C-0.15l-0.18%2C0.25l0.1%2C0.69l-0.21%2C0.98l0.17%2C0.39l-0.18%2C0.43l0.16%2C1.28l-0.48%2C-0.35l-0.1%2C-0.31l0.14%2C-0.7l-0.24%2C-0.2l0.22%2C-0.31l0.01%2C-0.71l-0.06%2C-0.15l-0.27%2C-0.03l0.07%2C-0.46l-0.26%2C-0.06l-0.19%2C-0.29l0.01%2C-0.77l-0.51%2C-0.26l-1.02%2C0.81l-0.29%2C0.01l-0.26%2C0.31l0.15%2C0.73l0.54%2C0.72l1.09%2C0.76l-0.4%2C0.25l-0.58%2C-0.06l-0.27%2C0.83l0.48%2C0.61l0.61%2C0.39l0.45%2C0.52l-1.14%2C-0.68l-0.52%2C0.45l-0.08%2C0.35l0.01%2C0.25l-0.27%2C0.58l0.14%2C0.99l-0.26%2C0.32l-0.3%2C-0.16l-0.02%2C-0.42l0.19%2C-1.15l-0.2%2C-0.25l-0.59%2C0.47l0.68%2C-1.01l0.19%2C-0.25l-0.12%2C-0.37l-0.09%2C-0.14l-0.25%2C-0.16l-0.36%2C0.02l-0.5%2C0.19l-0.5%2C0.32l-1.19%2C0.4l-0.25%2C1.09l-0.46%2C0.42h-0.29l-0.38%2C0.3l0.06%2C-0.54l0.2%2C-0.23l-0.11%2C-0.15l-0.19%2C-0.1l-0.32%2C0.18l-0.06%2C-0.14l0.29%2C-0.65l-0.11%2C-0.82l0.3%2C-0.44l-0.17%2C-0.57l0.22%2C-0.51l-0.08%2C-0.2l0.02%2C-0.23l0.04%2C-0.39l-0.05%2C-0.39l-0.39%2C-0.25l-0.15%2C0.01l-0.3%2C0.07l-0.55%2C0.04l-0.26%2C0.27l-0.14%2C0.51l-0.11%2C0.83l0.03%2C0.58l0.25%2C0.11l-0.03%2C0.67l-0.31%2C0.39l-0.15%2C0.67l-0.18%2C0.4l-0.11%2C0.25l0.05%2C0.91l0.14%2C0.27l0.74%2C-0.01l-0.11%2C0.46l-0.75%2C0.47l0.34%2C-0.66l-0.34%2C0.01l-0.42%2C-0.48l-0.04%2C-0.11l0.11%2C-0.27l-0.13%2C-0.29l0.25%2C-0.74l-0.22%2C-0.05l-0.05%2C-0.27l0.18%2C-0.53l0.02%2C-0.98l-0.2%2C-0.72l-0.18%2C-0.26l-0.37%2C-0.08l-0.07%2C-0.28l-0.25%2C0.04l-0.27%2C0.25l0.41%2C0.06l-0.06%2C0.27l-0.29%2C0.2l-0.49%2C1.03l-0.97%2C0.41l-0.16%2C0.26l-0.12%2C0.08l-0.26%2C0.44l-0.17%2C0.29l-0.15%2C0.12l0.17%2C0.26l0.33%2C-0.17l0.33%2C0.18l-0.25%2C0.42l0.35%2C0.27l0.9%2C-0.11l0.25%2C0.37l0.06%2C0.23l0.43%2C0.07l-0.13%2C0.31l-0.06%2C0.11l-0.46%2C0.04l-0.37%2C0.06l-0.31%2C-0.18l-0.36%2C0.16l-0.39%2C0.46l-0.45%2C0.06l-0.39%2C0.61l0.12%2C0.4l0.89%2C0.64l-1.39%2C-0.27l-0.62%2C0.51l-0.2%2C0.45l0.71%2C0.06l0.16%2C0.21H227.45zM237.69%2C248.51l0.26%2C0.02l0.33%2C0.06l0.3%2C-0.11l1.19%2C-1.35l0.94%2C-0.72l0.23%2C-1.03l-0.27%2C-0.67l-1.41%2C-0.01l-0.11%2C-0.08l-0.17%2C-0.1l-0.2%2C-0.49l-0.33%2C0.01L238%2C243.7l-0.5%2C0.08l-0.02%2C0.33l-0.22%2C-0.01l-0.36%2C-0.42l-0.67%2C-0.26l-0.28%2C0.15l-0.12%2C-0.14l-0.71%2C0.13l-0.82%2C-0.1l-0.38%2C-0.54l-0.28%2C-0.04l-0.74%2C0.49l-0.07%2C0.21l-0.3%2C0.04l-0.29%2C0.57l-0.25%2C0.13l-0.02%2C0.54l0.12%2C0.02l-0.12%2C0.35l0.55%2C0.11l-0.03%2C0.25l0.72%2C0.46l0.06%2C0.38l0.13%2C0.31l0.44%2C0.1l0.23%2C0.19l0.09%2C0.43l0.52%2C0.26l-0.5%2C0.53l0.31%2C0.24l-0.03%2C0.11l0.07%2C0.3l0.39%2C-0.18l0.21%2C-0.41l0.31%2C0.11l-0.13%2C0.22l0.19%2C0.08l0.96%2C-0.15l0.26%2C-0.08l0.1%2C-0.11L237.69%2C248.51zM250.9%2C224.22l1.07%2C0.81l0.15%2C-0.12l0.91%2C-1.11l0.6%2C-1.08l0.51%2C-1.49l0.23%2C-1.46l0.4%2C-1.55l-0.36%2C-0.76l-0.35%2C-0.2l-0.32%2C0.03l-0.26%2C-0.23l-0.17%2C-0.61l0.15%2C-0.12l0.85%2C0.1l0.96%2C0.61l-0.04%2C0.7l-0.01%2C0.99l0.2%2C0.1l0.31%2C-0.17l0.73%2C-0.9l0.17%2C-0.24l0.91%2C-0.28l0.8%2C-0.65l1.32%2C-0.69l1.38%2C-0.91l-0.11%2C-0.94l0.29%2C-0.65l0.5%2C-1.39l0.37%2C-0.62l0.41%2C-0.62l0.72%2C-1.07l0.56%2C-0.75l0.46%2C-0.6l0.72%2C-0.26l0.97%2C-1.23l0.36%2C-1.23l0.05%2C-1.83l0.07%2C-0.39l0.2%2C-1.76l0.4%2C-0.83l0.97%2C-0.93l0.13%2C-1.3l-0.01%2C-0.39l-0.48%2C-0.6l-0.44%2C-0.41l-0.25%2C-0.69l0.1%2C-0.75l-0.18%2C-0.12l-0.22%2C0.01l-1.1%2C0.73l-0.71%2C1.03l-0.44%2C0.19l-0.4%2C-0.27l-0.18%2C0.1l-0.06%2C0.64l-0.38%2C0.55l-0.46%2C0.4l-1.51%2C0.75l-0.74%2C0.59l-0.29%2C1.01l-0.13%2C0.93l0.37%2C0.11l0.15%2C1.1l-0.25%2C0.38l-0.67%2C0.28l-0.09%2C0.74l-0.03%2C1.09l-0.6%2C0.75l-0.91%2C0.74l-0.65%2C0.24l-1.23%2C0.06l-0.65%2C0.44l-0.62%2C0.37l-1.04%2C1.2l-0.14%2C0.52l-0.18%2C0.71l-0.4%2C1.29l-0.54%2C1.31l-0.24%2C0.94l-0.21%2C0.58l-0.54%2C0.81l-0.09%2C0.56l-0.64%2C0.74l-0.32%2C1.09l0.42%2C3.11l-0.33%2C1.46l-0.27%2C0.22L250.9%2C224.22zM246.21%2C220.48l0.3%2C0.31l0.27%2C0.37l0.29%2C0.1l0.32%2C-0.16l-0.12%2C-0.35l0.54%2C-0.61l-0.12%2C-0.23l-0.21%2C-0.4l-0.26%2C0.02l-0.12%2C-0.19l-0.25%2C0.13l-0.21%2C0.2l-0.3%2C0.05l-0.39%2C0.33l0%2C0.27L246.21%2C220.48zM237.58%2C224.08l0.46%2C0.2l-0.01%2C0.36l0.33%2C0.3l0.58%2C-0.04l0.67%2C-0.2l0.36%2C-0.03l0.36%2C0.02l0.6%2C-0.75l0.07%2C-0.81l-0.28%2C-0.27l-0.04%2C-0.14l0.18%2C-0.04l-0.11%2C-0.21l-0.27%2C-0.23l-0.13%2C-0.82l-0.16%2C0.02l-0.07%2C-0.19l-0.41%2C0.35l-0.55%2C0.08l-0.69%2C-0.92l-0.69%2C0.31l0.02%2C0.55l-0.43%2C0.1l0.02%2C0.29l0.4%2C0.28l-0.04%2C0.35l-0.57%2C0.8l0.09%2C0.13l-0.17%2C0.4l-0.02%2C0.23l0.09%2C0.11L237.58%2C224.08zM196.29%2C364.9l0.21%2C-0.21l0.06%2C-0.59l-0.31%2C-0.42l-0.09%2C-0.46l-1.04%2C0.84l-0.2%2C0.95l0.6%2C0.24L196.29%2C364.9zM193.38%2C363.92l0.2%2C-0.29l0.09%2C-0.09l0.01%2C-0.56l-0.42%2C-0.12l-0.37%2C-0.03l-0.06%2C0.59l-0.18%2C0.32l0.19%2C0.25L193.38%2C363.92zM173.35%2C308.87l0.09%2C0.19l-0.13%2C0.31l0.64%2C-0.3l0.17%2C-0.07l0.34%2C0.01l0.37%2C-0.22l0.42%2C-0.85l-0.88%2C0.08L173.35%2C308.87zM251.81%2C278.85l0.02%2C0.16l0.05%2C0.43l1.22%2C0.32l0.88%2C0.31l0.75%2C0.15l1.66%2C-0.25l0.74%2C-0.36l0.43%2C-0.15l0.09%2C-0.23l-0.4%2C-0.06l-0.49%2C-0.01l-0.16%2C-0.2l0.14%2C-0.33l0.89%2C-0.12l0.44%2C0.31l0.4%2C0.62l0.43%2C0.34l0.96%2C0.36l0.44%2C0.47l1.1%2C-0.17l0.43%2C-0.59l0.39%2C-0.61l0.01%2C-0.42l-0.16%2C-0.38l-0.39%2C-0.31l-0.33%2C-0.22l-0.38%2C-0.21l-0.57%2C-0.12l-0.42%2C0.02l-0.64%2C0.06l-0.91%2C0.15l-0.93%2C-0.21l-1%2C-0.5l-0.86%2C0.29l-0.67%2C0.06l-0.56%2C0.15l-0.74%2C0.32l-0.45%2C0.09l-0.49%2C0.18l-0.07%2C0.43l0.08%2C0.31l-0.27%2C0.14L251.81%2C278.85zM242.46%2C301.28l0.7%2C-0.43l0.74%2C-1.23l-0.43%2C-0.05l-1.73%2C0.58l-0.08%2C0.1l-0.29%2C0.3l-0.11%2C0.18l-0.1%2C0.36l-0.01%2C0.33L242.46%2C301.28zM270.99%2C276.84l0.24%2C-0.34l0.28%2C-1.87l-0.46%2C-0.09l-0.74%2C-1.08l-0.4%2C0.05l-1.43%2C1.13l-0.51%2C0.55l0.13%2C0.45l0.37%2C0.06l0.74%2C0.43l0.59%2C-0.12l0.32%2C0.68L270.99%2C276.84zM228.58%2C325.62l-1.64%2C0.73l-0.89%2C0.63l0.18%2C0.78l-0.12%2C0.34l0.14%2C0.29l0.28%2C0.11l1.27%2C-1.02l1.7%2C-0.47l2.56%2C-1.06l-0.34%2C-0.66l-0.34%2C-0.14l-0.8%2C0.12l-0.35%2C-0.01l-0.55%2C-0.09l-0.72%2C0.17L228.58%2C325.62zM169.52%2C420l0.42%2C-0.02l0.76%2C-0.94l1.14%2C-1.41l0.26%2C-0.43l0.4%2C-0.72l0.37%2C-0.91l-0.13%2C-0.94l-0.22%2C-0.9l-0.32%2C-0.37l-0.51%2C0.05l-1.3%2C-0.31l-0.31%2C-0.16l-0.62%2C0.29l-0.58%2C0.38l-0.59%2C0.31l-0.63%2C0.71l-0.31%2C0.91l-0.38%2C1.52l-0.51%2C1.01l-0.24%2C0.48l0.28%2C0.26l0.51%2C0.01l0.82%2C-0.26l0.44%2C0.07l0.16%2C0.27l0.23%2C0.66L169.52%2C420zM312.48%2C250.65l0.24%2C-4.55l-2.47%2C-4.68l-4.21%2C0.57l-6.04%2C0.31l-0.68%2C-0.1l-4.44%2C1.96l-2.04%2C0.45l-1.63%2C0.14l-7.62%2C-0.99l-0.97%2C1.27l-0.91%2C0.77l-1.51%2C1.7l-0.96%2C0.34l0.13%2C0.94l-0.13%2C0.61l-0.01%2C1.88l1%2C0.06l0.73%2C-0.41l2.31%2C-0.46l0.83%2C-0.24l0.25%2C-0.53l0.65%2C-1.05l0.55%2C-1.12l1.11%2C-0.68l0.28%2C0.01l1.33%2C1.12l1.07%2C1.46l-0.19%2C0.32l-0.9%2C0.18l-0.69%2C0.64l-0.28%2C0.42l0.19%2C0.41l1.45%2C0.02l2.85%2C-0.47l1.58%2C-0.67l1.72%2C-1.68l1.04%2C-1.26l0.42%2C-0.33l1.52%2C-0.46l0.76%2C-0.9l0.66%2C-0.33l0.18%2C0.04l0.38%2C0.6l-0.19%2C1.2l-1.03%2C1.43l-0.94%2C0.96l-0.19%2C0.91l0.48%2C0.09l1.15%2C-0.28l0.69%2C-0.21l1.38%2C-0.11l0.73%2C0.61l0.99%2C0.85l0.47%2C0.4l1.64%2C1.57l1.14%2C0.26l1.01%2C-0.22l0.34%2C0.25l-1.76%2C0.54l-0.77%2C-0.21l-1.45%2C-1.45l-2.18%2C-0.91l-0.43%2C0.11l-0.73%2C-0.1l-1.23%2C-0.51l-1.67%2C0.13l-1.12%2C0.33l-0.5%2C0.33l-0.21%2C0.69l0.41%2C0.1l0.7%2C0.42l0.36%2C0.88l1.47%2C0.82l1.88%2C0.96l0.14%2C0.17l-0.07%2C0.26l-0.4%2C0.04l-0.38%2C-0.11l-1.71%2C-1.25l-0.93%2C-0.18l-1.35%2C-1.51l-0.92%2C-0.21l-1.07%2C0.31l0.23%2C0.45l-0.11%2C0.63l-0.85%2C0.19l-0.43%2C0.36l0.06%2C1.62l0.55%2C0.94l0.04%2C1.13l0.21%2C0.44l-0.45%2C0.21l-0.06%2C0.2l0.23%2C0.26l0.87%2C0.25l0.74%2C0.71l1.27%2C1.69l0.24%2C0.75l-0.72%2C0.33l-0.15%2C-0.15l-0.27%2C0.01l-0.03%2C1.33l-0.38%2C0.31l-0.12%2C0.52l0.49%2C0.38l0.26%2C0.72l-0.73%2C0.79l-0.3%2C0.05l-0.22%2C-0.17l0.45%2C-0.58l0.21%2C-0.05l-0.16%2C-0.49l-0.43%2C-0.42l-0.17%2C-0.87l0.54%2C-0.63l0.22%2C-1.77l-0.08%2C-0.44l-1.5%2C-0.99l0%2C-0.23l-0.74%2C-0.73l-0.27%2C-1.77l0.44%2C-0.75l-0.61%2C-1.29l-0.75%2C-1.19l-0.48%2C-0.12l-0.84%2C0.14l-0.44%2C0.64l-0.4%2C-0.29l-1.14%2C0.13l-0.31%2C0.4l0.14%2C0.68l-0.2%2C0.6l-0.57%2C-0.17l-0.98%2C0.26l-1.15%2C0.57l-1.93%2C0.82l-0.09%2C-0.22l0.37%2C-0.44l0.68%2C-0.72l0.65%2C-0.52l0.15%2C-0.35l-0.14%2C-0.84l-0.33%2C-0.44l-0.81%2C-0.46l-0.79%2C-0.11l-0.36%2C-0.38l-0.31%2C-0.47l-0.51%2C-0.49l-0.17%2C-0.05l-1.35%2C0.18l-0.7%2C0.71l-0.13%2C-0.01l-0.09%2C-0.65l-0.3%2C-0.24l-0.19%2C-0.13l-0.75%2C0.07l-0.13%2C0.02l-1.43%2C0.57l-0.88%2C0.22l-0.39%2C0.13l-1.53%2C1.01l-0.89%2C0.42l-0.79%2C0.21l-0.76%2C0.19l-0.72%2C0.31l-0.11%2C0.47l-0.09%2C0.37l0.17%2C0.42l0.32%2C0.09l0.16%2C0.21l-0.42%2C0.6l0.17%2C0.3l0.23%2C0.38l0.31%2C0.07l0.2%2C-0.25l0.22%2C-0.33l0.42%2C0.01l-0.03%2C0.88l1.39%2C0.65l0.46%2C0.09l0.7%2C0.53l1.11%2C0.16l1.56%2C0.88l0.62%2C0.03l0.5%2C0.28l0.36%2C1.03l-0.54%2C0.69l0.37%2C0.57l0.48%2C0.75l0%2C0.43l-0.3%2C0.27l0%2C0.28l0.67%2C0.7l1.72%2C1.31l0.34%2C0.78l0.88%2C0.28l0.65%2C0.6l-0.07%2C0.23l-0.55%2C-0.08l-1.53%2C-0.48l-0.76%2C-1.26l-0.72%2C-0.65l-0.98%2C-0.59l-0.31%2C-0.03l-0.09%2C-0.14l0.3%2C-1.38l-0.27%2C-0.85l-0.67%2C-0.29l-0.15%2C-0.63l-0.59%2C-0.95l-1.59%2C-1.15l-1.24%2C-0.68l-0.72%2C-0.47l-0.77%2C-0.23l-0.72%2C-0.17l-0.2%2C-0.28l-0.7%2C-0.13l0.14%2C0.37l-0.61%2C0.22l-0.45%2C-0.4l0.43%2C-0.47l0.17%2C-0.13l-0.2%2C-0.24l-0.64%2C-0.24l-0.3%2C0.11l-0.19%2C0.28l-0.28%2C0.37l-0.13%2C0.02l-0.5%2C-0.11l-0.18%2C0.12l0.13%2C0.52l-0.16%2C0.28l-0.57%2C1.03l0.08%2C0.44l1.87%2C0.4l0.39%2C0.29l0.51%2C0.58l0.34%2C0.33l0.56%2C-0.09l0.53%2C-0.56l0.4%2C-0.14l0.48%2C1.51l-0.24%2C0.19l-0.88%2C-0.22l-1.71%2C1.01l-0.34%2C-0.39l-0.98%2C0.27l0.24%2C1.42l0.48%2C-0.27l0.76%2C0.3l0.16%2C0.11l2.01%2C-1.03l1.12%2C-0.09l1.16%2C0.15l0.53%2C0.04l0.34%2C0.26l-0.12%2C0.82l2.31%2C1.29l0.8%2C0.1l-0.34%2C0.44l-0.98%2C-0.02l-1.36%2C-1.03l-0.9%2C-0.28l-0.47%2C-0.4l-0.43%2C-0.06l-0.08%2C0.17l0.19%2C0.52l1.43%2C0.45l-0.3%2C0.8l-0.38%2C-0.26l-0.83%2C0.16l-0.43%2C-0.2l-0.44%2C0.06l0.32%2C0.57l0.2%2C-0.1l0.4%2C0.27l-0.08%2C0.41l-0.02%2C0.46l0.08%2C0.68l-0.22%2C0.07l-0.18%2C-0.22l-0.32%2C-0.7l-0.2%2C-0.82l-0.33%2C-0.29l-0.6%2C0.67l-0.14%2C0.41l0.1%2C0.59l0.18%2C-0.01l0.02%2C0.19l-0.9%2C0.21l-0.75%2C-0.72l-0.54%2C0.37l-0.23%2C0.48l0.54%2C0.27l0.91%2C0.42l0%2C0.44l-0.55%2C0.01l0.84%2C0.79l0.27%2C0.47l0.34%2C0.26l0.44%2C-0.07l0.22%2C0.22l1.3%2C-1.43l-0.07%2C-0.44l0.42%2C-0.49l1.12%2C-0.22l0.82%2C0.37l0.3%2C0.47l-0.01%2C0.74l0.7%2C0.73l0.73%2C0.23l1.17%2C-0.01l0.75%2C0.22l-0.42%2C0.8l0.64%2C0.1l-0.81%2C0.64l-0.3%2C-0.55l-0.92%2C-0.43l-1.02%2C-0.14l-0.61%2C-0.32l-0.6%2C-0.89l-0.2%2C-0.78l-0.48%2C-0.54l-0.39%2C-0.02l-0.09%2C0.34l-0.1%2C0.72l-0.39%2C0.18l0.05%2C0.66l-0.2%2C0.16l-0.66%2C-0.02l-0.18%2C0.86l-0.79%2C0.88l-0.04%2C1.31l0.19%2C0.26l1.26%2C-0.12l1.36%2C0.66l0.56%2C-0.14l0.23%2C0.15l0.04%2C0.27l-0.46%2C0.78l-0.82%2C0.33l-0.03%2C0.63l0.59%2C0.97l0.09%2C0.37l0.28%2C-0.06l0.46%2C-0.14l0.01%2C0.16l0.08%2C0.35l-0.86%2C0.32l-0.79%2C-0.69l-0.08%2C-0.62l-0.38%2C-0.71l-0.24%2C-1.36l-0.35%2C-0.53l-0.49%2C-0.17l-0.15%2C0.77l-0.63%2C-0.88l-0.3%2C-0.05l-0.39%2C0.01l-0.09%2C0.23l0.27%2C0.97l0.09%2C0.99l1.89%2C2.5l0.85%2C0.09l-0.26%2C1.13l0.05%2C0.45l0.44%2C0.52l-0.07%2C0.23l-0.65%2C-0.3l-0.42%2C-0.84l-0.02%2C-0.49l-0.88%2C-0.86l-0.7%2C-0.8l-0.58%2C-1.55l-0.16%2C-0.4l-0.67%2C-1.73l-0.4%2C-0.03l-0.65%2C-0.55l-0.17%2C0.2l0.2%2C0.33l-0.15%2C0.32l-0.25%2C0.12l-0.66%2C-0.1l-0.16%2C0.14l0.29%2C0.32l0.48%2C0.17l0.03%2C0.31l0.71%2C0.5l0.15%2C1.03l0.29%2C0.4l0.28%2C1.05l-0.72%2C1.94l0%2C0.89l-0.36%2C0.64l0.56%2C-0.06l1.08%2C0.96l1.76%2C0.65l0.77%2C0.83l0.42%2C0.19h0.61l0.02%2C0.28l-0.65%2C0.71l0.03%2C0.36l0.59%2C0.58l1.07%2C0.44l0.18%2C0.32l-0.51%2C0.18l-0.86%2C-0.47l-1.33%2C-1.47l-1.12%2C-1.28l-0.85%2C-0.16l-1.07%2C-1.49l-0.46%2C-0.01l-0.52%2C0.29l-0.29%2C-0.13l-0.18%2C-0.38l-0.22%2C-0.84l0.59%2C-1.79l0.12%2C-1.59l-0.82%2C-1.43l-0.68%2C-2.14l-0.36%2C-0.25l-0.5%2C0.02l-0.99%2C-1.28l-0.44%2C0.09l0.28%2C-0.35l0.26%2C-1.01l0.43%2C-0.45l0.24%2C-0.7l-0.39%2C-0.11l0.42%2C-1.74l-0.07%2C-0.25l-0.13%2C0.03l0.16%2C-0.22l-0.03%2C-0.52l0.21%2C-0.21l-0.08%2C-0.17l0.31%2C-0.95l0.3%2C-0.38l-0.21%2C-0.36l0.16%2C-0.64l-0.16%2C-0.37l0.13%2C-0.15l-0.62%2C-0.74l-0.1%2C0.12l-0.29%2C0.46l-0.14%2C0.14l-0.37%2C0.3l-0.65%2C0.24l-0.12%2C-0.07l-0.36%2C-0.78l0.77%2C-0.09l0.17%2C-0.45l0.59%2C-0.29l0.68%2C-0.01l-0.54%2C-0.9l-0.39%2C-0.27l-0.39%2C0.07l-0.22%2C-0.12l0.43%2C-0.73l-0.24%2C-0.75l-0.34%2C-0.28l-0.55%2C-0.38l-0.61%2C-0.35l-0.24%2C-0.01l-0.46%2C0.01l-0.72%2C0.49l-0.06%2C0.27l0.19%2C1.18l0.39%2C0.37l0.04%2C0.73l0.04%2C0.58l-0.59%2C0.02l-0.2%2C0.2l-0.51%2C0.49l-0.36%2C-0.2l0.16%2C-0.35l-0.34%2C-0.25l-0.26%2C0.02l-0.37%2C0.43l-0.2%2C0.65l0.23%2C0.83l0.66%2C0.38l0.03%2C0.28l-0.41%2C0.35l0.54%2C0.25l0.11%2C0.29l-0.65%2C0.71l0.55%2C0.46l-0.43%2C0.43l-0.29%2C0.33l-0.56%2C0.5l-0.39%2C-0.24l-0.49%2C0.38l0.09%2C0.89l-0.37%2C0.01l-0.54%2C-0.26l-0.42%2C-0.02h-0.46l0.38%2C0.79l-1.72%2C0.01l-0.11%2C0.96l0%2C0.33l-0.17%2C0.56l-0.51%2C0.09l0.08%2C-0.69l0.13%2C-0.8l-0.35%2C-0.92l0.36%2C-0.18l-0.07%2C-0.12l-0.53%2C-0.22l-0.32%2C-0.42l0.15%2C-0.31l0.35%2C0.34l0.15%2C0.18l1.69%2C0.16l0.25%2C-0.2l0.22%2C-0.76l-0.04%2C-0.92l-0.15%2C-0.62l0.18%2C-0.54l-0.12%2C-0.67l-0.08%2C-0.27l-0.09%2C-0.09l-0.55%2C-0.01l-0.28%2C-0.12l-0.09%2C-0.34l-0.12%2C-0.5l-0.49%2C-0.01l-0.84%2C0.11l-0.23%2C0.29l0.48%2C0.21l-0.02%2C0.28l-0.05%2C0.51l0.19%2C0.64l0.04%2C0.68l-0.05%2C0.12l-0.41%2C-0.36l-0.26%2C-0.22l-0.18%2C0.04l-0.26%2C0.41l0.36%2C0.53l-0.27%2C0.2l-0.39%2C0.12l-0.72%2C-0.37l0.1%2C1.26l-0.29%2C0.33l-0.16%2C-0.06l-0.39%2C-0.31l0%2C-0.52l0.05%2C-0.43l0.21%2C-0.48l0.4%2C-0.25l-0.2%2C-0.44l-0.74%2C-0.28l-0.26%2C0.01l-0.55%2C0.17l-0.88%2C0.63l-0.1%2C0.24l0%2C0.7l-0.17%2C0.51l-0.71%2C0.52l-0.55%2C0.23l-0.44%2C1.51l-0.63%2C0.84l-0.49%2C0.34l-0.07%2C0.73l0.38%2C1.43l0.22%2C0.31l0.29%2C0.31l0.49%2C0.15l0.82%2C-0.36l0.2%2C0.21l-0.23%2C0.49l-0.01%2C0.12l0.38%2C0.28l0.56%2C0.42l0.35%2C-0.22l0.21%2C-0.78l0.19%2C-0.36l-0.05%2C-0.52l-0.74%2C-0.17l-0.24%2C-0.69l1.06%2C-0.23l1.14%2C-0.43l0.3%2C-0.26l0.01%2C-0.31l0.14%2C-0.2l0.35%2C-0.17l0.08%2C-0.67l-0.39%2C-0.97l0.1%2C-0.45l0.46%2C0.74l0.77%2C0.31l0.24%2C0.67l0.08%2C1.17l-0.15%2C0.4l1.27%2C0.02l0.71%2C-0.15l0.77%2C0.03l0.83%2C0.74l0.58%2C0.13l0.78%2C-0.07l0.75%2C-0.29l-0.57%2C-0.37l-0.61%2C0.14h-0.4l-0.06%2C-0.17l0.31%2C-0.45l0.26%2C-0.2l0.96%2C0.36l0.59%2C0.29l0.25%2C0.4l-0.06%2C0.14l1.54%2C0.21l0.45%2C0.45l0.58%2C0.53l0.2%2C0.37l-0.72%2C0.19l0%2C0.55l0.1%2C0.55l-0.4%2C0.61l-0.47%2C0.14l-0.81%2C0.15l0.58%2C0.5l0.6%2C0.14l-0.8%2C0.71l-0.57%2C0.8l0.08%2C0.71l0.31%2C0.32l-0.18%2C0.31l-0.83%2C0.21l-0.13%2C-1.11l-0.61%2C-1.61l-0.71%2C-0.5l-1.25%2C-0.07l-1.9%2C0.63l-0.78%2C0.34l-0.52%2C0.27l0.11%2C0.72l-0.11%2C0.35l-0.16%2C0.26l-0.57%2C0.06l0.14%2C-0.46l-0.34%2C-0.47l-0.76%2C0.09l-1.54%2C0.61l-1.13%2C0.68l-0.83%2C0.09l-0.67%2C0.01l-1.24%2C1.2l-0.09%2C0.71l-1.16%2C1.29l-0.42%2C0.23l-0.23%2C0.47l-0.3%2C0.06l0.16%2C-0.98l0.45%2C-0.08l1.05%2C-1.04l-0.13%2C-0.3l-0.47%2C0.04l-0.28%2C0.24l-0.22%2C-0.29l-0.12%2C-0.28l0.72%2C-0.45l-1.07%2C0.17l-0.27%2C0.37l-0.85%2C0.12l-0.34%2C-0.11l-0.78%2C-0.27l0.33%2C-0.49h-1.81l-0.46%2C0.09l-2.72%2C1.18l-0.76%2C0.48l0.44%2C0.14l0.28%2C0.39l-1%2C0.57l0.21%2C0.23l1.67%2C-0.21l1.27%2C-0.18l2.72%2C-0.71l0.19%2C0.26l-0.03%2C0.4l-0.28%2C0.15l-0.21%2C-0.09l-0.23%2C-0.19l-1.51%2C0.66l-1.39%2C0.08L238.2%2C289l0.39%2C0.4l-0.47%2C0.35l-1.44%2C-1.12l-0.23%2C0.08l-0.16%2C0.35l-0.25%2C0.36l-0.39%2C0.38l0.1%2C0.17l0.1%2C0.49l-0.54%2C0.72l0.02%2C0.18l-0.01%2C0.25l0.44%2C0.27l0.52%2C0.01l0.93%2C-0.67l0.15%2C0.1l-0.25%2C0.89l0.9%2C-0.05l0.1%2C0.22l-1.05%2C0.49l-0.28%2C0.48l0.2%2C0.04l1.15%2C-0.43l0.37%2C-0.06l1.85%2C-0.71l0.72%2C0.07l0.47%2C-0.32l0.4%2C0.08l-1.16%2C0.99l-0.04%2C0.41l0.85%2C-0.08l0.12%2C0.15l-0.42%2C0.46l0.24%2C0.08l1.17%2C-0.27l1.21%2C0.12l-0.67%2C0.57l-1.24%2C0.27l-0.92%2C-0.08l-0.86%2C-0.08l-1.15%2C0.42l-0.61%2C0.5l-1.25%2C-0.23l-0.54%2C0.18l-0.34%2C-0.3l-0.31%2C0.17l-0.52%2C0.79l0.23%2C0.19l0.32%2C-0.28l0.37%2C0.01l-0.01%2C0.31l-0.2%2C0.3l0.07%2C0.08l0.77%2C-0.27l1.02%2C-0.02l0.4%2C0.46l-0.18%2C0.34l-1.02%2C0.65l-1.29%2C0.44l-0.92%2C0.51l-0.27%2C0.39l0.05%2C0.33l0.22%2C0.09l0.41%2C0.58l0.48%2C0.02l0.27%2C-0.01l0.9%2C0.18l1.99%2C-0.2l0.68%2C-0.45l0.98%2C-0.62l1.44%2C-0.79l1.27%2C-1l0.86%2C-0.53l0.3%2C-0.16l0.98%2C-1.36l-0.34%2C-0.35l-0.04%2C-0.26l0.31%2C-0.48l0.84%2C-0.3l1.21%2C-1.02l0.39%2C-0.67l0.57%2C-0.1l0.46%2C-0.43l0.55%2C-0.24l0.47%2C-1.91l0.05%2C-0.45l0.57%2C-0.27l0.2%2C-0.29l0.21%2C-0.14l0.19%2C0.07l-0.03%2C1.11l-0.58%2C0.15l-0.23%2C0.29l0%2C0.34l0.26%2C0.44l0.37%2C0.27l0.45%2C0.3l0.78%2C0.44l0.29%2C0.37l1.56%2C0.69l0.32%2C-0.01l0.58%2C0.12l1.03%2C0.35l1.56%2C1.47l1.12%2C0.36l0.27%2C0.33l-0.15%2C1.1l0.19%2C0.32l0.67%2C0.5l0.51%2C0.08l0.03%2C0.44l-0.1%2C0.63l-0.22%2C-0.01l-0.28%2C-0.3l-0.9%2C-0.64l-0.43%2C-0.77l-0.03%2C-1.04l-1.26%2C-0.01l-2.38%2C-2.01l-1.46%2C-0.28l-0.52%2C0.08l-0.95%2C0.35l-0.87%2C0.29l-0.56%2C0.26l-0.05%2C0.4l1.02%2C0.98l0.36%2C0.74l0.33%2C0.13l1.48%2C-0.33l0.58%2C0.23l1.1%2C1.17l0.75%2C0.43l-0.03%2C0.3l-1.03%2C-0.39l-1.14%2C-1.01l-0.42%2C-0.03l-0.78%2C0.5l0.31%2C0.62l0.44%2C0.41l-0.02%2C0.16l-0.27%2C0.02l-1.04%2C-0.96l-0.95%2C-0.3l-0.83%2C-0.62l-0.62%2C-0.7l-0.54%2C-0.45l-1.05%2C-0.36l-0.25%2C0.22l-0.7%2C0.97l-0.33%2C1l0.42%2C0.21l1.3%2C-0.07l0.25%2C0.09l0.09%2C0.34l-0.37%2C0.28l-1.07%2C-0.27l-0.37%2C0.25l-0.63%2C0.1l-0.32%2C0.83l-0.79%2C0.81l-0.57%2C1.54l0.68%2C0.46l1.24%2C-0.12l0.69%2C-0.77l0.26%2C0.06l0.14%2C0.39l0.8%2C0.34l0.99%2C0.48l1.44%2C0.73l-0.03%2C0.42l-0.7%2C0.03l-1.1%2C-0.68l-0.81%2C-0.57l-0.72%2C-0.04l-0.5%2C0.28l-0.58%2C0.2l-0.34%2C0.54l-0.21%2C0.25l-0.04%2C0.6l-0.03%2C0.13l0.09%2C0.65l-0.08%2C0.95l0.61%2C0.84l1.16%2C0.73l1.08%2C0.2l0.49%2C-0.01l1.06%2C0.05l0.73%2C0.02l0.48%2C-0.15l0.36%2C0.12l0.4%2C0.42l0.82%2C0.8l0.62%2C-0.98l2.57%2C-2.11l1.52%2C-0.55l1.1%2C-0.19l0.92%2C-0.6l0.58%2C0.03l0.74%2C-0.02l0%2C0.52l-0.94%2C0.19l-1.87%2C0.43l-2.03%2C0.95l-0.46%2C0.67l-1.48%2C1.44l-1.08%2C1.8l-0.02%2C0.48l0.53%2C0.28l0.11%2C0.33l-0.86%2C0.28l-0.15%2C0.26l0.31%2C1.04l0.61%2C0.85l0.47%2C0.79l1.4%2C0.05l-0.05%2C0.27l-0.81%2C0.23l-0.16%2C0.21l0.28%2C0.38l0.16%2C0.5l-0.18%2C0.48l0.18%2C0.23l0.33%2C0.23l0.17%2C1.72l0.17%2C0.31l1.28%2C0.4l0.17%2C0.38l-0.43%2C0.51l-1.21%2C-0.64l-0.47%2C-0.52l-0.66%2C-1.06l0.19%2C-0.5l-0.1%2C-0.74l-0.13%2C-0.28l-0.35%2C-0.06l-0.49%2C-1.56l-0.33%2C-0.46l-0.26%2C-1.24l-0.64%2C-0.36l-0.37%2C-0.45l-0.02%2C-0.84l0.09%2C-1.08l-0.75%2C-1l-0.79%2C-0.31l-1.47%2C-0.34l-1.03%2C0.02l-0.49%2C-0.27l-0.15%2C0.17l-0.69%2C0.54l-0.5%2C0.41v0.7l-0.56%2C0.93l-1.07%2C0.6l-0.49%2C-0.33l0.85%2C-0.63l0.19%2C-0.58l-0.1%2C-0.4l-0.63%2C-0.35v-0.25l0.52%2C-0.32l0.46%2C0.09l1.08%2C-0.35l-0.23%2C-0.23l-0.6%2C-0.48l0.17%2C-0.49l-0.23%2C-0.41l-0.85%2C-0.08l-1.63%2C1.37l-0.77%2C-0.07l-0.64%2C0.88l-0.23%2C0.29l-0.57%2C0.37l-0.98%2C-0.29l0.19%2C-0.17l1.58%2C-1.1l1.24%2C-1.04l-1.12%2C-0.77l-0.06%2C-0.86l-0.17%2C-0.22l-0.35%2C0.16l-0.23%2C-0.14l-0.08%2C-0.58l0.23%2C-0.57l0.42%2C0.07l0.37%2C0.34l1.09%2C1.65l0.52%2C0.14l1%2C-0.35l0.08%2C-1.09l-0.67%2C-0.72l-0.27%2C-0.29l-0.46%2C-0.44l-0.79%2C-0.29l-2.41%2C0.92l-1.24%2C0.75l-0.35%2C0.33l-0.57%2C0.51l-0.32%2C0.17l-0.32%2C0.31l-0.35%2C0.34l-0.44%2C0.64l-1.04%2C0.52l-0.37%2C0.43l-0.52%2C0.35l-0.6%2C0.61l-0.06%2C0.37l-0.73%2C0.92l1.38%2C1.4l1.48%2C-0.04l0.55%2C-0.44l0.55%2C-0.09l2.86%2C0.88l1.32%2C-0.65h1.1l-0.07%2C0.37l-1.1%2C0.2l-0.71%2C0.2l-0.41%2C0.6l-0.03%2C0.4l-0.98%2C-0.16l-0.21%2C0.48l-0.79%2C0.95l-0.23%2C-0.67l0.31%2C-0.66l-0.16%2C-0.39l-0.67%2C-0.17l-0.54%2C-0.45l-0.41%2C0.53l-0.8%2C-0.01l-1.02%2C0.03l-0.69%2C-0.55l-0.72%2C0.29l-0.43%2C0.31l0.1%2C0.61l-0.13%2C0.5l-0.09%2C0.36l-0.41%2C0.2l-0.53%2C-0.16l-0.32%2C0.3l0.03%2C0.2l0.82%2C0.23l0.6%2C-0.29l0.14%2C0.6l-0.25%2C0.5l-0.81%2C0.41l-0.69%2C0.47l0.07%2C0.67l-0.61%2C0.38l-0.62%2C0.49l-0.66%2C0.49l-0.9%2C1.3l-0.58%2C0.42l-0.48%2C-0.18l-0.36%2C0.21l-0.25%2C1.33l-0.82%2C0.86l-0.72%2C0.35l0.21%2C0.3l0.02%2C0.36l1.27%2C-0.42l0.9%2C-0.53l1.22%2C-0.23l1.37%2C-0.22l1.45%2C0.03l1.01%2C-0.5l0.93%2C-0.54l0.95%2C-0.56l0.4%2C-0.48l0.05%2C0.51l-0.34%2C0.3l-0.1%2C0.66l-0.08%2C0.78l-0.1%2C0.31l0.4%2C0.14l-0.13%2C0.29l-0.52%2C0.18l-0.2%2C0.39l0.93%2C0.49l0.34%2C-0.31l1.03%2C-0.83l1.06%2C-0.28l0.55%2C-0.37l0.13%2C-0.77l-0.79%2C-0.17l0.04%2C-0.09l0.39%2C-0.23l0.17%2C-0.12h0.89l0.79%2C0.37l1.09%2C-0.23l0.27%2C0.26l0.74%2C-0.33l-0.78%2C-0.36l1.22%2C-1.18h1.66l1.35%2C-0.52l0.1%2C0.21l-0.61%2C1.83l0.33%2C0.04l0.51%2C-1.07l0.37%2C-0.32l0.11%2C-0.6l0.28%2C-0.24l0.52%2C-0.38l0.33%2C0.05l0.15%2C0.42l-0.14%2C1.04l-0.65%2C0.41l-1.49%2C1l-1.15%2C0.34l-0.66%2C-0.04l-1.02%2C0.5l0.04%2C0.25h1.35l0.46%2C0.07l0.59%2C0.5l0.67%2C0.5l1.16%2C-0.18l0.21%2C-0.21l-0.08%2C-0.35l0.25%2C-0.18l0.35%2C-0.01l0.59%2C0.43l1.2%2C-0.25l0.45%2C0.42l-0.01%2C0.36l-0.26%2C0.36l-0.42%2C0.26l-1.2%2C-0.01l-0.51%2C0.23l-0.08%2C0.21l0.09%2C0.14l1.08%2C0.31l0.79%2C-0.43l0.44%2C-0.55l0.73%2C-0.69l0.93%2C-0.27l1.32%2C0.84l0.36%2C-0.01l1.48%2C0.53l0.93%2C0.5l1.59%2C0.14l0.54%2C-0.6l0.28%2C-0.02l-0.4%2C0.83l0.16%2C0.27l0.61%2C0.31l0.18%2C0.53l-0.2%2C0.21l-0.62%2C-0.78l-0.44%2C0.01l-0.14%2C0.44l-0.74%2C0.03l-0.95%2C-1.08l-0.87%2C-0.22l-1.11%2C-0.24l-0.89%2C0.15l-0.46%2C0.08l-0.35%2C-0.37l-0.45%2C-0.38l-0.52%2C0.17l-0.91%2C0.82l0%2C0.19l0.36%2C0.23l0.65%2C0.17l0.54%2C0.08l0.34%2C0.36l0.16%2C0.47l0.48%2C0.3l0.35%2C0.52l-0.12%2C0.76l-0.02%2C0.6l-0.2%2C0.58l-0.45%2C0.45l0.17%2C1.58l0.35%2C0.88l0.04%2C0.29l-0.33%2C0.08l-1.39%2C-0.4l-0.01%2C-0.18l0.11%2C-0.78l0.03%2C-1.41l0.13%2C-0.76l0.38%2C-0.67l-0.33%2C-0.93l-0.4%2C-0.36l-1.96%2C-0.05l-0.76%2C-0.5l-0.34%2C-0.68l-0.7%2C-0.62l-0.31%2C-0.02l-0.98%2C0.39l-0.4%2C0.29l-0.41%2C-0.09l-0.25%2C-1.01l-0.6%2C-0.43l-0.52%2C-0.08l-0.76%2C0.03l-0.37%2C0.47l-0.39%2C0.87l-0.35%2C0.44l-0.79%2C0.58l-0.19%2C0.47l-0.5%2C0.57l-0.28%2C0.64l0.12%2C0.3l1.05%2C0.3l0.19%2C0.24l0.31%2C0.84l0.47%2C1.13l-0.9%2C0.12l-0.49%2C-0.97l-0.11%2C-1.1l-0.72%2C0.12l-0.42%2C-0.34l-0.18%2C-0.72l0.34%2C-0.8l1.11%2C-1.24l0.17%2C-1.15l1.06%2C-0.88l-0.68%2C-0.68l-0.27%2C0.3l-1.23%2C0.65l-0.44%2C0.28l-1.09%2C-0.2l-0.15%2C-0.17l-0.28%2C-0.41l-0.75%2C0.16l-0.94%2C0.53l-0.92%2C1.09l-0.88%2C-0.39l-1.06%2C-0.28l-2.31%2C1.38l0.52%2C0.14l0.67%2C-0.37l0.57%2C0.04l0.67%2C0.15l0.8%2C0.33l1.82%2C0.29l-0.94%2C0.29l-0.5%2C0.18l-0.66%2C0.14l-0.46%2C-0.3l-0.98%2C-0.5l-0.5%2C0.4l-0.26%2C0.24l-0.66%2C-0.01l-0.76%2C-0.08l-0.93%2C0.27l0.59%2C-0.72l0.01%2C-0.36l-0.36%2C0.05l-0.54%2C0.08l-0.72%2C0.41l-0.49%2C0.73l-1.13%2C0.16l-0.32%2C0.41l-0.18%2C0.51l0.06%2C0.37l0.25%2C0.35l-0.6%2C1.15l-0.04%2C0.38l-0.68%2C0.61l0.06%2C0.47l-0.14%2C0.24l-0.31%2C0.31l-0.4%2C-0.08l-0.06%2C0.18l0.39%2C0.29l0.66%2C-0.1l0.51%2C0.14l0.52%2C0.12l1.56%2C-0.75l0.61%2C0.53l0.3%2C0.35l1.81%2C0.25l1.01%2C0.2l0.5%2C0.13l0.58%2C0.79l-0.1%2C0.95l0.23%2C0.58l-0.24%2C0.14l-0.4%2C-0.11l-0.22%2C-0.22l-0.11%2C-0.58l-0.31%2C-0.56l-0.78%2C-0.65l-0.59%2C0.64l-0.32%2C-0.23l-0.98%2C-0.86l-0.79%2C-0.19l-0.65%2C-0.07l-1.21%2C0.22l-0.26%2C-0.02l-0.43%2C-0.33l-0.59%2C0.05l-0.78%2C0.08l-0.23%2C0.4l0.09%2C0.18l0.31%2C-0.14l0.22%2C0.09l0.13%2C0.35l0.33%2C1.5l-0.63%2C1.55l0.07%2C0.73l-0.62%2C0.39l-0.37%2C0.05l-0.46%2C-0.13l-1.12%2C-0.92l-0.34%2C-0.69l-0.05%2C-1.22l-0.37%2C-0.66l-0.54%2C-0.71l-0.62%2C-1.04l-0.19%2C0.21l-0.07%2C0.65l-0.4%2C0.49l-0.12%2C0.18l0.01%2C1.14l-0.01%2C0.38l0.14%2C0.48l0.47%2C1.09l0.33%2C0.9l-1%2C0.06l-0.51%2C0.32l-0.38%2C0.21l-0.1%2C0.53l-0.46%2C0.75l-0.16%2C0.42l-0.81%2C0.12l-0.07%2C-0.11l-0.21%2C-1.29l0.77%2C0.4l0.34%2C-0.16l0.27%2C-0.64l1.02%2C-1.41l-0.1%2C-0.47l-0.57%2C0.09l-1.36%2C0.23l-0.96%2C0.23l-0.17%2C0.37l-0.05%2C0.66l-0.82%2C-0.01l-0.31%2C-0.16l-1.78%2C0.37l-0.27%2C0.26l0.24%2C0.37l1.27%2C0.05l0.28%2C0.28l-0.03%2C0.25l-0.41%2C0.09l-0.9%2C0.6l-0.89%2C0.06l-2.06%2C-0.35l-0.4%2C0.08l-0.96%2C0.33l-0.04%2C-0.32l-0.23%2C-0.2l-0.74%2C-0.06l-0.47%2C0.26l0.17%2C1l0.48%2C0.11l0.22%2C-0.21l0.33%2C0.38l-0.2%2C0.54l0.08%2C0.53l-0.12%2C0.47l0.13%2C0.13l0.99%2C-0.34l1.12%2C-0.08l0.29%2C0.32l0.28%2C1.17l1.08%2C0.5l-0.02%2C0.4l0.11%2C0.51l-0.31%2C0.43l0.33%2C0.48l-0.78%2C0.64l0.78%2C-0.06l0.82%2C-0.71l0.23%2C0.57l-0.23%2C0.23l0.3%2C0.23l0.85%2C0.48l0.69%2C0.66l1.48%2C-0.05l1.2%2C-0.06l0.91%2C0.18l0.41%2C0.51l-0.35%2C0.18l-0.75%2C-0.22l-0.86%2C0.19l-2.11%2C0.04l-1.4%2C-0.53l-1.36%2C-0.54l-1.66%2C0.06l-1.1%2C0.4h-1.12l-0.69%2C0.04l-0.29%2C0.55l0.24%2C0.39l0.25%2C0.72l0.25%2C0.59l0.31%2C0.08l1.94%2C-0.4l1.9%2C0.62l1.26%2C0.15l0.02%2C0.21l-0.46%2C0.09l-0.93%2C-0.1l-0.49%2C-0.24l-2.04%2C-0.12l-0.93%2C0.31l-0.25%2C0.33l-0.52%2C0.23l-0.8%2C0.18l-0.09%2C0.13l0.25%2C0.12l0.55%2C0.06l1.02%2C-0.28l0.08%2C1.22l0.23%2C0.14l0.18%2C0.52l0.98%2C-0.24l0.8%2C0.1l0.43%2C-0.17l0.58%2C-0.35l0.68%2C-0.45l1.01%2C-0.17l2.61%2C-0.02l0.38%2C0.15l-0.2%2C0.27l-2%2C0.26l-1.53%2C0.06l-0.38%2C0.2l-0.18%2C0.44l0.12%2C0.5l-1.86%2C0.05l-1.09%2C0.3l-0.58%2C-0.12l-0.65%2C-0.31l-0.27%2C-0.43l0.14%2C-0.57l-0.09%2C-0.45l-0.27%2C0.02l-0.28%2C0.17l-0.91%2C0.09l-0.2%2C-0.56l-0.97%2C-0.08l-0.7%2C-0.17l-1.22%2C0.24l-1.21%2C-0.23l-1.32%2C0.53l-0.11%2C0.33l-0.12%2C0.26l0.22%2C0.1l0.26%2C-0.19l0.56%2C0.27l0.72%2C0.03l0.15%2C0.78l0.17%2C0.15l2.3%2C0.4l0.49%2C0.29l1.04%2C0.49l1.1%2C0.25l0.41%2C0.05l0.34%2C0.96l0.4%2C0.38l-0.41%2C0.23l-0.59%2C-0.19l-0.21%2C-0.32l-0.31%2C-0.42l-1.73%2C-0.17l-0.42%2C0.21l-0.64%2C0.25l0.03%2C-0.57l-0.22%2C-0.33l-0.84%2C0.12l-0.46%2C-0.31l-1.25%2C0.31l-0.58%2C-0.23l-0.12%2C-0.24l-0.53%2C0.29l-0.34%2C0.33l-0.39%2C0.31l0.17%2C0.22l0.49%2C0.21l0.19%2C0.16l0.12%2C0.57l0.3%2C0.34l0.2%2C-0.1l0.69%2C-0.04l0.49%2C-0.38l0.57%2C-0.06l0.94%2C0.14l1.04%2C0.53l0.36%2C0.61l-0.57%2C-0.02l-0.69%2C-0.62l-0.64%2C-0.09l-0.42%2C0.25l-0.75%2C0.09l-0.42%2C0.28l-0.23%2C0.06l-0.45%2C0.49l-0.19%2C0.3l-0.06%2C0.61l-0.2%2C1.12l-0.18%2C0.34l-0.37%2C0.2l0.46%2C0.76l0.64%2C0.16l1.06%2C0.31l0.36%2C-0.06l0.37%2C-0.42l0.75%2C-0.31l1.22%2C0.18l0.93%2C-0.17l0.32%2C-0.17l0.91%2C-1.52l0.56%2C-0.39l1.03%2C-0.59l1.5%2C-0.36l1.72%2C0.1l0.62%2C0.22l-0.09%2C0.23l-0.43%2C0.12l-1.58%2C-0.29l-1.82%2C0.64l-0.68%2C0.61l-0.8%2C0.26l-0.52%2C1.11l1.74%2C0.24l1.3%2C0.81l1.01%2C0.37l0.28%2C0.51l0.15%2C0.6l-0.11%2C0.06l-0.77%2C-0.27l-0.48%2C-0.62l-1.39%2C-0.75l-1.19%2C-0.21l-1.29%2C-0.02l-0.4%2C0.39l-1.92%2C-0.02l-0.16%2C0.13l-0.03%2C0.58l-0.72%2C0.12l-0.93%2C-0.1l-0.03%2C0.21l0.46%2C0.67l0.62%2C0.48l-0.72%2C1.18l-0.21%2C0.93l-0.03%2C0.2l0.66%2C0.11l1.02%2C-0.49l0.64%2C0.39l-0.51%2C0.33l-1.16%2C0.56l-0.47%2C-0.04l-1.11%2C-0.02l-0.24%2C-0.12l0.4%2C-0.4l0.11%2C-0.33l0.2%2C-0.46l0.11%2C-0.36l-0.43%2C-0.35l-0.19%2C-0.21l-0.12%2C-0.56l0.18%2C-0.45l-0.19%2C-0.56l-0.53%2C-0.5l-0.5%2C-0.07l-0.46%2C-0.43l-0.4%2C-0.46l-0.14%2C-0.4l-0.87%2C0.14l-1.25%2C0.68l-0.17%2C0.35l-0.77%2C-0.18l-0.26%2C0.13l-0.11%2C0.48l0.33%2C0.37l0.6%2C0.34l0.25%2C0.14l0.02%2C0.53l0.31%2C0.3l1.19%2C-0.02l0.22%2C1.18l1.17%2C0.25l0.36%2C0.29l-0.96%2C0.24l-0.9%2C-0.02l0.11%2C0.46l0.64%2C0.55l0.62%2C0.26l-0.2%2C0.59l0.42%2C1.32l-0.97%2C0.97l-0.63%2C0.5l-2.09%2C1.37l-0.19%2C0.42l0.06%2C0.39l0.2%2C0.66l0.53%2C0.31l1.01%2C0.41l0.37%2C0.05l0.57%2C-0.25l0.44%2C-0.16l0.46%2C-0.46l0.17%2C0.03l0.13%2C0.33l-0.39%2C0.61l-0.59%2C0.22l-0.2%2C0.26l0.48%2C0.28l0.6%2C0.02l1.7%2C-0.27l2.2%2C-0.84l0.73%2C-0.43l0.25%2C-0.46l0.38%2C0.1l0.43%2C-0.14l0.62%2C-0.71l0.64%2C0.4l-0.73%2C0.61l-0.02%2C0.18l0.43%2C0.5l1.3%2C-0.06l1.41%2C0.71l-0.05%2C0.19l-1.21%2C-0.22l-1.15%2C0.37l-2%2C-0.1l-1.5%2C0.45l-1.13%2C0.64l-0.8%2C0.07l-0.95%2C0.53l-1%2C0.79l-0.22%2C0.68l0.23%2C0.24l-0.79%2C0.5l-1.65%2C1.93l-0.19%2C-0.09l-0.35%2C0.15l-0.05%2C0.61l0.3%2C0.68l0.41%2C0.27l0.68%2C-0.2l0.91%2C-0.61l1.09%2C-0.28l0.94%2C-0.52l0.56%2C-0.72l0.52%2C-0.25l0.48%2C-0.68l0.82%2C-0.58l0.37%2C-0.51l0.96%2C0.05l0.56%2C0.68l0.68%2C-0.06l0.95%2C-0.36l2.34%2C-1.54l0.34%2C-0.61l-0.04%2C-0.46l0.83%2C-0.03l0.58%2C0.18l-0.99%2C0.94l-0.38%2C0.82l0.86%2C0.79l0.51%2C0.07l0.87%2C-0.35l0.55%2C-0.42l0.99%2C-0.1l1.23%2C-0.67l0.97%2C-0.27l0.88%2C-0.18l0.73%2C0.32l0.26%2C-0.4l0.08%2C-0.7l0.51%2C-0.69l0.61%2C-0.06l0.7%2C-0.41l0.72%2C0.21l0.91%2C-0.72l1.24%2C-0.68l0.06%2C-0.5l0.68%2C0.08l-0.03%2C0.15l-0.3%2C0.04l0.17%2C0.36l-0.03%2C0.5l-0.31%2C0.17l-0.07%2C0.61l-0.26%2C0.05l-0.77%2C0.76l-0.87%2C0.18l-0.38%2C0.77l-1.1%2C0.18l-0.26%2C0.39l0.04%2C0.48l-0.03%2C0.26l-0.56%2C0.67l-2.03%2C0.69l-0.34%2C0.42l-0.98%2C0.56l0.51%2C-1.1l-0.01%2C-0.41l-0.54%2C-0.23l-0.54%2C-0.21l-0.71%2C0.01l-0.78%2C0.31l-1.05%2C0.32h-0.49l-1.02%2C0.49l0.14%2C0.15l0.94%2C0.61l0.04%2C0.16l-0.7%2C0.83l-0.13%2C0.89l0.66%2C-0.2l0.53%2C-0.42l0.4%2C0.81l0.96%2C-0.39l0.81%2C-0.26l0.8%2C0.15l0.25%2C0.45l0.87%2C0.68l-0.06%2C0.41l-0.12%2C0.22l-1.15%2C-0.47l-0.64%2C-0.64l-1.18%2C0.7l-1.25%2C-0.11l-1.24%2C0.82l-0.15%2C0.48l-0.35%2C0.31l-0.33%2C1.48l-0.27%2C0.13l-0.21%2C-0.28l-0.04%2C-1.35l0.33%2C-0.9l0.59%2C-0.74l0.04%2C-0.36l0.47%2C-0.48l0.2%2C-1.31l-0.94%2C0.01l0.11%2C-0.38l0.31%2C-0.59l-0.1%2C-0.96l-1.36%2C-0.44l-0.39%2C0.65l-1.04%2C0.05l-1.83%2C0.69l-0.48%2C-0.52l-0.61%2C-0.11l-0.7%2C0.39l-1.51%2C1.33l-0.06%2C0.23l-0.1%2C0.37l-0.53%2C0.34l-0.73%2C0.27l-1.78%2C0.93l-0.58%2C0.23l-2.21%2C0.6l-0.85%2C0.24l-2.44%2C0.79l-0.02%2C0.37l-0.24%2C0.38l-1.41%2C0.71l-1.86%2C1.87l0%2C0.38l0.17%2C0.14l1.54%2C-0.1l-2.01%2C0.98l-0.09%2C0.58l0.01%2C0.15l3.5%2C-1.21l1.01%2C0.22l0.71%2C-0.03l1.14%2C-0.59l0.67%2C-0.34l1.01%2C-0.36l0.26%2C0.06l0.06%2C0.33l-1.82%2C1l0%2C0.53l-0.03%2C1.07l0.06%2C0.73l-0.18%2C0.57l-0.8%2C0.69l-0.21%2C0.55l0.15%2C0.27l0.88%2C0.08l1.09%2C1.23l0.73%2C0.16l0.83%2C-0.08l0.46%2C0.79l0.55%2C0.07l0.29%2C-0.42l0.5%2C-0.32l0.03%2C1.32l0.82%2C0.77l-0.33%2C1.06l0.69%2C1.33l0.16%2C0.96l-0.13%2C0.4l-0.45%2C-0.44l-0.53%2C-1.16l-0.36%2C-1.41l-0.73%2C0.41l-0.31%2C0l-0.54%2C-0.54l-0.2%2C-1.25l-0.79%2C-0.44l-0.77%2C-0.13l-0.68%2C0.08l-0.65%2C-0.77l-1.11%2C-1.41l-0.11%2C-0.43l-0.58%2C-0.07l-0.48%2C0.16l-1.98%2C1.66l-1.49%2C0.97l-0.64%2C1.39v0.96l-0.24%2C0.47l-0.07%2C1.31l-0.48%2C0.31l-0.18%2C0.38l-0.1%2C0.87l0.23%2C0.49l0.25%2C0.02l0.14%2C-0.44l0.66%2C-0.16l0.34%2C-0.03l0.58%2C0.48l0.74%2C0.68l0.06%2C0.2l-0.31%2C0.22l-0.16%2C0.48l-0.03%2C0.48l-0.42%2C0.01l-0.34%2C-1.78l-0.72%2C0.17l-0.88%2C0.36l0%2C0.71l-0.58%2C1.09l-0.43%2C0.46l-0.56%2C0.48l0.54%2C0.83l0.98%2C0.94l0.56%2C1.25l0.44%2C0.27l0.54%2C0.36l-0.03%2C0.51l0.73%2C1.52l1.19%2C0.4l0.66%2C0.38l0.23%2C0.3l-0.99%2C0.56l-0.76%2C-1.01l-0.39%2C-0.04l-1.32%2C-0.29l-0.67%2C-0.21l-0.1%2C-0.97l0.87%2C-0.82l-0.12%2C-0.45l-0.62%2C-0.04l-0.07%2C-0.14l-0.56%2C-0.66l-0.12%2C-0.75l-1.08%2C-0.62l-0.45%2C-0.49l-0.5%2C0.31l-0.41%2C0.79l-1.58%2C2.66l-1.09%2C2.06l-0.15%2C0.45l0.27%2C1.23l0.35%2C1.28l0.1%2C0.86l0.44%2C1.56l0.72%2C0.66l0.36%2C0.06l0.1%2C-0.46l1.27%2C-1.45l0.35%2C-1.2l0.37%2C-0.23l-0.12%2C0.68l-0.28%2C0.96l-1.53%2C1.94l0.23%2C0.32l0.61%2C0.33l0.28%2C-0.02l0.43%2C-0.31l0.71%2C-1.11l-0.08%2C-2.02l0.25%2C-0.88h0.15l0.1%2C1.17l0.28%2C1.75l0.24%2C0.59l-1.04%2C0.92l0.5%2C0.51l0.33%2C1.22l0.19%2C0.09l0.78%2C-0.24l0.28%2C-0.29l0.57%2C0.19l-1.3%2C0.62l-0.13%2C0.13l0.1%2C0.19l0.31%2C0.4l0.33%2C0.12l0.56%2C-0.29l0.61%2C0.03l2.07%2C-0.43l-0.12%2C0.34l-2.9%2C0.75l0.03%2C0.51l-0.1%2C0.5l0.43%2C1.78l-0.71%2C-0.47l-0.13%2C-0.61l-0.24%2C-0.71l-0.46%2C-0.63l-1.01%2C-0.55l-0.51%2C-0.29l-1.01%2C-0.28l-0.25%2C0.1l-0.15%2C1.08l0.58%2C1.07l0.85%2C0.9l-0.47%2C0.12l-0.56%2C-0.06l-0.82%2C-1.23l-0.3%2C-1.49l0.42%2C-1.6l-1.55%2C-2.19l-0.32%2C-0.09l-0.45%2C-0.56l-0.55%2C-0.35l-0.02%2C-0.77l0.01%2C-1.14l-0.11%2C-0.4l-0.66%2C-0.53l-0.99%2C1.18l-0.08%2C0.5l-0.01%2C0.69l-0.1%2C0.53l-0.06%2C0.99l-0.12%2C0.96l-0.88%2C1.91l-0.11%2C0.59l-0.17%2C0.56l0.91%2C-0.69l1.8%2C-0.63l0.63%2C-0.71l0.51%2C0.77l-0.16%2C0.35l-1.06%2C1l-0.63%2C0.15l-1.57%2C1.29l-0.98%2C1.51l0.3%2C0.34l0.19%2C0.56l-0.41%2C0.14l-0.45%2C0.08l0.06%2C0.4l-0.43%2C0.78l-0.19%2C0.52l0.21%2C0.64l-0.97%2C0.75L174%2C435.3l0.31%2C0.24l0.58%2C-0.02l0.3%2C-0.15l0.28%2C0.31l-0.75%2C1.54l-0.28%2C0.49l-0.08%2C0.65l-0.07%2C0.41l-0.61%2C0.85l-0.71%2C0.71l-0.57%2C-1.2l-0.41%2C-0.03l-0.66%2C0.64l-0.08%2C0.93l0.74%2C0.3l0.32%2C0.07l0.63%2C-0.14l0.74%2C-0.09l1.29%2C-0.82l0.63%2C-0.32l0.74%2C-0.36l1.43%2C-1.92l0.3%2C-0.1l0.13%2C-0.36l0.03%2C-0.62l-0.67%2C-0.48l-0.32%2C-0.97l1.14%2C-0.05l1.38%2C-0.23l0.52%2C-0.38l1.2%2C-1.4l0.12%2C-0.4l0.87%2C0.2l0%2C0.24l-0.29%2C0.22l-0.38%2C0.63l-0.47%2C0.75l0.76%2C0.41l-0.2%2C0.52l-1.19%2C-0.09l-0.54%2C0.36l-0.39%2C0.59l-0.49%2C1.49l-0.43%2C0.44l-0.15%2C0.2l-0.26%2C0.43l-0.62%2C0.46l-0.04%2C0.42l0.64%2C0.13l0.83%2C-1.64l0.56%2C-0.01l0.48%2C-0.49l0.79%2C-0.08l-0.5%2C0.65l0.74%2C0.2l-0.55%2C0.3l-0.48%2C0.36l-0.42%2C0.28l-0.15%2C0.29l0.4%2C0.47l0.79%2C-0.18l0.44%2C-0.39l0.44%2C-0.1l0.44%2C0.66l-0.49%2C0.69l0.75%2C0.07l0.22%2C0.15l0.05%2C0.33l0.38%2C0.16l-0.56%2C0.65l-1%2C-0.45l-0.81%2C0.53l-0.65%2C1.07l0.08%2C0.37l1.52%2C0.98l1.69%2C0.24l1.55%2C-1.24l0.51%2C-0.67l2.25%2C-1.51l1.03%2C-0.95l0.56%2C-0.66l0.28%2C-0.71l0.99%2C-1.34l0.53%2C-0.83l1.1%2C-1.41l0.88%2C-0.68l0.11%2C-0.36l0.55%2C-0.47l0.3%2C0.14l0.18%2C0.43l-0.1%2C0.42l-0.79%2C0.4l-0.28%2C0.69l-0.57%2C0.24l-1%2C1.15l-1.25%2C2.19l-0.35%2C0.51l-0.43%2C0.71l-0.43%2C0.43l-0.69%2C0.27l-1.04%2C1.16l-0.33%2C0.61l-0.37%2C0.25l-0.9%2C0.7l-0.24%2C0.52l0%2C0.04l-0.38%2C0.05l-0.61%2C-0.01l-0.5%2C0.3l-0.6%2C0.51l-0.93%2C0.23l-0.94%2C0.52l-0.39%2C0.23l0.23%2C0.27l0.29%2C0.09l0.4%2C0.24l0.88%2C-1.06l0.13%2C-0.07l0.25%2C0.2l-0.31%2C0.99l0.65%2C0.24l-0.04%2C0.5l-0.74%2C0.58l-0.21%2C-0.02l-0.4%2C-0.63l-0.35%2C-0.13l-1.02%2C-0.75l-0.28%2C0.1l-0.2%2C0.13l-0.83%2C0.21l-0.28%2C0.83l-0.49%2C0.07l-0.57%2C0.3l-0.14%2C0.25l-0.39%2C0.13l-1.75%2C0.32l0.79%2C1.9l-0.01%2C1l-0.13%2C0.24l-0.4%2C0.48l0.34%2C0.4l0.46%2C0.27l0.98%2C-0.1l0.41%2C0.62l2.64%2C-1.69l1.68%2C0.18l1.1%2C0.49l1.51%2C-0.28l0.02%2C0.9l0.75%2C1.42l1.78%2C-0.43l1.39%2C0.53l0.35%2C-0.11l0.27%2C-0.41l-0.23%2C-1.06l0.12%2C-0.2l0.26%2C-0.15l1.3%2C0.11l1.42%2C-0.11l0.59%2C-0.5l0.11%2C-0.96l-0.56%2C-1.05l0.01%2C-0.5l0.49%2C-0.47l0.77%2C0.27l0.41%2C-1.81l1.71%2C-0.53l0.78%2C-1.87l1.52%2C-0.25l2.62%2C0.65l3.1%2C0.27l2.63%2C-0.95l0.51%2C-0.06l1.68%2C0.41l4.04%2C-0.09l1.25%2C-0.38l1.74%2C-0.08l0.51%2C-0.31l1.15%2C-0.33l1.92%2C0.35l1.98%2C-0.85l0.64%2C0.42l0.8%2C-0.05l0.72%2C0.22l0.92%2C0.55l0.59%2C0.03l1.23%2C-7.04l2.94%2C-3.44l-0.18%2C-11.6l0.98%2C-10.04l1.93%2C-6.19l-0.94%2C-4.89l-0.22%2C-3.29l-1.33%2C-9.88l11.95%2C-1.17l10.3%2C-7.37l-2.47%2C-11.54l1.7%2C-2.27l3.93%2C-4.11l8.53%2C-16.14l1.04%2C-2.28l3.59%2C-4.11l4.41%2C-3.78l0.38%2C-9.35l-7.2%2C-13.75l1.55%2C-5l5.72%2C-0.88l2.01%2C-3.55l1.4%2C-3.27l4.16%2C-16.18l4.95%2C-4.3l5.22%2C-4.06l2.32%2C-4.21l6.01%2C3.32l3.22%2C2l4.97%2C3.89l5.82%2C-14.15l-1.16%2C-12.85L312.48%2C250.65zM196.68%2C374.77l0.8%2C-0.32l0.36%2C-0.71l-0.32%2C-0.92l-0.44%2C-0.52l-0.66%2C-0.28l-0.39%2C0.24l-0.72%2C1.06l-0.29%2C1.92l0.26%2C0.21L196.68%2C374.77zM177.25%2C448.86l1.51%2C-1l0.89%2C-0.99l0.04%2C-0.72l-0.46%2C-0.39l-0.95%2C0.08l-0.43%2C-0.07l0.28%2C-0.47l0.05%2C-0.62l0.89%2C-1.3l-0.24%2C-0.41l-0.5%2C0.17l-0.13%2C-1.46l-0.58%2C-0.39l-0.3%2C-0.47l-0.43%2C-0.25l-1.2%2C0.91l-0.8%2C0.36l-0.31%2C0.36l0.04%2C0.75l-0.01%2C1.01l-0.13%2C0.96l0.34%2C0.58l-0.02%2C0.17l-0.27%2C0.32l-0.35%2C-0.02l-0.24%2C-1.05l-0.65%2C1.45l0.34%2C1l-0.49%2C0.58l-0.46%2C-0.68l-0.48%2C-0.05l-1.11%2C0.79l1.38%2C0.36l1.11%2C0.14l0.38%2C-0.13l1.11%2C1.12l0.59%2C-0.17l0.35%2C0.01l0.55%2C-0.33L177.25%2C448.86zM180.22%2C391.94l-0.32%2C0.68l0.73%2C-0.21l0.59%2C-0.05l1.43%2C-0.61l0.17%2C0.1l-2.15%2C1.45l-0.18%2C0.49l-0.85%2C0.56l-0.4%2C0.28l-0.14%2C0.59l-0.12%2C0.5l0.26%2C0.31l1.5%2C-0.72l0.53%2C-0.02l1.62%2C-0.68l1.84%2C-1.17l0.54%2C-0.54l0.39%2C-0.96l0.8%2C-0.27l0.63%2C-0.23l0.18%2C-0.39l-0.21%2C-1.13l-0.39%2C-0.23l0.29%2C-0.51l-0.44%2C-0.28l-0.41%2C0.33l-0.65%2C0.63l-0.48%2C0.07l-0.1%2C-0.45l-0.19%2C0.01l0.55%2C-0.44l0.24%2C-0.03l1.05%2C-0.97l-0.3%2C-0.4l0.29%2C-1.48l-0.46%2C-0.82l0.06%2C-0.79l-0.32%2C-0.12l-0.24%2C-0.46l-0.89%2C0.47l0.06%2C0.19l0.17%2C0.05l0.1%2C0.05l-0.27%2C0.39l-0.04%2C0.34l-0.6%2C0.06l-1.19%2C0.26l-0.47%2C0.35l0.37%2C0.18l-0.24%2C0.79l-0.64%2C0.82l-0.04%2C0.26l1.5%2C-1.31h0.72l0.22%2C-0.09l-0.16%2C0.63l0.44%2C0.47l0.92%2C-0.32l-1.78%2C1.37l-0.51%2C0.88l-0.06%2C0.43l-0.28%2C0.37l-1.42%2C0.5l-0.95%2C0.39L180.22%2C391.94zM186.81%2C395.45l-0.96%2C0.34l-1.33%2C1.08l-1.37%2C1.56l-0.58%2C1.17l-0.23%2C0.71l0.23%2C0.14l0.02%2C0.58l-0.59%2C0.04l-0.18%2C-0.01l-0.22%2C0.1l-0.77%2C1.25l-0.02%2C0.51l0.11%2C0.59l0.17%2C0.16l0.25%2C-0.34l0.75%2C-0.44l1.81%2C-0.18l0.58%2C-0.01l0.62%2C-0.73l0.73%2C-0.84l2.77%2C-2.45l2.46%2C-0.9l0.43%2C0.07l0.21%2C-0.01l1.23%2C-1.1l0.43%2C-0.73l-0.07%2C-0.5l-0.6%2C0.25l-0.31%2C-0.04l0.79%2C-0.93l0.02%2C-0.23h-0.12l-1.65%2C0.79l-2.46%2C0.63l-0.44%2C0.27l-0.65%2C0.8l-0.92%2C0.62l-0.66%2C0.06l-0.09%2C-0.1l1.1%2C-1.57l1.07%2C-0.8L186.81%2C395.45zM184.45%2C402.99l-0.77%2C0.1l-0.52%2C0.51l-0.8%2C0.56l-0.23%2C0.21l-0.18%2C0.24l0%2C0.33l0.31%2C-0.05l0.23%2C0.12l0.59%2C-0.13l0.4%2C-0.44l0.46%2C-0.53l0.4%2C-0.68L184.45%2C402.99zM186.03%2C365.23l0.67%2C0.4l0.31%2C-0.17l0.28%2C-0.6l0.28%2C-0.18l0.21%2C-0.53l-0.11%2C-0.12l0.07%2C-1.02l-0.21%2C-0.03l-0.06%2C-0.24l-0.05%2C-0.27l-0.35%2C-0.27l-0.48%2C0.19l-0.6%2C1.47l0.26%2C0.31l0.11%2C0.26l-0.29%2C0.28L186.03%2C365.23zM196.95%2C382.57l2.26%2C-1.75l-2.04%2C-0.22l-1.31%2C0.56l-0.57%2C-0.04l-0.57%2C0.26l-0.47%2C0.6l-0.29%2C0.94l-0.56%2C0.56L193.2%2C384l1.25%2C0.02L196.95%2C382.57zM190.66%2C367.05l0.09%2C0.47l1.48%2C-0.75l0.22%2C-0.5l-0.08%2C-0.36l-0.23%2C-0.6l-0.32%2C-0.77l-0.58%2C0.5l-0.24%2C0.14l-0.49%2C0.15l-0.22%2C0.59l0.12%2C0.78L190.66%2C367.05zM193.68%2C370.69l-0.49%2C0.04l0.02%2C0.22l0.6%2C0.56l-0.42%2C0.56l-0.31%2C0.01l-0.3%2C2.22l0.41%2C0.38l0.53%2C-0.19l0.24%2C-0.56l-0.05%2C-1.43l0.48%2C-1.58l0.02%2C-0.56L193.68%2C370.69zM182.86%2C405.17l-0.27%2C0.27l-0.44%2C0.32l-0.1%2C0.23l-0.61%2C0.38l0.02%2C-1.14l-0.19%2C-0.12l-0.21%2C0.27l-0.05%2C0.75l-0.02%2C0.84l0.25%2C0.26l0.5%2C0.09l0.47%2C-0.36l0.57%2C-0.63l0.36%2C0.06l0.28%2C-0.62l0.07%2C-0.11l0.04%2C-0.44l0.18%2C-0.42L182.86%2C405.17zM190.48%2C388.08l0.03%2C-0.46l-0.55%2C0.17l-0.39%2C-0.55l-0.42%2C-0.33l0.33%2C-0.51l-0.47%2C-0.03l-0.35%2C0.23l-0.51%2C-0.24l-0.5%2C0.04l-0.16%2C0.49l0.16%2C0.26l0.33%2C0.72l-0.03%2C0.48l-0.04%2C0.47l0.42%2C0.08l0.71%2C-0.05l0.68%2C0.13l0.8%2C-0.52L190.48%2C388.08zM188.19%2C382.69l0.07%2C0.31l1.11%2C0.03l0.03%2C0.21l-0.26%2C0.4l0.02%2C0.43l0.19%2C0.11l0.56%2C0.68l0.36%2C-0.12l0.51%2C0.07l0.68%2C-0.64l0.22%2C-0.38l0.8%2C-0.87l0.01%2C-1.99l-0.41%2C-0.73l-0.38%2C0.01l-0.61%2C0.07l-0.45%2C-0.25l-0.34%2C0.21l-0.59%2C0.76l-1.21%2C0.84l0.15%2C0.33L188.19%2C382.69zM185.26%2C301.76h0.51l0.06%2C-0.51l-0.17%2C-0.32l0.22%2C-0.66l0.61%2C-0.22l0.56%2C0.54l-0.11%2C-0.72l0.22%2C-0.24l0.45%2C-0.03l0.17%2C0.25l-0.16%2C0.11l0.19%2C0.43l0.32%2C0.09l0.29%2C-0.03l0.32%2C0.21l-0.13%2C-0.51l0.13%2C-0.19l-0.36%2C-0.55l-0.23%2C-0.08l0.01%2C-0.39l0.23%2C-0.01l0.05%2C-0.51l0.38%2C-0.48l-0.61%2C-0.06l-0.43%2C0.18l-0.14%2C-0.21l-0.26%2C0.04l-0.1%2C0.48l-0.8%2C0.44l-0.06%2C0.41l-0.28%2C0.22l-0.14%2C0.5l-1.07%2C0.5L185.26%2C301.76zM177.52%2C400.18l0.88%2C-0.7l0.11%2C-0.26l0.06%2C-0.41l0.53%2C-0.33l0.41%2C-0.18l0.51%2C-0.24l0.1%2C-0.32l0.08%2C-0.25l-0.25%2C-0.37l0.21%2C-0.61l0.7%2C-0.28l0.18%2C-0.29l-0.48%2C0.07l-1.01%2C0.36l-0.4%2C0.17l-0.41%2C0.15l-0.08%2C0.4l-0.73%2C0.6l-0.86%2C1.43l0.67%2C-0.16l0.47%2C-0.06l-0.03%2C0.3l-1.17%2C0.64l-0.17%2C0.88L177.52%2C400.18zM182.98%2C408.3l-0.49%2C0.2l-1.13%2C0.89l0.05%2C0.34l-0.54%2C0.97l-0.08%2C0.56l0.61%2C-0.29l1.13%2C-0.73l0.72%2C-0.76l0.14%2C-1.7l-0.11%2C-0.07L182.98%2C408.3zM178.98%2C389.74l0.59%2C-0.79l0.08%2C-0.56l0.53%2C-0.83l0.03%2C-0.35l-0.09%2C-0.23l-0.56%2C0.28l-0.77%2C1.42l0.26%2C0.33L178.98%2C389.74zM174.62%2C415.45l0.23%2C-0.28l0.33%2C-0.49l-0.28%2C-0.54l-0.99%2C0.14l-0.19%2C0.34l-0.36%2C0.91l0.15%2C0.24L174.62%2C415.45zM174.94%2C418.35l-0.02%2C0.59l0.01%2C0.74l0.65%2C-0.5l0.28%2C-0.53l0.42%2C-1.71l-0.39%2C-0.26l-0.34%2C0.52L174.94%2C418.35zM175.68%2C425.29l0%2C-0.39l-0.29%2C0.01l-0.81%2C0.56l-0.86%2C1.1l0%2C0.25l0.1%2C0.44l0.37%2C0.08l0.1%2C-0.09l0.4%2C-0.56L175.68%2C425.29zM179.53%2C402.42l0.55%2C-0.58l0.16%2C-0.15l0.48%2C-0.89l-0.06%2C-0.13l-0.61%2C-0.17l-0.82%2C0.33l-0.17%2C0.23l-0.01%2C0.69l0.31%2C0.06l-0.89%2C1.56l-0.61%2C0.42l-0.01%2C0.66l-0.27%2C0.52l-0.13%2C1.17l0.26%2C-0.43l0.74%2C-1.53l0.4%2C-0.54L179.53%2C402.42zM181.2%2C413.21l-0.12%2C0.49l-0.24%2C0.47l-0.7%2C0.2l-0.31%2C0.26l-0.7%2C0.91l-0.09%2C0.62l0.17%2C0.38l0.49%2C0.12l0.55%2C-0.27l0.8%2C-1.8l0.35%2C-0.22l0.61%2C-1.26l0.33%2C-0.3l0%2C-0.55L181.2%2C413.21zM180.58%2C389.09l0.71%2C-0.35l0.12%2C-0.29l-0.11%2C-0.36l-0.31%2C0.02l-0.65%2C0.48l-0.37%2C0.99L180.58%2C389.09z%22%2F%3E%0A%09%09%3Cpath%20fill%3D%22white%22%20stroke%3D%22none%22%20id%3D%22NO-17%22%20title%3D%22Nord-Tr%C3%B8ndelag%22%20%20d%3D%22M153.1%2C455.19l1.01%2C-0.05l0.03%2C0.11l0.13%2C0.17l-0.44%2C0.28l-2.25%2C0.93l-0.44%2C0.88l-0.54%2C0.48l-0.62%2C0.18l-0.23%2C-0.14l0.01%2C-0.24l-0.07%2C-0.22l-0.55%2C0.09l0%2C0.63l-0.28%2C0.22l-1.14%2C0.75l-0.84%2C0.69l-0.63%2C0.37l-0.37%2C0.57l-0.76%2C-0.19l0.28%2C-0.55l0.27%2C-0.36l0.97%2C-0.83l0.58%2C-0.62l0.81%2C-1.01l0.42%2C-0.46l0.53%2C-0.05l0.23%2C-0.18l1.39%2C-0.96l0.55%2C-0.61l0.22%2C-0.56l0.43%2C-0.43l0.76%2C-0.07l0.22%2C0.53l-0.1%2C0.68L153.1%2C455.19zM156.55%2C468.81l-0.33%2C-0.13l-2.2%2C0.64l-0.38%2C0.2l-0.88%2C0.47l-0.18%2C0.44l0.25%2C0.58l-0.03%2C0.48l0.26%2C0.33l0.3%2C-0.16l0.61%2C0.19l0.45%2C0.08l0.71%2C-0.1l0.15%2C1.05l0.35%2C0.19l0.55%2C0.83l0.15%2C0l0.12%2C-0.23l0.13%2C-0.76l0.34%2C-1.05l0.34%2C-1.5l-0.01%2C-0.8l-0.17%2C-0.23l-0.56%2C0.02L156.55%2C468.81zM157.55%2C471.5l-0.17%2C-0.05l-0.17%2C0.15l0.11%2C1.01l0.45%2C1.29l-0.61%2C0.39l-0.31%2C0.72l0.04%2C0.63l0.36%2C0.25l0.12%2C0.19l0.45%2C0.02l0.41%2C0.41l0.84%2C0.3l0.07%2C-0.25l0.54%2C-0.15l0.37%2C-0.15l0.47%2C-0.46l0.1%2C-0.48l-0.35%2C-0.37l-0.25%2C-0.35l-1.04%2C-0.7l-0.97%2C-1.81L157.55%2C471.5zM156.06%2C480.01l1.87%2C-0.31l0.07%2C0.62l0.22%2C0.13l0.24%2C-0.08l0.21%2C-1.09l0.74%2C-1.43l-0.2%2C-0.52l-2.12%2C-1.03l-0.13%2C0.18l-0.42%2C0.45l-0.61%2C0.11l-0.6%2C-0.29l-0.12%2C-0.29l0.33%2C-1.84l-0.29%2C-0.58l-0.42%2C-0.38l0.09%2C-0.21l-0.45%2C-0.38l-0.53%2C-0.21l-0.51%2C0.03l-0.85%2C-0.54l-0.34%2C-0.46l-0.42%2C-0.69l-0.28%2C-0.29l-0.15%2C-0.03l-0.28%2C-0.11l-0.42%2C0.14l-0.26%2C0.29l-0.35%2C0.4l-0.34%2C0.2l-0.04%2C0.41l-0.14%2C0.35l0.13%2C1.04l1.74%2C0.85l2.08%2C-0.37l-0.37%2C0.61l-0.24%2C0.42l-0.54%2C0.25l-0.31%2C0.18l0.2%2C0.79l-0.13%2C0.33l0.94%2C1.7l0.41%2C0.35l0.77%2C-0.47l1.48%2C0l0.08%2C0.08l-0.3%2C0.3l0.04%2C0.39l0.37%2C0.55L156.06%2C480.01zM166.21%2C450.62l-0.23%2C0.28l0.17%2C0.6l0.26%2C0.04l2.05%2C-1.41l1.82%2C-1.71l-0.94%2C0.14l-0.07%2C-0.16l0.99%2C-0.79l-0.08%2C-0.68l-0.01%2C-0.05l1.61%2C-0.91l0.45%2C-0.12l0.4%2C-1.13v-1.16l-0.24%2C-0.36l-0.57%2C-0.19l-0.23%2C0.43l-1.09%2C0.69l-0.71%2C0.67l-0.39%2C0.77l-0.63%2C0.27l-0.36%2C0.74l-0.26%2C0.29l-0.43%2C0.62l-0.45%2C0.79l-1.08%2C1.69L166.21%2C450.62zM151.41%2C457.64l0.04%2C0.52l-0.3%2C0.29l-0.38%2C0.31l-0.2%2C0.34l-0.18%2C0.9l0.12%2C0.22l0.25%2C0.44l0.18%2C0.84l1.11%2C-0.05l0.28%2C-0.05l0.61%2C-0.42l0.45%2C-0.34l0.62%2C-0.59l0.42%2C-0.32l0.82%2C-1.31l0.68%2C-0.9l-0.05%2C-0.38l-0.97%2C0.28l-0.03%2C-0.55l-0.52%2C-0.82L151.41%2C457.64zM161.46%2C449.99l1.33%2C-0.06l1.16%2C-1.35l0.91%2C-0.59l1.08%2C-0.78l0.6%2C-0.39l0.47%2C-0.58l-0.09%2C-0.56l-0.23%2C0.15l-0.79%2C0.15l-1.27%2C-0.23l-0.3%2C-0.15l-0.47%2C0.14l-0.48%2C0.46l-1.18%2C0.08l-0.64%2C0.78l-0.48%2C0.52l0.17%2C0.48l-0.22%2C0.5l-0.22%2C0.71l0.41%2C0.03L161.46%2C449.99zM164.33%2C448.78l-0.5%2C1.27l0.96%2C-0.38l0.4%2C-0.47l0.19%2C-0.55l-0.48%2C-0.18L164.33%2C448.78zM153.72%2C461.1l-0.93%2C0.69l-0.24%2C0.4l0.28%2C0.18l0.22%2C0.01l0.31%2C-0.24l1.29%2C-1.15L153.72%2C461.1zM220.56%2C481.07l0.96%2C14.2l-4.34%2C9.71l-6.18%2C-2.01l-11.15%2C-2.47l-6.57%2C1.95l-5.61%2C4.41l-3.97%2C6.93l-4.09%2C6.49l-0.72%2C2.25l-1.51%2C1.94l-1.94%2C2.12l1.42%2C5.95l-2.95%2C6.29l-2.5%2C4.4l1.78%2C4.3l-7.88%2C0.35l-1.89%2C-0.05l-3.95%2C-7.41l-3.07%2C-0.82l-2.72%2C-0.33l-0.44%2C-0.01l-0.78%2C0.34l-1.69%2C-0.14l-1.77%2C0.35l-0.75%2C0.33l-0.3%2C-0.06l-0.84%2C-0.71l-0.5%2C-0.46l-0.29%2C-0.21l-0.7%2C-0.01l0.28%2C-1.35l-0.28%2C-1.71l0.25%2C-0.76l-0.15%2C-0.35l0.18%2C-0.26l0.78%2C-0.36l0.3%2C-0.82l-0.43%2C-0.6l-0.17%2C-0.05l-0.69%2C0.2l-0.17%2C0.24l-0.32%2C0.07l-0.45%2C-0.09l-0.85%2C-0.71l-0.54%2C-1.12l0.07%2C-0.67l0.45%2C-0.84l0.24%2C-0.19l1.45%2C-0.12l1.14%2C-0.16l1.01%2C-0.95l-1.09%2C0.19l-0.55%2C-0.01l-0.22%2C-0.17l-0.19%2C-0.5l0.44%2C-0.4l0.14%2C-0.13l0.84%2C0.04l0.16%2C-0.19l-0.04%2C-0.68l0.32%2C-0.63l-0.42%2C-0.18l-1.93%2C1.42l-0.76%2C0.43l-1.04%2C0.61l-1.87%2C1.35l-0.44%2C0.19l-0.52%2C-0.46l0.94%2C-0.59l0.21%2C-0.76l-0.14%2C-0.41l0.72%2C-1.3l0.37%2C-0.65l0.7%2C-0.29l0.63%2C-0.55l0.66%2C0.18l0.83%2C-0.36l0.36%2C-0.77l0.52%2C-0.83l1.68%2C-1.63l1%2C-0.02l0.11%2C-0.42l0.4%2C-0.27l0.54%2C0.2l-0.07%2C0.67l0.14%2C0.09l0.89%2C-0.27l0.66%2C-0.35l0.89%2C-0.22l0.83%2C-0.01l0.48%2C-0.52l-0.16%2C-0.69l0.07%2C-0.9l0.14%2C-0.16l1.05%2C-0.31l0.34%2C-0.06l0.28%2C0.11l0.04%2C0.44l0.49%2C-0.11l0.47%2C-0.67l1.35%2C-0.59l0.33%2C0.16l0.34%2C0.48l0.18%2C-0.02l0.34%2C-0.52l0.36%2C-1.13l-0.06%2C-0.24l-0.34%2C-0.45l-0.44%2C-0.01l-0.45%2C-0.29l0.12%2C-0.25l0.78%2C-0.02l0%2C-0.38l-0.59%2C-0.29l-0.26%2C-0.59l-0.55%2C0.67l-1.47%2C-0.29l-0.22%2C-0.47l-0.15%2C-0.55l1.01%2C0.01l0.83%2C-1.11l-0.08%2C-0.27l-0.53%2C-0.38l0.27%2C-0.96l0.06%2C-0.43l0.27%2C-0.75l-0.24%2C-0.46l-0.28%2C0.03l-0.22%2C0.24l-0.54%2C1.12l0.18%2C1.21l-0.91%2C0.99l-0.46%2C0.5l-0.44%2C0.19l-0.19%2C-0.38l-0.28%2C-0.03l-0.49%2C0.66l-0.74%2C0.64l-0.88%2C0.36l-1.1%2C-0.08l-0.44%2C-0.91l-0.07%2C-0.65l0.16%2C-0.92l0.87%2C-0.52l0.38%2C-0.56l0.92%2C-0.02l0.36%2C-0.41l0.54%2C-0.88l1.17%2C-1.34l0.35%2C-0.57l0.42%2C-0.13l0.42%2C0.2l0.39%2C-0.02l0.81%2C-0.38l1.36%2C-0.32l1.08%2C-1.07l-0.16%2C-0.54l-0.45%2C-0.51l-0.35%2C-0.41l-0.66%2C0.17l-0.44%2C0.31l-0.32%2C-0.05l-0.08%2C-0.67l-0.51%2C-0.18l-1.13%2C0.04l-1.3%2C0.32l-0.38%2C0.32l-0.25%2C0.75l-0.94%2C0.93l-1.41%2C0.5l-1.74%2C1.24l-0.3%2C0.32l-0.6%2C0.61l-1.06%2C1.19l-0.39%2C0.68l-1.5%2C1.15l-4.1%2C2.1l-0.96%2C1.1l-1.18%2C0.83l0.23%2C0.27l1.5%2C-0.84l0.23%2C-0.38l0.24%2C-0.29l0.29%2C-0.31l1.73%2C-0.61l0.97%2C-0.35l0.71%2C-0.52l1.68%2C-1.51l1.02%2C-0.64l0.29%2C0.72l1.63%2C0.61l0%2C0.36l0.01%2C0.66l0.51%2C0.98l-0.63%2C0.74l-0.61%2C0.3l-0.33%2C0.44l0.26%2C0.57l-1.5%2C3.11l-0.39%2C0.32l-1.47%2C0.53l-0.85%2C0.56l-0.87%2C0.34l-0.65%2C0.06l-1.48%2C0.83l-0.71%2C0.7l-1.02%2C0.37l-0.35%2C0.39l0.02%2C0.63l-0.93%2C1.14l-0.83%2C0.29l-1.11%2C1.05l-0.61%2C0.42l-0.33%2C0.22l-0.55%2C0.44l-1.18%2C0.37l-0.48%2C0.14l-0.21%2C0.36l-0.7%2C0.45l-1.62%2C-0.01l-0.5%2C0.24l-0.21%2C0.67l-0.88%2C0.66l-0.28%2C-1.17l-0.23%2C-1.03l-0.24%2C-0.82l0.81%2C-0.84l0.62%2C-1.41l0.28%2C-1.31l3.02%2C-2.05l1.07%2C-0.9l1.16%2C-1.37l0.42%2C-2.04l1.47%2C-3.44l2.06%2C-3.58l1.58%2C-0.9l0.91%2C-0.72l0.85%2C-1.75l0.42%2C-0.51l0.19%2C-0.81l-0.14%2C-0.51l-0.39%2C-0.52l0%2C-0.38l1.39%2C-1.9l0.07%2C-1.29l0.34%2C-0.3l0.86%2C-0.32l0.1%2C-0.25l-0.44%2C-0.54l-1.77%2C-0.2l-1%2C-3l3.46%2C-1.8l0.4%2C-0.8l0.42%2C-2.81l-2.46%2C-0.81l-1.58%2C-1.28l-1.05%2C-1.21l-0.07%2C-0.97l-0.19%2C-0.34l-1.73%2C-1.19l-2.44%2C-2.23l0.18%2C-0.39l0.21%2C-0.13l0.7%2C0.86l0.56%2C0.36l0.7%2C0.53l0.4%2C-0.4l-0.15%2C-0.19l-0.59%2C-0.36l-0.51%2C-0.31l-0.46%2C-0.22l0.21%2C-0.4l0.59%2C-0.3l0.2%2C-0.42l0.33%2C-0.11l0.12%2C0.38l1.76%2C1.86l1.23%2C0.13l0.19%2C0.42l-0.15%2C0.97l0.16%2C0.44l0.21%2C0.09l0.88%2C0.41l0.71%2C0.06l0.09%2C-0.23l-0.46%2C-0.93l-0.47%2C-0.17l-0.4%2C-0.57l0.33%2C-0.35l0.27%2C-0.12l0.24%2C-0.11l-0.29%2C-1.11l-0.5%2C0.14l-1%2C0.18l-0.54%2C0.28l-0.38%2C-0.02l-0.2%2C-0.59l-0.82%2C-0.42l-0.1%2C-0.5l0.28%2C-0.24l0.49%2C-0.06l0.2%2C-1.03l0.72%2C0.41l0.23%2C0.39l0.18%2C0.39l0.41%2C-0.37l-0.04%2C-0.86l0.23%2C-0.16l1.11%2C0.54l0.39%2C0.01l0.02%2C-0.45l-0.92%2C-0.82l-0.15%2C-0.85l1.45%2C0.49l0.78%2C-0.22l0.39%2C-0.43l0.23%2C-0.11l0.39%2C0.21l0.38%2C-0.47l0.46%2C-0.62l0.14%2C-0.3l-0.31%2C-0.45l-0.47%2C-0.57l-0.51%2C-0.61l-0.29%2C-0.38l0.17%2C-0.49l0.95%2C-1l0.54%2C-0.06l0.48%2C0.57l0.49%2C0.4l0.72%2C0.58l0.73%2C0.32l0.09%2C0.14l-0.01%2C0.17l-0.37%2C0.2l-0.09%2C0.42l0.04%2C0.78l0.03%2C1.25l0.45%2C-0.24l0.15%2C-0.38l0.37%2C0.28l0.04%2C0.3l0.65%2C0.85l0.44%2C0.22l0.53%2C0.64l0.14%2C0.68l-0.02%2C0.32l-0.25%2C0.72l-0.5%2C0.5l0.63%2C0.07l0.12%2C-0.23l0.57%2C-0.42l0.34%2C-0.13l0.33%2C0.29l1.23%2C-0.77l0.09%2C0.31l-0.15%2C0.94l0.29%2C-0.06l0.39%2C0.01l0.29%2C0.21l-0.07%2C0.82l-0.49%2C1.6l-0.83%2C0.85l-0.46%2C0.91l-0.86%2C1.56l-0.13%2C0.62l0.05%2C0.39l0.39%2C-0.29l0.29%2C-0.6l0.28%2C-0.74l1.62%2C-1.81l0.15%2C-0.45l0.43%2C-0.64l0.47%2C-0.25l0.12%2C-0.02l0.1%2C-0.22l-0.46%2C-0.85l0.36%2C-0.78l0.54%2C-0.65l0.64%2C0.33l0.92%2C0.06l0.9%2C-0.49l0.54%2C-0.27l0.32%2C-0.29l-0.37%2C-0.49l-0.58%2C0.11l-0.6%2C-0.08l-0.54%2C0.99l-0.5%2C-0.43l0.17%2C-0.64l-0.01%2C-0.91l0.45%2C-1.68l1.08%2C0.16l0.57%2C-0.23l-0.01%2C-0.41l-0.65%2C-0.01l-0.27%2C-0.04l0.3%2C-0.44l-0.44%2C-0.43l0.65%2C-0.23l0.13%2C-0.62l0.73%2C-0.03l0.48%2C0.17l0.08%2C0.3l2.94%2C-1.51l0.56%2C-0.22l0.07%2C-0.25l-1.01%2C-0.19l-0.76%2C0.54h-0.44l-0.57%2C0.67l-0.13%2C-0.48l0.28%2C-0.34l0.22%2C-1.53l-0.69%2C-0.33l-0.49%2C0.61l0.51%2C1.28l-1.09%2C0.93l-0.46%2C0.09l-0.33%2C-0.29l-1.78%2C-1.75l-0.14%2C-0.26l-0.24%2C-0.43l-0.12%2C-0.43l-0.46%2C-1.1l-0.33%2C-0.44l-0.1%2C-0.35l-0.07%2C-0.52l0.24%2C-0.79l0.14%2C-0.13l0.4%2C0.34l0.56%2C-0.67l-0.21%2C-0.42l-0.44%2C-0.1l0%2C-0.53l0.49%2C0.2l2.1%2C-1.1l0.25%2C-0.95l0.05%2C-0.3l0.81%2C-0.69l0.17%2C-0.21l0.74%2C-0.16l1.15%2C0.08l0.38%2C0.14l0.59%2C-0.57l0.29%2C-0.38l0.51%2C0.23l0.44%2C0.4h0.95l0.48%2C-0.42l1.18%2C-0.73l-0.15%2C-0.24l-0.77%2C-0.03l-1.56%2C0.4l-0.39%2C0.01l-0.12%2C-0.4l-0.72%2C-0.22l-0.62%2C-0.19l-0.53%2C-0.39l-0.72%2C-0.01l0.03%2C-0.15l1.44%2C-0.45l2.07%2C-0.39l0.22%2C-0.03l0.28%2C-0.28l-0.96%2C-0.16l-1.36%2C0.31l-1.07%2C0.05l0.43%2C-1.32l0.52%2C-0.34l3.91%2C-2.37l2.24%2C-1.3l1.29%2C0.32l0.17%2C-0.02l0.31%2C-0.35l1.37%2C-1.05l2.02%2C0.79l0.2%2C0.33l0.25%2C0.19l0.26%2C-0.1l0.64%2C-0.08l0.99%2C0.08l1.05%2C0.35l1.01%2C0.48l1.62%2C1.71l0.24%2C-0.13l-1.53%2C-1.88l-1.67%2C-0.68l-0.5%2C-0.46l-0.99%2C-0.17l-0.59%2C0.07l-1.01%2C-0.6l-0.62%2C-0.45l-0.91%2C-0.23l-1.25%2C0.28l-0.3%2C0.04l-0.52%2C0.21l-0.35%2C0.82l-0.95%2C-0.14l-0.44%2C-0.05l-3.27%2C2.2l-2%2C1.36l-1.43%2C0.45l-1%2C0.35l0.14%2C0.35l0.5%2C0.04l-0.3%2C1.41l-0.48%2C0.38l-0.96%2C0.29l-1.49%2C0.85l-0.56%2C0.21l-0.29%2C0.18l-0.13%2C0.4l0.01%2C0.29l-1.04%2C1.15l-0.58%2C0.68l-1.61%2C0.48l-1.68%2C0.84l-0.65%2C0.05l-0.19%2C-0.24l-0.31%2C-0.19l0.11%2C-0.29l0.21%2C-0.23l0.08%2C-0.2l0.83%2C-0.3l0.39%2C-0.01l0.79%2C-0.3l1.07%2C-0.27l0.26%2C-0.81l0.59%2C-0.71l1.37%2C-0.99l-0.22%2C-0.16l-1.55%2C0.57l-1.61%2C-0.5l-0.4%2C0.42l-0.87%2C-0.1l-0.07%2C-0.4l0.15%2C-0.61l0.54%2C-0.74l0.27%2C-0.51l0.96%2C-0.15l1.87%2C-0.74l0.51%2C-0.03l1.82%2C-0.12l0.6%2C-0.13l0.75%2C-0.15l0.97%2C-0.58l0.88%2C-0.21l0.37%2C-0.12l0.49%2C-0.57l1.06%2C-0.4l-0.91%2C-0.1l-1.43%2C0.9l-0.94%2C0.31l-1.75%2C0.53l-1.97%2C0.23l-3.08%2C1.06l-0.24%2C-0.24l-0.04%2C-0.51l0.25%2C-0.43l0.79%2C-0.76l0.65%2C-0.33l0.05%2C-0.33l0.92%2C-0.83l1.62%2C-1.11l1%2C-0.78l1.31%2C-0.33l0.51%2C-0.19l0.54%2C-0.3l0.88%2C-0.2l0.56%2C0.39l0.14%2C0.37l0.58%2C0.05l0.45%2C0.07l0.17%2C-0.82l0.59%2C-0.17l0.2%2C-0.29l-0.22%2C-0.35l-0.77%2C-0.09l-0.08%2C0.53l-0.17%2C0.08l-0.26%2C-0.4l-0.37%2C-0.15l-1.46%2C0.35l-0.6%2C-0.03l-0.03%2C-0.17l0.38%2C-0.32l0.12%2C-0.59l0.99%2C-0.56l0.3%2C-0.03l0.27%2C0.14l0.44%2C-0.52l0.32%2C0.09l0.31%2C0.48l0.3%2C0.22l0.42%2C-0.14l0.39%2C0.34l0.37%2C0.01l0.2%2C-0.67l0.68%2C-0.59l2.33%2C-1.88l0.37%2C-0.13l1.39%2C-0.13l0.78%2C0.3l-0.11%2C0.46l-0.23%2C0.48l0.05%2C0.49l1.29%2C1.5l0.56%2C-0.04l0.2%2C-0.95l0.72%2C-0.23l0.16%2C0.85l0.46%2C1.04l0.12%2C0.49l0.81%2C0.66l0.98%2C-0.1l0.41%2C0.62l2.64%2C-1.69l1.68%2C0.18l1.1%2C0.49l1.51%2C-0.28l0.02%2C0.9l0.75%2C1.42l1.78%2C-0.43l1.39%2C0.53l0.35%2C-0.11l0.27%2C-0.41l-0.23%2C-1.06l0.12%2C-0.2l0.26%2C-0.15l1.3%2C0.11l1.42%2C-0.11l0.59%2C-0.5l0.11%2C-0.96l-0.56%2C-1.05l0.01%2C-0.5l0.49%2C-0.47l0.77%2C0.27l0.41%2C-1.81l1.71%2C-0.53l0.78%2C-1.87l1.52%2C-0.25l2.62%2C0.65l3.1%2C0.27l2.63%2C-0.95l0.51%2C-0.06l1.68%2C0.41l4.04%2C-0.09l1.25%2C-0.38l1.74%2C-0.08l0.51%2C-0.31l1.15%2C-0.33l1.92%2C0.35l1.98%2C-0.85l0.64%2C0.42l0.8%2C-0.05l0.72%2C0.22l0.92%2C0.55l0.59%2C0.03l-6.88%2C12.02l-7.14%2C13.43L210%2C474.8l5.33%2C3.82l4.57%2C1.63L220.56%2C481.07zM148.04%2C533.97zM153.53%2C515.04l-0.92%2C0.58l-1.75%2C0.55l-0.61%2C-0.3l-0.35%2C0.54l-0.18%2C1.05l-0.7%2C1l0.06%2C0.3l0.34%2C0.13l0.46%2C-0.1l0.41%2C-0.79l0.63%2C-0.18l0.48%2C-0.77l0.69%2C-0.4l0.27%2C-0.65l0.61%2C0.17l0.54%2C0.16l0.19%2C-0.1l0.68%2C-0.67l-0.17%2C-0.46L153.53%2C515.04zM143.85%2C458.45l0.3%2C-0.48l0.52%2C0.24l-0.43%2C0.33l-0.91%2C1.22l-0.08%2C0.41h0.72l1.12%2C-0.38l1.7%2C-1.45l0.32%2C-0.98l0.36%2C-0.21l0.87%2C-0.5l1.72%2C-0.94l0.72%2C-1.44l1.38%2C-0.51l0.63%2C-0.5l-0.26%2C-0.08l-0.84%2C-0.08l-1.42%2C0.41l-0.8%2C0.34l-0.55%2C0.29l-0.88%2C0.43l-0.85%2C0.68l-0.62%2C0.41l-0.68%2C0.38l-0.46%2C-0.17l-0.33%2C0.04l-0.31%2C0.01l-0.32%2C0.21l-0.22%2C0.29l-0.41%2C0.27l-0.51%2C0.32l-0.04%2C0.72l-0.14%2C0.6l-0.18%2C0.82L143.85%2C458.45z%22%2F%3E%0A%09%09%3Cpath%20fill%3D%22white%22%20stroke%3D%22none%22%20id%3D%22NO-01%22%20title%3D%22%C3%98stfold%22%20%20d%3D%22M148.25%2C744.56l-0.48%2C0.37l-0.17%2C-0.41l-0.19%2C-0.3l-0.33%2C-0.39l0.71%2C-1.15l0.2%2C-0.17L148.25%2C744.56zM144.99%2C738.86zM146.1%2C742.97l0.82%2C-1.06l0.17%2C-1.04l-0.38%2C0.16l-0.49%2C0.29l-0.13%2C-0.44l-0.12%2C0.03l-0.63%2C0.59l-0.31%2C0.29l0.23%2C0.5l0.12%2C0.51l0.17%2C0.24l0.19%2C0.16L146.1%2C742.97zM170.56%2C713.65l-0.09%2C-1.45l-0.15%2C-1.44l0%2C0l-0.32%2C0.04l-0.82%2C0.35l-0.93%2C-0.2l-0.96%2C0.14l-0.6%2C0.42l-0.94%2C0.55l-0.41%2C0.22l-0.31%2C0.96l0.1%2C0.85l-0.61%2C0.76l-0.47%2C0.98l-0.11%2C0.14l-0.46%2C0.38l-1.15%2C0.96l-1.2%2C0.32l-0.05%2C1.11l-0.19%2C0.51l-0.59%2C0.4l-0.33%2C-0.36l-0.04%2C-0.8l0.24%2C-1.12l-0.29%2C-0.91l-0.44%2C-0.28l-0.99%2C-0.2l-0.87%2C-0.97l-0.01%2C-1.38l-0.25%2C-0.55l-0.9%2C-0.82l-0.84%2C-0.17l-0.63%2C-0.43l-0.41%2C0.75l-0.28%2C1.27l0.05%2C1.96l-1.44%2C-0.02l-1.39%2C-0.45l-0.2%2C-0.2l-0.63%2C-0.07l-2.01%2C-0.25l-0.37%2C0.1l-0.25%2C1.23l0.53%2C0.89l-0.36%2C0.4l-0.75%2C0.68l-0.17%2C0.13l-0.43%2C0.31l-0.51%2C0.12l-0.31%2C0.62l-0.07%2C0.6l-0.39%2C1.01l-0.17%2C0.17l-0.58%2C0.14l-0.31%2C-0.14l-0.62%2C0.48l0.21%2C0.67l-0.27%2C1.32l-0.07%2C0.75l-0.49%2C0.51l-0.5%2C0.52l-1.08%2C-1.5l0%2C0l0.08%2C1.24l-0.08%2C0.19l-0.29%2C1.1l-0.41%2C0.74l0.15%2C0.51l-0.19%2C2.11l0.07%2C0.18l0.08%2C0.64l0.07%2C0.97l0.31%2C0.66l0.11%2C0.22l0.22%2C0.54l1.08%2C-1.84l0.41%2C0.08l-0.16%2C0.36l0.17%2C0.84l0.17%2C0.14l0.44%2C-0.35l0.49%2C-0.13l-1.33%2C1.54l-0.36%2C1.51l0.16%2C1.08l0.27%2C-0.02l0.29%2C-0.17l0.12%2C0.05l0.98%2C1.21l-0.36%2C0.28l0.03%2C0.6l0.54%2C0.25l0.14%2C0.45l0.45%2C0.39l0.43%2C-0.33l0.25%2C-0.4h0.67l0.21%2C0.49l-0.23%2C0.56l0.06%2C0.32l0.56%2C0.57l0.27%2C-0.13l0.27%2C-0.72l0.08%2C-0.77l0.37%2C-0.3l0.06%2C-0.37l0.45%2C-0.12l0.26%2C0.66l0.32%2C0.48l0.23%2C0.67l0.15%2C0.95l0.83%2C-0.57l0.03%2C0.81l0.32%2C-0.04l0.53%2C-0.42l-0.02%2C-1.18l-0.93%2C-1.96l-0.14%2C-0.52l0.11%2C-0.13l0.3%2C0.34l0.51%2C1.18l0.27%2C0.51l0.21%2C1.23l0.25%2C-0.1l0.63%2C-0.45l-0.07%2C-1.03l0.06%2C-0.28h0.49l0.17%2C0.3l-0.27%2C1.12l0.95%2C0.34l-0.23%2C0.13l-0.66%2C0.01l-0.08%2C0.21l-0.05%2C0.25l0.08%2C0.32l0.18%2C0.4l0.27%2C0.11l0.15%2C0.1l0.07%2C0.27l-0.08%2C0.71l0.25%2C0.08l1.73%2C-0.54l0.78%2C-0.72l1.47%2C-0.02l-0.22%2C0.84l0.72%2C1.9l0.28%2C0.72l0.29%2C0.18l0.23%2C0.47l0.25%2C1.87l0.19%2C0.59l0.04%2C1.68l-0.18%2C1.98l1.42%2C0.46l0.49%2C0.09l-0.12%2C-0.34l0.48%2C-0.59l0.4%2C0.48l0.43%2C-0.13l1.41%2C-0.69l0.15%2C-1.1l0.71%2C-1.12l-0.1%2C-1.45l0.63%2C-2.02l1.46%2C-2.36l0.13%2C-0.55l-0.39%2C-0.74l0.32%2C-0.92l-0.08%2C-1.54l0.17%2C-1.63l0.42%2C-0.84l0.64%2C-0.68l-0.3%2C-4.61l-0.83%2C-1.93l-0.14%2C-1.24l-0.3%2C-0.66l-0.17%2C-2.19l-0.59%2C-1.54l-0.84%2C-3.5l0.14%2C-0.88l0.59%2C-0.82l1.28%2C-0.75l1.76%2C-0.26l0.77%2C-2.01l1.2%2C-0.11L170.56%2C713.65zM150.4%2C744.61l-0.02%2C-0.36l0.44%2C-0.55l0.24%2C-0.47l-0.02%2C-0.58l-0.37%2C-0.07l-0.12%2C0.2l-0.26%2C0.1l-0.25%2C0.06l-0.16%2C-0.33l0.14%2C-0.21l-0.26%2C-0.2l-1.01%2C0.46l0.38%2C1.08l-0.29%2C0.29l-0.05%2C1l0.54%2C0.39l0.27%2C0.14l0.75%2C-0.52L150.4%2C744.61z%22%2F%3E%0A%09%09%3Cpath%20fill%3D%22white%22%20stroke%3D%22none%22%20id%3D%22NO-05%22%20title%3D%22Oppland%22%20%20d%3D%22M65.16%2C606.09L65.37%2C605.72L65.26%2C604.72L66.34%2C603.66L66.78%2C601.98L68.39%2C602.07L68.91%2C601.79L69.95%2C603.14L70.59%2C603.25L70.77%2C602.89L71.7%2C602.48L71.38%2C601.67L70.55%2C600.37L72.24%2C599.62L74%2C597.46L76.14%2C597.2L77.02%2C598.16L79.77%2C597.75L82.17%2C594.08L83.16%2C592.13L84.02%2C591.46L84.78%2C590.25L86.18%2C589.39L88.53%2C588.69L91.16%2C588.35L93.53%2C588.24L96.48%2C587.8L100.52%2C587.92L101.11%2C588.9L102.59%2C589.18L103.54%2C588.98L104.32%2C588.13L104.32%2C588.13L107.02%2C589.39L110.74%2C590.65L114.11%2C592.02L114.83%2C592.76L116.91%2C593.91L119.75%2C592.66L121.42%2C592.45L121.42%2C592.45L121.42%2C592.45L121.42%2C592.45L119.83%2C593.46L118.22%2C596.52L117.83%2C596.88L117.22%2C596.77L116.4%2C597.55L118.23%2C599.73L120.59%2C600.5L121.73%2C601.04L123.06%2C601.97L124.13%2C603.27L124.2%2C604.37L123.41%2C604.45L122.35%2C605.83L122.6%2C607.71L123%2C609.1L122.55%2C611.18L122.65%2C611.31L124.26%2C611.36L126.32%2C612.19L126.37%2C611.04L127.12%2C610.42L128.87%2C612.08L129.78%2C612.23L128.95%2C614.76L127.3%2C618.64L130.72%2C620.25L131.26%2C620.22L132.76%2C620.54L135.31%2C622.65L136.29%2C621.08L136.81%2C620.72L137.19%2C620.21L139.17%2C619.13L140.57%2C620.85L141.12%2C626.34L142.18%2C630.81L141.62%2C632.21L143.54%2C635.71L144.85%2C639.42L145.52%2C641.93L143.13%2C643.38L142.66%2C644.86L142.19%2C645.3L141.1%2C646.92L140.49%2C648.55L139.26%2C650.54L138.13%2C651.57L136.31%2C651.89L136.38%2C652.5L137.44%2C654.04L139.91%2C655.49L141.03%2C657L141.76%2C659.15L142.6%2C660.34L142.59%2C661.08L141.99%2C662.89L142.17%2C663.5L142.89%2C664.74L143.46%2C665.3L146.35%2C666.83L147.44%2C667.89L149.01%2C668.91L151.19%2C670.83L151.52%2C671.19L152.63%2C673.42L152.63%2C673.42L152.07%2C673.72L151.81%2C674.21L151.74%2C675.24L151.5%2C675.59L151.19%2C677.34L150.51%2C677.39L148.91%2C678L147.89%2C678.68L148.17%2C679.04L147.94%2C679.29L147.25%2C679.46L146.94%2C679.26L145.56%2C679L144.66%2C678.42L143.42%2C678L142.56%2C677.35L142.7%2C678.03L142.48%2C679.92L141.64%2C680.99L141.69%2C681.17L145.12%2C681.61L146.67%2C682.95L146.88%2C683.87L147.55%2C685.23L145.37%2C687.89L144.69%2C689.15L143.93%2C691.71L144.09%2C692.93L143.76%2C694.37L142.83%2C694.1L142.24%2C694.18L141.61%2C694.46L141.73%2C694.97L141.73%2C694.97L139.95%2C695.05L139.95%2C695.05L139.66%2C694.39L139.21%2C694.1L138.96%2C693.55L137.67%2C693.3L135.29%2C691.34L134.36%2C691.2L133.92%2C690.93L133.27%2C690.14L133.16%2C689.7L133.35%2C689.03L132.36%2C687.45L130.6%2C683.5L130.1%2C679.05L129.61%2C677.04L128.93%2C676.37L128.08%2C675.04L128.02%2C674.29L127.53%2C673.13L126.7%2C671.94L125.92%2C671.72L123.91%2C671.86L123.92%2C672.06L124.44%2C672.64L124.99%2C672.86L124.7%2C673.52L124.2%2C673.88L123.28%2C674.19L122.78%2C674.62L122.35%2C674.14L121.78%2C675.46L121.75%2C676.42L121.89%2C677.9L122.2%2C679.06L122.19%2C680.19L121.28%2C680.23L119.95%2C679.62L117.4%2C678.22L117.53%2C677.7L117.09%2C676.33L115.79%2C676.57L115.46%2C676.5L114.51%2C676.8L112.81%2C675.81L112.61%2C675.1L112.67%2C674.28L113.17%2C673.52L112.84%2C672.82L112.09%2C672.65L111.82%2C672.33L111.49%2C671.71L111.52%2C671.15L111.29%2C670.35L110.58%2C669.77L110.47%2C668.79L110.73%2C668.41L110.84%2C667.48L109.75%2C665.82L108.18%2C665.38L107.39%2C664.44L106.52%2C663.78L105.26%2C663.35L101.88%2C661.17L101.28%2C660.97L100.55%2C659.4L98.71%2C659.14L97.46%2C658.49L96.27%2C658.22L94.98%2C657.42L94.35%2C656.88L94.73%2C656.16L94.14%2C655.33L92.72%2C654.24L91.99%2C654.09L91.79%2C653.82L91.31%2C653.67L90.83%2C653.78L90.36%2C653.68L89.75%2C652.85L88.29%2C651.96L85.94%2C650.01L84.96%2C651.43L84.96%2C651.43L83.17%2C648.91L82.09%2C647.03L81.41%2C645.44L81.26%2C644.15L81.67%2C642.92L83.2%2C642.02L83.35%2C641.62L83.27%2C641.33L84%2C640.33L84.21%2C640.13L85.22%2C639.93L85.22%2C639.57L85.49%2C639.57L85.89%2C638.76L85.23%2C638.33L85%2C637.84L84.37%2C637.67L83.65%2C636.86L83.8%2C636.44L83.6%2C634.59L83.73%2C634.34L84.46%2C633.86L85.11%2C634.1L86.56%2C633.94L87.56%2C633.12L86.71%2C631.11L86.24%2C629.22L84.62%2C628.5L82.79%2C629.61L79.02%2C628.15L78.71%2C626.18L77.82%2C623.92L78.01%2C622.12L77.98%2C620.13L76.79%2C619.25L74.57%2C618.5L72.74%2C619.07L71.27%2C619.13L68.56%2C619.67L68.59%2C618.25L68.37%2C617.08L66.56%2C612.95L66.42%2C610.89L66.62%2C607.23z%22%2F%3E%0A%09%09%3Cpath%20fill%3D%22white%22%20stroke%3D%22none%22%20id%3D%22NO-03%22%20title%3D%22Oslo%22%20%20d%3D%22M139.95%2C695.05l1.78%2C-0.08l0%2C0l0.75%2C0.69l0.32%2C0.03l0.3%2C-0.23l0.48%2C0.36l0.07%2C1.08l0.72%2C1.17l0.59%2C0.21l-0.08%2C1.87l0.3%2C0.03l0.2%2C1.03l1.15%2C1l0.51%2C-0.24l0.81%2C1.55l-0.61%2C0.88l-0.26%2C1.57l0.04%2C1.16l0.53%2C1.73l-0.1%2C0.14l-0.98%2C0.65l-0.6%2C0.17l-0.71%2C-0.2l-0.85%2C-0.51l-0.54%2C-0.33l0%2C0l0.25%2C-0.83l-0.03%2C-0.58l-0.14%2C-0.54l-0.17%2C-0.25l-0.25%2C-0.38l-0.31%2C-0.57l-0.23%2C-0.34h-0.24l-0.44%2C0.28l-0.55%2C0.41l-0.34%2C-0.54l-0.55%2C-0.2l0%2C0l-0.25%2C-0.34l0.11%2C-1.6l-0.26%2C-0.67l-0.79%2C-0.71l-1.56%2C-0.7l-0.66%2C-0.8l0%2C0l1.97%2C-2.63l0.5%2C-0.2l-0.19%2C-0.92l-0.38%2C-0.83L139.95%2C695.05z%22%2F%3E%0A%09%09%3Cpath%20fill%3D%22white%22%20stroke%3D%22none%22%20id%3D%22NO-11%22%20title%3D%22Rogaland%22%20%20d%3D%22M32.98%2C733.66l0.67%2C-0.33l0.66%2C0.1l1.13%2C-0.26l0.9%2C0.72l0.42%2C0.93l-0.38%2C0.46l-0.97%2C0.52l-1.25%2C0.19l-0.68%2C0.37l-0.54%2C-0.17l-0.34%2C-0.43l-0.22%2C-0.91l0.12%2C-0.8L32.98%2C733.66zM59.5%2C711.24l-2.94%2C0.57l-3%2C1.72l-1.8%2C1.27l-1.66%2C0.44l-0.5%2C-0.21l-0.37%2C-0.42l0.78%2C-2.66l-0.14%2C-1.38l0.17%2C-0.16l0.15%2C-1.3l-0.31%2C-0.5l-0.6%2C-0.2l-0.45%2C0.24l-0.99%2C0.17l-1.13%2C-0.31l-1.86%2C1.32l-3.02%2C1.58l-0.1%2C0.61l-0.81%2C0.08l-0.68%2C1.72l0.15%2C0.67l-0.13%2C0.31l-1.05%2C1.07l-0.28%2C1.07l-0.54%2C0.98l-0.07%2C0.4l0.24%2C0.63l-0.21%2C0.99l-0.53%2C0.12l-0.94%2C-0.09l-0.75%2C-0.4l-0.56%2C-0.08l-2.15%2C0.73l-0.06%2C-0.81l-0.88%2C-0.45l-0.47%2C0.06l-1.11%2C1.14l-0.41%2C0.68l-0.69%2C-0.2l-0.77%2C0l-1.51%2C0.24l-0.12%2C-0.57l-0.96%2C-0.3l-0.77%2C0.75l0.36%2C0.81l-0.25%2C0.28l-0.92%2C0.56L24%2C722.49l-0.36%2C-0.31l0%2C0l-0.08%2C0.23l-0.71%2C1l-0.33%2C0.05l-0.67%2C0.04l-0.11%2C1.24l-0.23%2C-0.29l-0.01%2C-0.61l0%2C0l-1.3%2C0.31l-0.18%2C0.18l0.23%2C0.27l-0.21%2C0.15l-0.62%2C-0.03l-0.14%2C-0.58l-0.21%2C-0.01l-0.4%2C0.51l-0.66%2C0.43l-1.25%2C-1.27l0%2C0l-0.43%2C0.08l-0.09%2C0.22l0.05%2C0.51l0.01%2C0.31l0.12%2C0.46l0.12%2C0.53l0.06%2C0.78l0.05%2C0.3l0.38%2C0.34l0.09%2C0.71l0.32%2C0.1l0.54%2C0.97l0.48%2C1.41l0.26%2C0.98l0.12%2C0.71l0.05%2C1l0.39%2C1.19l0.36%2C-0.33l0.33%2C-0.45l-0.12%2C-0.58l0.1%2C-0.86l-0.05%2C-0.54l-0.05%2C-0.18l-0.05%2C-0.44l-0.23%2C-1.33l0.37%2C-0.1l0.24%2C1.48l0.1%2C0.86l0.05%2C0.24l-0.01%2C0.69l0.5%2C0.38l0.86%2C-0.08l0.19%2C0.5l0.24%2C0.45l0.34%2C0.14l0.68%2C0.05l0.61%2C-0.03l0.22%2C-0.1l0.75%2C-1.34l0.26%2C-0.78l0.31%2C-0.42l0.04%2C-1.06l-0.18%2C-0.7l0%2C-0.43l0.26%2C-0.16l0.1%2C-0.42l-0.3%2C-0.67L24.55%2C728l0.21%2C-2.09l0.14%2C-0.45l-0.13%2C-0.37l-0.16%2C-0.02l-0.55%2C0.37l-0.07%2C0.79l-0.48%2C0.57l-0.28%2C0.22l-0.69%2C-0.04l-0.62%2C0.04l-0.11%2C-0.04l0.13%2C-1.25l0.92%2C0.39l0.73%2C-0.99l0.63%2C-0.89l0.51%2C-0.4l0.88%2C-0.04l0.09%2C0.09l0.07%2C0.59l-0.49%2C0.57l0.26%2C2.85l0.25%2C0.45l0.4%2C1.75l0.15%2C0.99l-0.36%2C0.9l-0.09%2C0.85l-0.02%2C0.92l-0.14%2C0.51l0.31%2C0.53l0.39%2C-0.42l-0.07%2C-0.9l0.67%2C-0.5l0.76%2C-0.54l0.55%2C-0.78l-0.05%2C-0.66l0.62%2C0.31l0.32%2C0.21l0.12%2C0.33l0.79%2C-0.27l1.12%2C-0.54l0.37%2C-0.36l0.16%2C-1.42l-0.69%2C-0.56l-0.19%2C-0.36l-0.38%2C-1.51l-1.63%2C0.58l-0.37%2C0.26l-0.05%2C-0.64l-0.39%2C-0.96l0.01%2C-0.38l0.41%2C-0.04l0.33%2C1.22l0.9%2C-0.64L30.4%2C726l0.42%2C-0.43l-0.07%2C-0.93l-0.81%2C-1.58l0.23%2C-0.21l0.51%2C-0.74l0.2%2C-0.09l0.26%2C0.17l-0.05%2C1.51l0.68%2C0.45l0.03%2C0.48l0.25%2C0.55l1.81%2C-0.05l0.48%2C-0.2l0.71%2C0.03l0.72%2C0.19l0.56%2C-0.05l1.45%2C-0.31l0.24%2C-0.3l0.51%2C0.6l-0.75%2C0.06l-1.98%2C0.6l-1.3%2C0.68l-0.91%2C0.13l-0.62%2C-0.1l-0.46%2C-0.39l-0.37%2C0.23l-0.04%2C0.92l0.28%2C0.6l0.17%2C1.02l0.29%2C1.36l0.29%2C0.32l0.4%2C-0.01l0.22%2C-0.63l0.41%2C-0.46l0.46%2C-0.49l0.93%2C-0.52l0.42%2C-0.17l1.04%2C-0.67l0.88%2C-0.44l0.31%2C-0.5l0.99%2C-1.52l-0.09%2C-0.57l-0.17%2C-0.59l1.06%2C-0.87l0.39%2C-0.68l-0.06%2C-0.55l0.17%2C-0.5l0.74%2C-1.41l-0.17%2C-0.66l-0.14%2C-0.6l0.31%2C-0.73l0.27%2C-0.26l0.65%2C-0.35l0.51%2C0.14l-0.01%2C0.24l-0.32%2C0.36l-0.5%2C0.28l0.01%2C1.84l-0.34%2C0.77l-0.44%2C0.36l-0.64%2C1.94l0.29%2C-0.02l1.02%2C-0.7l0.68%2C-0.16l1.11%2C-0.46l0.86%2C-0.47l3.53%2C-0.18l-1.75%2C0.48l-2.07%2C0.58l-0.99%2C0.55l-2.69%2C0.97l-0.46%2C0.46l-0.09%2C0.58l0.24%2C0.45l-1.14%2C2.71l-1.57%2C0.18l-0.53%2C0.31l-0.67%2C0.36l-0.77%2C0.31l-0.3%2C0.68l-0.3%2C0.74l-0.14%2C0.48l0.58%2C0.66l1%2C-0.02l0.7%2C0.26l0.47%2C0.38l0.62%2C0.03l0.56%2C-0.2l0.88%2C-0.22l0.27%2C-0.34l0.67%2C0.43l0.49%2C0.18l-0.08%2C0.22l-0.36%2C0.15l-2.21%2C0.12l-0.84%2C-0.13l-0.28%2C0.1l-0.2%2C0.21l0.12%2C0.71l0.88%2C1.16l0.76%2C-0.49l1.95%2C-0.82l1.33%2C-0.65l0.36%2C-0.52l0.51%2C-0.18l1.2%2C-0.19l0.99%2C0.03l-1.05%2C0.44l-2.58%2C1.52l-0.87%2C0.46l-1.8%2C0.53l-0.44%2C0.48l-0.47%2C0.51l-1.04%2C0.69l-0.23%2C0.12l-0.31%2C0.46l-0.38%2C0.64l-0.4%2C0.74l-0.64%2C1.45l0.54%2C0.26l1.21%2C-0.68l1.37%2C0.13l0.22%2C0.25l-0.06%2C0.32l-1.83%2C0.15l-0.74%2C0.3l-0.74%2C0.51l-0.98%2C-0.35l-0.7%2C0.31l-0.34%2C0.29l-1.19%2C1.12l0.17%2C0.83l0.49%2C0.73l0.8%2C1.24l1.58%2C-0.08l0.51%2C1.09l-1.03%2C1.22l0.55%2C1.32l0.49%2C0.41l1.26%2C1.51l1.84%2C2.17l2.12%2C-0.04l0.44%2C0.14l-0.06%2C0.27l-2.35%2C0.23l-0.5%2C-0.23l-0.87%2C-0.55l-1.07%2C-1.36l-0.14%2C-0.22l-0.23%2C-0.21l-1.03%2C-0.4l-0.46%2C0.21l-0.53%2C-0.45l-0.05%2C-0.76l-0.15%2C-0.86l-0.55%2C-0.45l-0.13%2C-0.04l-0.92%2C-0.59l-0.7%2C0.23l-0.33%2C0.47l0.12%2C0.45l-0.11%2C0.47l-0.61%2C0.27l-0.74%2C-0.25l-0.29%2C0.35l-0.13%2C2.01l-0.53%2C0.74l-0.14%2C-0.5l0.24%2C-0.91l-0.37%2C-0.73l-0.13%2C-0.33l0.5%2C-0.41l0.08%2C-0.65l0.25%2C-0.79l0.03%2C-0.32l-0.49%2C-0.36l-0.71%2C-0.36l-0.68%2C-0.62l-0.73%2C-0.59l-1.26%2C-0.91l-0.47%2C-0.23l-0.39%2C0.87l-0.02%2C0.65l-0.13%2C0.56l0.12%2C0.37l0.64%2C0.44l-0.13%2C0.36l-0.28%2C0.32l-0.22%2C0.58l0.17%2C0.5l0.01%2C0.52l0.12%2C0.46l0.03%2C0.42l0.49%2C0.4l0.05%2C0.45l-0.64%2C0.21l-0.35%2C0.35l-0.14%2C0.39l0.01%2C0.35l-0.17%2C1.28l0.25%2C0.99l-0.39%2C0.91l-0.77%2C0.69l-0.28%2C0.52l0.59%2C0.65l0.18%2C1.4l0.47%2C0.36l0.17%2C0.35L23.71%2C761l0.28%2C0.57l0.76%2C0.73l0.5%2C1.31l0.77%2C1.17l0.28%2C1.15l0.59%2C0.61l0.34%2C0.3l0.86%2C0l0.79%2C0.26l0.64%2C0.66l-0.27%2C0.75l0.21%2C0.37l1.39%2C0.66l0.2%2C0.13l0.24%2C0.08l0.29%2C0.12l0.51%2C0.06l0.2%2C-0.03l0.69%2C-0.19l0.72%2C0.44l0.24%2C0.7l0.08%2C0.75l0.1%2C0.36l0.2%2C0.33l0.12%2C0.18l0.37%2C0.81l0.39%2C0.47l0.25%2C0.22l0.48%2C0.04l0.39%2C0.18l0.4%2C0.44l1.29%2C0.8l0.99%2C0.31l0.62%2C0.33l1.24%2C0.45l0.31%2C-0.09l0.44%2C0.25l0.03%2C0.51l1.04%2C0.93l0.32%2C0.05l0%2C0l3.91%2C-2.07l1.13%2C-1.63l0.24%2C-0.59l-0.39%2C-2.29l0.4%2C-0.13l0.4%2C-0.66l-0.24%2C-0.32l-0.3%2C-1.32l-0.38%2C-0.65l0.54%2C-2.36l-0.56%2C-2.2l0.4%2C-0.37l0.14%2C-0.59l-0.75%2C0.33l-1.11%2C-0.41l-0.76%2C0.56l-0.17%2C-0.04l-0.35%2C-1l-0.94%2C-0.7l0.41%2C-0.57l0.41%2C-0.16l0.92%2C0.03l2.41%2C-0.92l0.12%2C-0.38l-0.12%2C-0.71l-0.45%2C-0.73l-0.47%2C-0.39l0.08%2C-1l-1.39%2C-0.21l0.09%2C-0.77l0.95%2C-2.39l1.01%2C-1.91l-0.11%2C-0.12l-0.74%2C0.04l-0.19%2C-0.15l-0.1%2C-0.76l1.69%2C-1.71l-0.43%2C-1.16l0.06%2C-0.41l1.45%2C-0.55l0.65%2C-0.53l1.51%2C-1.62l0.41%2C-0.99l2.49%2C-2.25l-0.01%2C-0.97l-0.38%2C-0.52l0.33%2C-0.63l0.55%2C-0.34l0.34%2C-0.75l0%2C0l0%2C0l0%2C0l-1.98%2C0l-0.25%2C-0.22l0.11%2C-2.75l-0.53%2C-1.37l0.28%2C-1.86l1.21%2C-3.77l0.14%2C0.01l-0.02%2C0.15l0.6%2C-0.09l-0.05%2C-0.38l-0.7%2C-0.92l1.88%2C-0.58l1%2C-1.45l0.1%2C-0.3l-0.71%2C-2.8l0.68%2C-2.15l0.75%2C0.27l1.49%2C-1.73l-0.15%2C-1.27l0.9%2C-0.41l1.5%2C-0.29l0%2C0l-0.31%2C-0.59l-1.19%2C-0.35l-0.63%2C-0.43l0.05%2C-2.44L59.5%2C711.24zM24.48%2C741.29l0.56%2C-0.32l0.48%2C0.48l1.1%2C0.62l0.72%2C0.4l0.75%2C0.78l0.51%2C0.16l0.58%2C-0.51l-0.06%2C-1.34l-0.2%2C-0.39l-0.7%2C-0.4l-1.3%2C0.13l-0.89%2C-0.23l-0.4%2C0.01l-0.45%2C-0.19l-0.2%2C-0.42l-0.41%2C0.35l-0.23%2C0.26l-0.16%2C0.3L24.48%2C741.29zM20.17%2C739.29l0.29%2C-0.05l0.04%2C-0.52l0.2%2C-0.3l0.36%2C0.54l0.24%2C0.32l0.21%2C-0.01l0.22%2C-0.85l0.4%2C-0.44l-0.07%2C-0.56l-0.29%2C-0.97l-1.02%2C-0.95l-0.66%2C-0.12l-0.15%2C0.38l-0.13%2C0.45l0.01%2C0.44l0.13%2C1.08l-0.18%2C0.32l0.05%2C0.47L20.17%2C739.29zM18.54%2C733.79l-0.25%2C-0.15l-0.24%2C-0.32l0.41%2C-0.55l0.14%2C-0.22l-0.13%2C-0.58l-0.71%2C-0.38l-0.15%2C-0.19l-0.01%2C-0.33l0.43%2C-0.49l-0.09%2C-0.94l-0.57%2C-0.98l-0.85%2C-0.75l-0.25%2C0.56l-0.15%2C0.63l0.46%2C0.84l-0.56%2C0.22l-0.57%2C0.37l-0.03%2C0.58l0.34%2C0.94l0.28%2C0.37l-0.02%2C0.36l-0.07%2C0.88l-0.47%2C0.04l-0.32%2C1l0.16%2C0.56l0.02%2C0.4l-0.32%2C0.63l0.02%2C0.75l-0.03%2C0.41l0.13%2C0.61l0.06%2C0.36l0.35%2C0.55l0.04%2C0.77l0.24%2C0.26l0.98%2C0.13h1.09l0.14%2C-0.25l0.29%2C-0.79l0.06%2C-1.45l0.26%2C-1.32l0.04%2C-2.03L18.54%2C733.79zM24.11%2C742.11l0.39%2C0.59l0.29%2C-0.05l0.47%2C0.24l0.71%2C0.46l0.64%2C0.32l0.61%2C0.2l0.21%2C-0.26l-0.15%2C-0.48l-0.59%2C-0.58l-0.88%2C-0.58l-0.71%2C-0.35l-0.3%2C-0.07l-0.57%2C0.25L24.11%2C742.11zM28.92%2C738.67l0.01%2C0.85l0.23%2C0.48l0.37%2C0.27l0.66%2C-0.01l0.35%2C-0.15l0.22%2C-0.67l0.6%2C-0.46l0%2C-0.85l-1.06%2C-0.69l-0.35%2C0.2l-0.14%2C0.51l-0.22%2C0.13l-0.47%2C0.22L28.92%2C738.67z%22%2F%3E%0A%09%09%3Cpath%20fill%3D%22white%22%20stroke%3D%22none%22%20id%3D%22NO-14%22%20title%3D%22Sogn%20og%20Fjordane%22%20%20d%3D%22M8.69%2C658.69l0.9%2C2.04l0.07%2C0.78l-1.13%2C-0.31l-0.19%2C-0.18l-0.12%2C-0.5l-0.2%2C-0.48l-0.34%2C-0.57l-0.37%2C0.08L7.27%2C659l0.17%2C-0.25l0.92%2C-0.2L8.69%2C658.69zM11.75%2C658.81l-0.02%2C0.83v0.81l0.38%2C1.35l-0.44%2C0.08l-0.38%2C-0.21l-0.46%2C0.17l-0.39%2C-0.79l-0.02%2C-0.74l0.19%2C-0.35l-0.1%2C-1.42l-0.35%2C-1.06l0.22%2C-0.19l0.43%2C0.36L11.75%2C658.81zM10.7%2C654.07l0.39%2C-0.09l0.42%2C0.22l0.15%2C0.69l0.03%2C0.21l-0.52%2C0.62l-0.37%2C0.2l-0.55%2C0.05l-0.22%2C0.02l-0.35%2C-0.04l-0.28%2C-0.92l0.19%2C-0.8l0.68%2C-0.26L10.7%2C654.07zM4.47%2C650.79l0.16%2C0.8l0.17%2C0.99l0.52%2C0.53l0.03%2C0.46l-0.24%2C1.26l-0.07%2C0.12l-0.53%2C0.38l-0.47%2C-0.32l-0.46%2C-0.49l0.02%2C-0.43l-0.57%2C-0.97l0.01%2C-0.8l0.1%2C-0.59l0.39%2C-0.4l0.21%2C-0.22l0.24%2C-0.3l0.45%2C-0.74L4.47%2C650.79zM7.01%2C650.33l0.1%2C0.55l-0.15%2C1.54l-0.36%2C-0.38l-0.28%2C0.42l-0.06%2C0.58l0%2C0.4l-0.03%2C0.17l-0.26%2C-0.11l-0.28%2C-0.87l0.04%2C-1.52l-0.21%2C-0.47l0.02%2C-0.72l0.54%2C-0.08l0.3%2C-0.06l0.44%2C-0.01L7.01%2C650.33zM12.48%2C646.91l0.82%2C1.19l0.2%2C0.59l-0.2%2C0.49l-0.62%2C0.01l-0.73%2C-0.32l-0.14%2C-2.42L12.48%2C646.91zM9.15%2C644.53l0.96%2C0.53l0.23%2C-0.21l0.9%2C0.33l-0.14%2C0.59l0.01%2C0.58l0.29%2C0.45l0.4%2C2.67L11.54%2C650l-1.15%2C0.74l-0.48%2C0.48l-0.07%2C0.71l-0.36%2C0.2l-0.11%2C-0.89l0.06%2C-0.53l-0.16%2C-0.69l-0.19%2C-0.04l-0.21%2C0.22l-0.82%2C0.79l-0.15%2C0.76l-0.61%2C-0.98l0.16%2C-0.53l-0.15%2C-0.63l-0.09%2C-0.81l0.05%2C-0.73l-0.21%2C-0.78l0.23%2C-0.38l0.7%2C-0.65l0.24%2C0.06l0.5%2C0.22l0.26%2C-0.34l-0.38%2C-0.78l-0.06%2C-0.56l0.18%2C-0.39l0.35%2C-0.06L9.15%2C644.53zM9.21%2C636.61l0.48%2C-0.14l0.61%2C0.33l0.91%2C-0.34l0.3%2C0.18l0.14%2C0.6l0%2C0.87l0.35%2C1.09l-1.74%2C0.61l-0.22%2C-0.05l-0.26%2C-0.35l-0.04%2C-0.53l-0.46%2C-0.27l-0.57%2C-0.03l-0.23%2C-0.43l0.04%2C-0.36l0.53%2C-0.84L9.21%2C636.61zM8.72%2C620.64l-0.08%2C0.27l0.06%2C0.44l0.21%2C0.67l0.18%2C0.98l-0.21%2C0.13l-0.72%2C0.24l-0.31%2C-0.31l-0.19%2C-0.2l-0.17%2C-0.37l-0.16%2C-0.5l0.04%2C-0.64l0.59%2C-0.51l0.42%2C-0.46L8.72%2C620.64zM7.97%2C616.03l0.65%2C0.41l0.24%2C0.42l0.25%2C0.44l-0.28%2C0.47l-0.46%2C0.61l-0.63%2C0.45l0.01%2C-0.88l-0.13%2C-0.5l-0.29%2C-0.26l-0.83%2C-0.48l1.18%2C-0.94L7.97%2C616.03zM10.14%2C611.02l1.38%2C0.88l1.4%2C0.37l0.38%2C0.27l0.42%2C-0.07l2.33%2C0.32l0.75%2C0.28l0.31%2C0.36l-0.13%2C0.4l0.08%2C0.69l-0.53%2C0.19l-1.49%2C0.23l-0.98%2C0.09l-0.31%2C0.24l-1.2%2C0.75l-0.63%2C0.68l-0.57%2C0.4l-1.07%2C0.33L10.22%2C617l-0.37%2C-0.15l-0.26%2C-0.08l-0.38%2C-0.51l-0.19%2C-0.74l0.57%2C-0.25l0.44%2C-0.11l0.57%2C-0.64l-0.17%2C-0.18l-0.83%2C0.31l-0.49%2C-0.05l-0.4%2C-0.26l-0.07%2C-0.33l-1.31%2C0l-0.26%2C-0.31l1.1%2C-1.08l0.68%2C-0.22l0.74%2C-0.09l-0.06%2C-0.21l-0.6%2C-0.32l0.53%2C-0.55L10.14%2C611.02zM11.5%2C605.12l0.52%2C0.22l1.04%2C0.42l0.72%2C-0.48l0.26%2C-0.33l0.28%2C0.52L14.5%2C606l0.28%2C0.54l-0.36%2C1.01l0.19%2C1.19l-0.77%2C1.42h-0.78l-0.31%2C0.05l-0.32%2C-0.19l-0.32%2C-0.3l-0.54%2C-0.24l0.01%2C-0.42l0.72%2C-0.55l0.49%2C-0.48l-0.19%2C-0.13l-1.09%2C-0.61l-0.43%2C-0.26l-0.23%2C-1.1l0.01%2C-1.02l0.17%2C-0.08L11.5%2C605.12zM16.43%2C596.32l0.08%2C0.7l0.25%2C0.45l0.35%2C0.4l0.65%2C0.18l1.08%2C0.39l-0.07%2C0.49l-0.64%2C0.26l0.37%2C0.37l-0.11%2C0.5l0.17%2C0.7l0.66%2C0.5l0.28%2C0.5l0.76%2C0.39l0.9%2C0.96l0.29%2C-0.01l0.75%2C0.67l0.29%2C0.77l0.04%2C0.47l-0.3%2C0.38l0.02%2C0.54l0.23%2C0.07l0%2C0l0.11%2C0.25l-0.1%2C0.27l-0.7%2C0.56l-0.17%2C0.71l0.65%2C-0.61l1.65%2C1.24l1.15%2C-0.05l1.65%2C-0.61l0.3%2C0.29l0.3%2C0.02l0.28%2C-0.44l0.29%2C-0.14l0.4%2C0l0.25%2C0.38l0.69%2C-0.11l0.55%2C0.48l0.9%2C-0.42l1.07%2C-0.79l1.32%2C-0.29l0.94%2C0.34l0.66%2C1.18l0.55%2C0.3l2.01%2C-0.69l0.08%2C-0.68l0.87%2C-0.44l0.21%2C-0.76l1.25%2C0.08l0.65%2C0.21l-0.63%2C0.77l1.45%2C0.91l0.18%2C0.57l0.13%2C0.11l1%2C-0.71l1.02%2C-1.02l0.18%2C-0.73l0.37%2C-0.43l0.36%2C-0.08l0.61%2C0.18l0.75%2C-0.09l0.08%2C-1.02l0.71%2C-0.24l0.61%2C-0.5l0.61%2C-0.43l0.71%2C0.37l0.25%2C-0.06l0.68%2C-0.97l0.72%2C0.58l0.24%2C0.91l1.1%2C2.03l0.58%2C0.42l0.14%2C1.09l0.25%2C0.15l0.77%2C0.12l1.02%2C-0.22l0.98%2C-0.32l0.75%2C-0.49l0.75%2C0.34l0.77%2C-0.4l0.77%2C0.2l0.3%2C-0.48l0.7%2C-0.93l1.69%2C-0.23l0.65%2C0.11l0.33%2C-0.34l0.03%2C-0.47l0.68%2C-0.17l0.32%2C0.71l1.19%2C-0.06l1.09%2C0.61l0%2C0l1.46%2C1.14l-0.2%2C3.66l0.14%2C2.06l1.81%2C4.13l0.22%2C1.17l-0.03%2C1.42l2.71%2C-0.54l1.47%2C-0.06l1.83%2C-0.57l2.22%2C0.76l1.2%2C0.87l0.03%2C1.99l-0.2%2C1.8l0.89%2C2.27l0.31%2C1.97l3.78%2C1.45l1.83%2C-1.11l1.62%2C0.72l0.46%2C1.89l0.85%2C2.01l-1%2C0.82l-1.44%2C0.17l-0.66%2C-0.24l-0.72%2C0.48l-0.13%2C0.25l0.2%2C1.84l-0.15%2C0.42l0.72%2C0.81l0.64%2C0.17l0.23%2C0.49l0.66%2C0.43l-0.4%2C0.8h-0.27l0.01%2C0.36l-1.02%2C0.21l-0.2%2C0.2l-0.73%2C1l0.08%2C0.29l-0.14%2C0.4l-1.53%2C0.9l-0.41%2C1.23l0.15%2C1.29l0.68%2C1.59l1.08%2C1.88l1.78%2C2.51l0%2C0l0.14%2C1.43l-0.24%2C1.82l-0.77%2C0.28l-0.51%2C0.41l-2.38%2C4.03l-0.62%2C0.16l-0.72%2C-0.15l-2.52%2C-1.17l-2.15%2C1.82l-1.53%2C2.68l-0.27%2C0.62l0.37%2C1.69l-0.33%2C0.98l-0.45%2C0.46l-0.57%2C0.1l-0.53%2C-0.31l-0.53%2C0.05l-1.29%2C0.78l-1.03%2C1.52l-1.55%2C0.84l0%2C0l-2.01%2C-0.01l-3.25%2C-0.89l-0.7%2C-0.05l-0.47%2C0.48l-0.87%2C0.09l-0.88%2C-0.96l-0.61%2C0.07l-1.9%2C-0.34l0.05%2C-1.01l-0.74%2C-4.82l-1.99%2C-0.61l-0.57%2C0.15l-0.85%2C0.56l-1.93%2C-0.1l-0.09%2C-0.2l1.06%2C-1.61l0.66%2C-0.15l0.64%2C-0.48l0.08%2C-0.43L53%2C658.69l-0.32%2C-0.07l0.04%2C-0.3l-0.17%2C-0.15l-1.05%2C0.61l-0.14%2C-1.15l-0.77%2C0.13l-0.23%2C-0.69l-0.44%2C-0.51l-0.52%2C0.09l-0.01%2C1.21l-1.37%2C0.59l-0.6%2C0.85l-0.71%2C0.33l-0.49%2C-0.61l-0.51%2C-0.27l0.21%2C-0.8l-0.38%2C-0.96l-0.54%2C0.2l-0.65%2C0.83l-0.38%2C0.12l-0.88%2C-0.19l-2.02%2C2.32l-1.95%2C-1.54l-1.19%2C-0.31l-0.52%2C-0.84l0.23%2C-2.08l-0.44%2C-0.45l-1.12%2C-0.37l-0.67%2C-1.33l-0.59%2C-0.33l-1.75%2C1.2l-0.41%2C-0.01l-0.39%2C0.51l-0.8%2C2.02l-0.67%2C-0.07l-1.32%2C-1.4l-1.33%2C0.45l-0.72%2C0.86l-0.75%2C-0.2l-0.62%2C-0.75l-0.5%2C0.03l-0.95%2C0.74l-0.96%2C1.17l-0.74%2C0.52l-0.63%2C0.18l-0.25%2C-0.71l-1.13%2C0.48l-0.89%2C0.66l-1.16%2C-0.16l-0.68%2C-1.1l-0.52%2C-0.02l0.07%2C0.31l-0.24%2C0.23l-1.24%2C0.34l-0.47%2C0.55L15%2C659.38l-0.22%2C0.75l-0.74%2C1.39l-0.11%2C1.15l0%2C0l-0.58%2C-0.24l-0.6%2C-0.42l0.12%2C-0.28l-0.3%2C-0.58l-0.07%2C-0.42l-0.28%2C-0.83l-0.28%2C-0.44l0.08%2C-0.57l0.04%2C-0.62l-0.02%2C-0.37l-0.34%2C0.08l-0.25%2C-0.34l-0.16%2C-0.85l0.02%2C-0.3l0.67%2C-0.22l0.33%2C0.34l0.97%2C-0.06l0.37%2C0.05l0.19%2C0.07l0.14%2C0.97l0.03%2C0.41l0.17%2C-0.1l0.26%2C-0.41l-0.17%2C-1.19l-0.25%2C-0.11l-0.76%2C-0.38l-0.42%2C-0.3l-0.68%2C0.05l-0.11%2C-0.96l-0.02%2C-0.35l-0.11%2C-0.85l-0.13%2C-0.41l0.39%2C-1.19l0.33%2C-0.27l0.93%2C-0.38l1.03%2C0.06l0.19%2C-0.46l0.14%2C-0.21l0.84%2C0.26l0.43%2C0.08l0.65%2C0.57l1.26%2C0.04l0.28%2C0.28l0.56%2C0.82l0.88%2C0.44l0.95%2C0.47l0.78%2C-0.06l0.48%2C0.09l0.64%2C0.07l-0.24%2C-1.27l0.36%2C-0.36l0.45%2C-0.37l1.28%2C-0.09l1.09%2C-0.91l0.77%2C-0.83l0.41%2C-0.1l0.64%2C0.65l0.79%2C-0.33l0.95%2C-0.85l0.49%2C-0.43l0.27%2C-0.01l0.39%2C0.25l-0.07%2C1.71l-0.52%2C1.1l0.04%2C0.42l0.18%2C0.11l0.71%2C-1.45l0.23%2C-0.86l0.18%2C-0.53l0.29%2C-0.3l0.52%2C-0.62l2.11%2C0.03l0.34%2C0.14l0.73%2C0.47l0.54%2C0.08l0.39%2C0.02l1.12%2C-0.21h0.31h0.41l0.31%2C-0.05l0.66%2C0.17l0.49%2C0.66l0.76%2C-0.09l1.02%2C0.22l0.28%2C0.21l0.03%2C0.3l0.35%2C0.2l0.11%2C0.42l-0.37%2C0.59l-0.07%2C0.78l-0.31%2C0.23l-0.5%2C0.04l-0.03%2C0.2l0.4%2C0.01l0.53%2C-0.37l0.19%2C-0.57l0.64%2C-0.76l1.5%2C0.05l0.02%2C0.65l-0.58%2C1.19v0.58l-0.81%2C0.38v0.22l0.23%2C0.16l0.2%2C-0.3l1.06%2C0.04l-0.38%2C-0.73l0.46%2C-0.64l0.32%2C-1.58l0.34%2C-0.38l0.34%2C-0.17l0.9%2C-0.06l0.83%2C-0.95l0.73%2C0.12l0.17%2C0.51l0.19%2C-0.03l0.13%2C-0.92l0.68%2C-1.77l0.31%2C-1.39l0.28%2C0.05l0.52%2C0.69l0.66%2C0.41l1.43%2C0.02l0.37%2C0.34l0.71%2C-0.02l0.23%2C-0.18l0.68%2C0.1l0.6%2C0.75l0.1%2C1l-0.15%2C0.37l0.15%2C0.53l0.74%2C0.26l0.29%2C0.4l0.18%2C-0.19l0.2%2C0.23l0.16%2C-0.54l0.22%2C-0.08l0.5%2C0.27l0.24%2C0.42l0.4%2C0.25l0.17%2C0.52l-0.14%2C0.55l0.5%2C1.27l0.11%2C0.94l-0.23%2C0.17l-0.24%2C0.72L56.77%2C656l-0.44%2C0.05l-0.71%2C0.53l-0.06%2C0.56l-1.34%2C0.63l-0.12%2C1.19l-0.77%2C1.55l0.95%2C-1.29l0.08%2C-0.9l-0.11%2C-0.19l0.11%2C-0.13l0.51%2C-0.45l0.96%2C-0.33l0.1%2C-0.28l0.56%2C-0.49l0.44%2C-0.05l0.84%2C-0.52l0.48%2C-0.65l1.09%2C1.42l1.34%2C0.81l-0.08%2C0.63l0.15%2C0.48l-0.46%2C1.42l-0.56%2C1l0.2%2C0.12l0.43%2C-0.28l0.06%2C-0.43l0.65%2C-1.29l0.28%2C-0.08l0.25%2C-0.74l-0.05%2C-0.76l-0.27%2C-0.6l-1.31%2C-0.3l-0.38%2C-0.6l-0.5%2C-0.3L58.8%2C655l0.05%2C-0.56l-0.36%2C-0.53l0.07%2C-0.31l-0.42%2C-0.56l-0.11%2C-0.63l0.3%2C-0.7l-0.22%2C-0.42l0.02%2C-0.52l-0.3%2C-0.3l0.33%2C-0.74l0.57%2C-0.43l0.18%2C0.22l0.51%2C0.03l0.93%2C-0.2l0.54%2C-0.35l0.79%2C0.12l0.45%2C-0.13l0.39%2C-0.48l0.32%2C-0.9l0.58%2C0.23l0.83%2C0.79l0.48%2C0.25l0.72%2C-0.21l0.57%2C0.21l0.21%2C0.48l0.55%2C0.36l0.29%2C0.07l0.52%2C-0.18l0.35%2C0.27l0.15%2C-0.21l-0.15%2C-0.22l-0.42%2C-0.18L67%2C649.28l-0.27%2C-1.04l-0.92%2C-0.58l1.12%2C-0.46l0.76%2C-0.96l0.34%2C-0.06l0.98%2C-0.67l2.53%2C-0.17l0.49%2C-0.53l0.29%2C-0.76l0.73%2C0.07l0.45%2C-0.25l0.08%2C-0.28l-0.16%2C-0.16l-0.6%2C0.14l-0.68%2C-0.38l-0.37%2C0.5l-0.23%2C0.79l-1.96%2C0.3l-0.53%2C-0.13l-0.86%2C0.4l-1.35%2C0.05l-0.6%2C-0.32l-0.33%2C-2.8l-0.36%2C-0.21l-0.2%2C-0.47l-0.56%2C-0.26l-0.45%2C-0.53l0.06%2C-0.21l1.02%2C-0.49l0.62%2C-0.69l0.21%2C-0.48l-0.11%2C-0.95l0.56%2C-1.16l0.46%2C-0.66l0.6%2C-0.22l0.56%2C-0.49l0.28%2C-1.36l0.56%2C-0.51l0.68%2C-0.23l0.68%2C-0.85l0.33%2C-0.74l-0.17%2C-0.36l-0.36%2C0.3l-0.11%2C0.45l-0.96%2C1l-1.71%2C0.94l-0.33%2C1.36l-0.79%2C0.29l-0.57%2C0.42l-0.3%2C0.73l-0.67%2C-0.52l-0.47%2C-0.01l-0.39%2C-0.43l-0.31%2C0.06l0.29%2C0.65l1.05%2C0.79l0.09%2C1.21l-0.45%2C0.69l-0.36%2C0.13l-1.04%2C1.05l-0.4%2C0.21l0.37%2C0.28l0.39%2C0.74l1.1%2C0.63l0.21%2C0.59l0.36%2C2.68l0.96%2C0.71l-1.53%2C1.19l-1.54%2C-0.54l-0.13%2C-0.23l0.15%2C-0.29l-0.52%2C-0.21l0.14%2C0.58l-1.12%2C0.11l-0.4%2C0.32l-0.07%2C0.91l-0.57%2C-0.07l-1.1%2C0.38l-0.58%2C0.05l-0.29%2C-0.14l-0.58%2C0.19l-0.87%2C0.57l-0.18%2C0.75l-0.75%2C-0.38l-0.38%2C0.05l-0.03%2C-0.72l-0.36%2C-0.5l0.04%2C-0.22l0.75%2C-0.48l0.58%2C0.21l0.25%2C-0.12l0.78%2C-1l0.09%2C-0.44l0.34%2C-0.41l0.41%2C-0.01l0.22%2C-0.32l2.17%2C-0.11l-0.52%2C-0.35L60%2C644.69l-0.06%2C-0.15l0.04%2C-0.8l0.3%2C-0.42l0.04%2C-0.51l0.62%2C-0.05l0.23%2C-0.21l-0.16%2C-0.58l-0.11%2C0.32l-0.37%2C0l-0.72%2C0.65l0.16%2C0.68l-0.4%2C0.16l0.06%2C0.28l-0.24%2C0.42l-0.36%2C0.27l-0.41%2C0.04l-0.15%2C0.43l-0.68%2C0.31l-0.12%2C0.61l-0.19%2C-0.04l-0.38%2C0.5l0.02%2C0.54l-0.98%2C-0.2l-0.59%2C0.16l-0.34%2C-0.1l-0.55%2C-0.62l-0.45%2C0.04l-0.37%2C-0.23l-0.12%2C-0.32l-0.27%2C-0.06l-1.34%2C0.23l-1.38%2C0.01l-0.4%2C-0.76l-0.39%2C-0.26l-1.2%2C-0.31l-0.23%2C0.15l-0.53%2C-0.05l-0.08%2C-0.58l-0.24%2C-0.32l0.12%2C-0.64l0.75%2C-0.49l0.65%2C-0.84l0.65%2C-0.53l0.17%2C-0.38l-0.08%2C-0.5l0.25%2C-0.66l0.54%2C-1.16l0.58%2C-0.57l0.37%2C-2.51l0.02%2C-0.7l-0.14%2C-0.09l-0.28%2C0.73l0.04%2C0.67l-0.43%2C1.61l-0.71%2C0.72l-0.77%2C1.87l-0.03%2C0.64l-0.67%2C0.4l-0.44%2C0.62l-0.79%2C0.58l-0.22%2C-0.83l-0.03%2C-1.24l-0.2%2C-0.29l-0.2%2C1.38l-0.43%2C0.07l-0.44%2C-0.3l-0.13%2C0.07l0.88%2C0.68l0.37%2C0.91l-0.17%2C0.7l0.49%2C0.71l-0.1%2C0.11l-0.14%2C-0.24l-0.37%2C0.1l-0.88%2C-0.28l-0.5%2C-0.43l0.26%2C0.48l1.05%2C0.39l-0.23%2C1.02l0.34%2C1.06l0.01%2C1.28l-0.84%2C0.38l-0.69%2C0.07l-0.15%2C0.22l0.1%2C0.48l-1.11%2C0.14l-0.32%2C-0.18l-0.93%2C0.25l-0.27%2C-0.09l-0.2%2C-0.38l-0.25%2C-0.01l-0.14%2C-0.27l-0.52%2C-0.08l-0.21%2C-0.28l-0.77%2C0.05l-0.83%2C-1.07l-0.72%2C-0.46l0.49%2C-0.88l-0.05%2C-0.19l-0.51%2C0.43l-0.41%2C0.89l-0.49%2C0.03l-0.49%2C0.28l-1.1%2C0.21l-0.69%2C0.18l-0.26%2C-0.08l-0.82%2C-0.54l-0.19%2C-0.26l0.34%2C-0.49l0.83%2C-0.28l0.34%2C-0.3l0.2%2C-0.95l-0.36%2C-0.54l-0.28%2C1.11l-1.22%2C0.66l-0.26%2C0.4l-1.11%2C0.4l-1.32%2C0.2l-0.23%2C-0.04l-0.83%2C-0.03l-0.68%2C-0.01l-1.67%2C-0.26l-0.17%2C0.23l0.08%2C0.76l-0.48%2C0.44l-0.73%2C-0.43l-0.42%2C-0.06L26%2C648.07l-0.64%2C-0.13l-1.07%2C1.39l-0.91%2C0.57l-0.5%2C-0.09l-1.29%2C1.12l-0.69%2C0.39l-0.65%2C0l-0.22%2C-0.8l-0.7%2C-0.59l-0.49%2C-1.06l-0.4%2C0.36l-0.6%2C0.31l-0.79%2C0.22l-0.52%2C-0.11l-0.07%2C-0.97l-0.62%2C-0.38l0.18%2C-0.47l0.77%2C-0.02l0.59%2C0.7l0.39%2C-0.12l0.11%2C-0.24l-0.83%2C-0.7l-0.68%2C-0.19l-0.18%2C-0.31l-0.44%2C0.05l-0.24%2C0.27l-0.01%2C0.38l-0.25%2C0.02l-1.36%2C-0.8l-0.85%2C-0.19l0.28%2C-1.47l0.65%2C-0.26l0.96%2C0.08l1.28%2C0.64l0.58%2C0.7l0.48%2C0.23l0.65%2C-0.07l0.5%2C-0.58l-0.01%2C-0.15l-1.25%2C-0.87l-0.9%2C-0.61l-0.77%2C-0.44l-2.75%2C0.38l-1.23%2C-0.09l-0.05%2C-0.27l0.09%2C-0.78l-0.14%2C-0.22l-0.34%2C-0.25l-0.24%2C-0.24l-0.14%2C-0.47l0.14%2C-0.77l0.85%2C-0.1l0.35%2C-0.48l0.7%2C-0.17l0.71%2C0l0.31%2C0.07l0.52%2C-0.11v-0.48l0.22%2C-0.34l0.28%2C0.01l0.56%2C0.55l0.65%2C0.13l0.46%2C-0.14l-0.08%2C-0.22l-0.44%2C-0.19l-0.08%2C-0.82l-0.01%2C-0.48l0.64%2C-0.11l1.24%2C-0.2l0.95%2C-0.14l0.86%2C0l0.25%2C-0.19l0.8%2C-0.53l1.18%2C-0.27l0.5%2C-0.09l0.78%2C0.17l0.38%2C-0.4l-1.24%2C-0.1l-0.75%2C-0.14l-0.62%2C-0.04l-0.29%2C0.09l-0.34%2C0.52l-1.6%2C0.02l-2.27%2C0.52l-0.65%2C0.11l-0.29%2C0.34l-0.13%2C0.82l-1.29%2C0.26l-0.47%2C0.36H13.1l-0.17%2C-0.21l0%2C-0.6l-0.43%2C-0.36l-0.64%2C-1.46l0.19%2C-0.79l0.51%2C-0.45l0.83%2C0.05l0.29%2C-0.51l0.38%2C-0.62l-0.8%2C0.01l-1.79%2C0.94l-0.41%2C-0.17l-0.3%2C-0.6l0.55%2C-0.47l1.03%2C-0.4l0.65%2C-0.52l0.48%2C-0.17l1.87%2C-0.22l1.34%2C0.1l-0.18%2C-0.94l0.21%2C-0.35l0.63%2C0.08l1.47%2C0.13l1.92%2C0.05l0.25%2C0.15l0.19%2C0.76l0.58%2C0.5l1.55%2C0.34l0.8%2C-0.19l0.48%2C-0.26l0.29%2C-0.14l0.82%2C-0.02l0.59%2C-0.73l0.76%2C-0.7l0.22%2C-0.27l0.37%2C-0.07l0.75%2C-0.09l0.33%2C0.39l0.69%2C0.84l0.37%2C0.29l0.32%2C0.16l0.23%2C-0.2l-0.66%2C-1.27l-0.34%2C-0.29l-0.93%2C-0.37l-0.86%2C-0.24l-0.5%2C0.18l-1.12%2C0.85l-0.14%2C0.17l-1.96%2C0.88l-0.39%2C0.39h-1.08l-0.08%2C-0.9l-0.22%2C-0.49l-0.18%2C-0.19l-0.99%2C-0.12l-2.83%2C-0.34l-1.12%2C-0.05l-0.62%2C-0.36l-1%2C-0.38l-0.2%2C-0.41l0.19%2C-1.19l0.05%2C-0.39l0.75%2C0.05l0.48%2C0.45l0.55%2C0.2l0.92%2C-0.01l0.59%2C-0.25l0.45%2C-0.52l-1.06%2C-0.54l-0.47%2C-0.07l-0.95%2C-0.65l-0.84%2C-0.04l-0.4%2C-0.46l0.41%2C-0.31l3.7%2C0.84l2.19%2C0.61l0.09%2C-0.09l0.03%2C-0.82l-0.69%2C-0.4l-0.96%2C-0.47l-1.23%2C-0.26l-0.93%2C0.07l-1.77%2C0.05l-1.73%2C0.48l-2.11%2C0.56l-0.24%2C0.2l-0.95%2C0.3l0.01%2C-0.95l0.28%2C-0.17l1.24%2C-0.26l0.26%2C-0.29l0.62%2C0.02l0.7%2C0.09l1.54%2C-0.3l1.7%2C-0.08l-0.07%2C-0.46l0%2C-0.19l-0.79%2C-0.1l-1.83%2C0.24L14%2C624.39l-0.37%2C-0.27l-1.79%2C0.39l-0.79%2C0.13l0.23%2C-0.84l-0.52%2C-0.99l-0.15%2C-0.49l0.01%2C-0.53l-0.06%2C-1.62l0.61%2C-0.91l1.12%2C-0.89l0.99%2C0.26l0.76%2C0.47l0.6%2C0.45l0.1%2C0.41l0.51%2C0.22l0.95%2C-0.08l0.14%2C-0.22l-0.79%2C-0.44l-0.81%2C-0.88l1.19%2C-0.17l0.99%2C-0.2l0.63%2C-0.09l0.51%2C-0.36l-0.88%2C-0.32l-1.07%2C0.35l-1.13%2C-0.08l-0.47%2C0.33l-0.88%2C0.28l-0.18%2C-0.81l0.78%2C-0.92l0.73%2C-0.58l0.47%2C-0.17l0.65%2C0.07l1.07%2C-0.55l0.85%2C-0.8l0.71%2C-0.51l-0.56%2C-0.49l-0.01%2C-0.37l0.7%2C-0.7l0.43%2C-0.62l0.66%2C-0.74l1.13%2C-0.53l0.31%2C0.06l0.57%2C0.46l0.96%2C-0.03l0.68%2C0.18l-0.1%2C0.49l0.2%2C0.22l1.22%2C-0.52l1.22%2C0.53l1.33%2C0.21l0.27%2C0.14l0.43%2C1.12l0.19%2C0.38l1.44%2C0.44l1.14%2C-0.65l1.16%2C-0.16l0.71%2C0.33l0.86%2C0.13l-0.16%2C1.35l-0.54%2C2.16l-0.31%2C0.91l0.61%2C0.04l0.58%2C-2.21l0.23%2C-1.74l0.39%2C-0.33l0.48%2C-0.11l0.48%2C1.03l1.48%2C2.3l1.35%2C0.77l0.79%2C-0.44l0.03%2C-0.24l-0.76%2C-0.22l-0.23%2C-0.21l-1.26%2C-1.43l-0.09%2C-0.31l-0.77%2C-0.69l0.02%2C-0.53l1.11%2C0.81l0.87%2C-0.22l0.54%2C0.08l1.5%2C-0.67l0.91%2C0l0.48%2C0.31l0.42%2C0.04l0.62%2C0.69l0.84%2C0.58l1.7%2C0.41l0.71%2C-0.02l0.64%2C-0.17l0.79%2C-1l0.99%2C-0.76l0.14%2C-0.37l-0.71%2C-0.52l0.1%2C-0.21l1.34%2C-0.26l0.47%2C0.15l0.3%2C-0.12l1.73%2C0.42l0.87%2C0.58l0.3%2C0.84l0.39%2C-1.59h0.94l-0.61%2C-0.34l-0.95%2C0.32l-0.78%2C-0.47l-0.93%2C-0.06l-0.21%2C-0.13l-0.09%2C-0.4l0.15%2C-0.58l-0.8%2C0.81l-1.07%2C-0.19l-1.56%2C0.4l-0.68%2C1.01l-0.23%2C1.27l-1.86%2C0.21l-0.97%2C-0.26L42%2C613.45l-0.82%2C-0.25l-0.7%2C0.18l-1.3%2C0.17l-1.92%2C0.4l-0.48%2C-0.45l-0.99%2C-0.74l-0.71%2C-0.23l-2.06%2C0.14l-1.55%2C0.02l-0.73%2C0.1l-0.77%2C0.72l-0.97%2C-0.68l-0.9%2C-0.99l0.05%2C-0.15l1.41%2C-0.25l1.13%2C0.19l1.12%2C-0.32l1.77%2C0.14l0.26%2C-0.22l-0.01%2C-0.22l-0.23%2C-0.18l-1.67%2C-0.3l-1%2C0.3l-2.19%2C-0.24l-1.08%2C0.33l-0.86%2C0.01l-1.08%2C-0.2l-0.83%2C-0.45L23%2C610.2l-0.63%2C-0.02l-2.3%2C-0.18l-0.71%2C0.75L18.6%2C611l-0.57%2C-0.15l-1.23%2C0.09l-0.43%2C-0.22l-0.63%2C0.76l-0.34%2C0.15l-0.32%2C-0.23l-0.46%2C-0.53l-0.26%2C-0.26l-0.35%2C-0.13l0.36%2C-0.76l0.47%2C-1.07l-0.02%2C-0.91l0.28%2C-0.47l0.6%2C-0.02l-0.04%2C1.52l0.72%2C1.09l-0.06%2C-0.64l-0.48%2C-1.51l0.91%2C-0.29l0.23%2C0.13l0.5%2C1.05l0.4%2C0.41l0.22%2C-0.33l-0.08%2C-0.36l-0.53%2C-0.68l0.51%2C-0.46l0.53%2C-0.1l0.26%2C-0.61l0.35%2C-1.1l0.46%2C-0.05l0.37%2C0.13l0.56%2C0.37l0.35%2C0.12l0.17%2C-0.24l-0.35%2C-0.52l-0.39%2C-0.18l-1.34%2C-0.17l0.06%2C-0.37L19%2C603.63l-0.73%2C-0.75l-0.83%2C-0.28l-0.72%2C-0.92l-0.31%2C-0.1l-2.46%2C0.16l-0.17%2C-0.22l0.02%2C-1l0.19%2C-0.12l0.77%2C0.26l0.15%2C-0.25l-0.57%2C-1.02l-0.71%2C-0.26l-0.19%2C-0.24l-0.22%2C-0.57l0.11%2C-0.98l0.17%2C-0.3l0.56%2C-0.33l0.45%2C0.1l0.26%2C0.5l0.46%2C-0.53l0.07%2C-0.68l0.1%2C-0.07L16.43%2C596.32z%22%2F%3E%0A%09%09%3Cpath%20fill%3D%22white%22%20stroke%3D%22none%22%20id%3D%22NO-16%22%20title%3D%22S%C3%B8r-Tr%C3%B8ndelag%22%20%20d%3D%22M99.98%2C523.13l0.01%2C0.22l-0.34%2C0.2l-1.6%2C0.72l-1.3%2C-0.03l-0.18%2C0.13l-0.97%2C0.42l-0.24%2C-0.63l0.61%2C-0.19l0.54%2C-0.26l0.19%2C-0.22l1.04%2C0.09l0.34%2C-0.27l0.49%2C-0.24l0.58%2C0.07h0.26l0.37%2C-0.01L99.98%2C523.13zM112.28%2C516.5l0.35%2C-0.23l0.55%2C-0.52l0.2%2C-0.81l-0.23%2C-0.28l-0.12%2C-0.17l-0.15%2C-0.13l-0.28%2C0.17l-0.34%2C0.42l-0.17%2C0.28l-0.02%2C0.15l-0.15%2C0.61l0.02%2C0.42l0.1%2C0.11L112.28%2C516.5zM103.45%2C525.37l1.76%2C0.13l0.52%2C-0.38l0.64%2C-0.38l0.63%2C-0.38l0.44%2C-0.66l-0.66%2C-0.26l-0.21%2C-0.04l-0.65%2C-0.31l-1.65%2C-0.1l-0.14%2C0.15l-0.07%2C0.85l-0.42%2C0.72L103.45%2C525.37zM99.97%2C519.23l0.27%2C0.92l0.13%2C0.05l0.47%2C-0.13l0.22%2C-0.5l0.43%2C-0.25l-0.07%2C-0.26l-0.26%2C-0.06l-0.23%2C-0.1l-0.65%2C0.25L99.97%2C519.23zM111.94%2C523.72l0.32%2C-0.07l0.56%2C-0.31l0.32%2C-0.12l0.01%2C-1l-0.39%2C-0.37l-0.23%2C-0.03l-0.31%2C0.08l-0.03%2C0.45l-0.46%2C0.38l-0.08%2C0.28l-0.14%2C0.44L111.94%2C523.72zM115.87%2C520.38l0.27%2C-0.04l0.29%2C0.42l0.04%2C0.54l-0.42%2C1.39l-0.45%2C0.34l0.16%2C0.49l0.38%2C0.26l0.47%2C-1.16l0.68%2C-0.33l1.15%2C0.08l-0.02%2C-1.03l0.31%2C-0.45l0.54%2C0.12l0.9%2C0.16l0.88%2C-0.46l0.78%2C-0.4l0.93%2C-0.34l0.29%2C-0.16l0.33%2C-0.31l0.46%2C-0.6l0.84%2C-0.7l2.19%2C-0.42l0.7%2C-0.65l0.5%2C-0.07l-0.29%2C0.71l-0.57%2C0.21l-0.67%2C1.51l0.47%2C-0.08l1.01%2C-0.91l1.19%2C-0.43l0.19%2C0.06l-1.47%2C1.2l-0.62%2C0.4l-0.3%2C0.2l-0.69%2C0.34l-0.49%2C0.13l-0.17%2C-0.47l-0.89%2C0.63l0.4%2C0.19l0.04%2C0.36l-0.64%2C0.02l-0.23%2C-0.27l-0.25%2C0.03l-0.64%2C0.4l-0.59%2C0.23l-0.47%2C-0.09l-0.45%2C0.39l0.21%2C0.54l-0.45%2C0.37l-0.08%2C0.34l0.59%2C0.63l0.65%2C0.21l-1.19%2C0.77l0.19%2C0.34l0.28%2C0.66l0.2%2C0.44l0.47%2C0.69l0.59%2C-0.01l0.71%2C-0.28l0.23%2C0.18l0.09%2C0.41l-0.64%2C0.36l0.02%2C0.53l0.09%2C0.35l0.16%2C0.97l0.3%2C1.15l0.23%2C0.59l0.42%2C0.37l0.83%2C0.04l0.61%2C0.13l0.87%2C0.14l1.21%2C-0.23l0.62%2C-0.36l0.28%2C-0.58l0.54%2C-0.47l0%2C0l-0.28%2C-1.17l-0.23%2C-1.03l-0.24%2C-0.82l0.81%2C-0.84l0.62%2C-1.41l0.28%2C-1.31l3.02%2C-2.05l1.07%2C-0.9l1.16%2C-1.37l0.42%2C-2.04l1.47%2C-3.44l2.06%2C-3.58l1.58%2C-0.9l0.91%2C-0.72l0.85%2C-1.75l0.42%2C-0.51l0.19%2C-0.81l-0.14%2C-0.51l-0.39%2C-0.52l0%2C-0.38l1.39%2C-1.9l0.07%2C-1.29l0.34%2C-0.3l0.86%2C-0.32l0.1%2C-0.25l-0.44%2C-0.54l-1.77%2C-0.2l-1%2C-3l3.46%2C-1.8l0.4%2C-0.8l0.42%2C-2.81l-2.46%2C-0.81l-1.58%2C-1.28l-1.05%2C-1.21l-0.07%2C-0.97l-0.19%2C-0.34l-1.73%2C-1.19l-2.44%2C-2.23l0%2C0l-0.54%2C0.44l-0.81%2C0.77l-0.01%2C0.13l0.34%2C0.4l0.41%2C0.45l0.24%2C-0.06l0.05%2C-0.36l1.41%2C-0.29l0.43%2C0.28l-0.31%2C0.39l0.13%2C0.16l0.69%2C0.11l0.21%2C0.06l0.18%2C0.44l-0.11%2C0.33l0.04%2C0.33l0.48%2C0.13l0.39%2C-0.34l0.38%2C0.46l-0.87%2C0.69l-0.35%2C-0.16l-0.6%2C-0.55l-0.2%2C-0.47l-0.25%2C-0.17l-0.76%2C0.06l-0.34%2C-0.28h-0.28l0.14%2C0.53l-0.12%2C0.45l0.99%2C0.68l0.65%2C0.78l-0.33%2C0.14l-0.64%2C-0.52l-0.55%2C-0.52l-0.54%2C-0.64h-0.51l-0.65%2C0.21l0.21%2C0.39l-0.09%2C1.19l0.3%2C0.43l-0.21%2C0.86l0.11%2C0.47l-0.05%2C0.27l0.01%2C0.38l-0.36%2C-0.26l-0.08%2C-0.74l-0.66%2C0.12l-0.16%2C0.3l-0.77%2C0.33l-0.26%2C0.25l-0.39%2C0.59l0.27%2C0.45l-0.62%2C0.68l-0.62%2C0.03l-0.45%2C0.7l0.42%2C0.42l1.28%2C0.53l0.95%2C0.64l-0.3%2C1.24l-0.37%2C0.22l-0.2%2C-0.07l0.41%2C-0.94l-0.34%2C-0.48l-0.99%2C-0.19l-0.63%2C0.06l-0.84%2C0.17l-0.81%2C-0.18l-0.37%2C0.2l-0.09%2C0.99l0.51%2C0.43l0.19%2C1.03l0.07%2C0.44l-0.42%2C-0.03l-0.59%2C-0.36l-0.22%2C0.22l-0.38%2C0.29l-0.63%2C0.73l-0.2%2C0.27l-0.03%2C0.29l0.55%2C0.58l1.21%2C0.46l0.6%2C-0.19l0.73%2C-0.49l0.05%2C0.67l-0.52%2C0.03l-1.31%2C0.9l-0.31%2C0.33l-0.56%2C0.5l-0.2%2C-0.13l0.17%2C-0.61l-1.28%2C-1.14l-0.39%2C-0.11l-0.78%2C0.35l-0.09%2C0.39l0.27%2C0.47l-0.35%2C0.33l0.42%2C0.79l0.86%2C0.49l-0.23%2C0.48l-0.93%2C0.78l-0.56%2C0.54l-0.09%2C0.28l0.19%2C0.31l0.38%2C0.24l0.63%2C0.49l-0.01%2C0.39l-1.06%2C-0.67l-0.19%2C0.03l-0.07%2C0.28l0.11%2C0.58l-0.48%2C0.37l-0.52%2C0.9l0.01%2C0.68l0.43%2C-0.5l0.51%2C-0.01l0.71%2C-0.48l0.2%2C-0.09l0.34%2C-0.08l0.63%2C0.02l0.79%2C-0.23l0.07%2C0.32l-0.99%2C0.89l-0.58%2C0.37l-0.69%2C0.17l-0.44%2C0.4l-0.88%2C0.43l-0.18%2C0.22l-0.13%2C0.51l0.6%2C0.31l0.65%2C-0.42l0.18%2C-0.22l0.12%2C-0.3l0.77%2C-0.2l1.18%2C-0.5l0.33%2C-0.39l2.07%2C-1.16l0.09%2C0.51l-0.08%2C0.77l0.27%2C0.7l0.32%2C0.37l0.44%2C0.31l0.02%2C0.18l-0.77%2C0.07l-0.67%2C-1.47l-0.28%2C-0.38l-0.38%2C0.26l-1.09%2C0.73l-1.63%2C0.59l-1.15%2C1.01l-1.12%2C0.94l-0.23%2C-0.38l0.44%2C-0.78l-0.6%2C-0.09l-0.59%2C0.19l-0.66%2C0.3l-0.85%2C0.83l0.48%2C0.49l0.1%2C0.34l-0.37%2C0.18l-0.4%2C0.58l-0.34%2C0.55l-1.09%2C0.26l-1.11%2C-0.05l0.49%2C-0.38l1.15%2C-0.2l0.46%2C-0.33l0.34%2C-0.79l-0.1%2C-0.34l-1.29%2C-0.02l-1.27%2C0.9l-0.85%2C0.66l-0.61%2C0.37l-0.55%2C0.75l0.57%2C-0.19l0.41%2C0.25l-0.25%2C0.28l-0.77%2C0.38l-0.77%2C0.85l-0.4%2C0.71l0.75%2C0.56l0.36%2C0.13l2.51%2C-0.25l0.99%2C-0.37l0.82%2C0.04l0.21%2C0.24l-3.02%2C1.15l-2.06%2C0.64l-0.59%2C0.41l-0.23%2C0.15l-0.45%2C0.34l0.22%2C0.2L115.87%2C520.38zM123.33%2C504.17l0.23%2C0.22l-0.39%2C0.84l0.31%2C0.43l0.4%2C0.08l0.72%2C-0.47l0.29%2C-0.13l-0.03%2C-0.54l-0.1%2C-0.45l-0.3%2C-0.44l-0.28%2C-0.49l-0.34%2C-0.47l-0.38%2C0.01l-0.11%2C0.16l0.19%2C0.46l-0.16%2C0.32l-0.45%2C-0.31l-0.35%2C0.17l-0.13%2C0.45l0.16%2C0.29L123.33%2C504.17zM124.68%2C502.8l0.17%2C0.26l0.69%2C0.51l0.58%2C-0.2l0.47%2C-0.45l0.64%2C-0.16l-1.48%2C-1.64l-1.02%2C0.5l-0.22%2C0.42l0.06%2C0.4L124.68%2C502.8zM97.45%2C532.7l1.12%2C-0.48l0.87%2C0.17l0.36%2C0.21l0.83%2C-0.28l0.82%2C-0.5l0.82%2C-0.25l0.35%2C-0.21l1%2C-0.34l1.29%2C-0.47l1.13%2C-0.71l0.73%2C-0.82l0.76%2C-0.52l0.19%2C-0.29l-0.01%2C-0.39l-0.32%2C-0.28l-0.35%2C0.16l-0.33%2C0.32l-0.1%2C-0.63l0%2C-0.27l-0.54%2C-0.5l-0.47%2C-0.32l-0.32%2C-0.24l-0.99%2C-0.04l-0.66%2C0.18l-0.23%2C0.8l-0.68%2C0.23l-0.14%2C-0.16l0.33%2C-0.87l-0.01%2C-0.73l-0.06%2C-0.87l0.25%2C-0.4l-0.03%2C-0.67l-1.25%2C-0.04l-0.74%2C0.35l-0.45%2C0.03l-0.09%2C0.63l-0.08%2C0.79l0%2C0.54l-0.12%2C0.17l-0.31%2C0.22l-0.44%2C-0.75l0.29%2C-0.92l-0.01%2C-0.56l-2.15%2C0.54l-1.67%2C0.43l-0.79%2C0.13l-0.34%2C0.16l-0.09%2C0.35l-0.43%2C-0.18l-0.78%2C0.25l-0.99%2C0.93l0.89%2C0.14l1.04%2C0.64l0.57%2C0.38l-0.33%2C0.15l-1.86%2C0.9l-0.32%2C-0.28l-1.85%2C0.01l-0.52%2C0.22l-0.83%2C0.35l-1.11%2C1.14l-1.04%2C1.21L87%2C531.93l-0.08%2C0.52l0.43%2C1.32l0.98%2C0.7l0.42%2C0.5l0.58%2C0.14l0.9%2C0l0.6%2C0.08l1.38%2C-0.07l0.62%2C-0.46l0.83%2C-0.79l0.39%2C-0.31l0.44%2C-0.27l0.32%2C-0.15l1.3%2C-0.22L97.45%2C532.7zM173.74%2C561.8l3.28%2C-4.93l-3.83%2C-9.33l0%2C0l-7.88%2C0.35l-1.89%2C-0.05l-3.95%2C-7.41l-3.07%2C-0.82l-2.72%2C-0.33l-0.44%2C-0.01l-0.78%2C0.34l-1.69%2C-0.14l-1.77%2C0.35l-0.75%2C0.33l-0.3%2C-0.06l-0.84%2C-0.71l-0.5%2C-0.46l-0.29%2C-0.21l-0.7%2C-0.01l0.28%2C-1.35l-0.28%2C-1.71l0.25%2C-0.76l-0.15%2C-0.35l0%2C0l-0.2%2C0.19l-0.87%2C0.04l-0.12%2C0.42l0.14%2C0.53l-0.35%2C0.15l-0.17%2C-0.02l-0.41%2C-0.89l-0.94%2C-0.21l-1.08%2C-0.14l-0.9%2C-0.27l-0.84%2C0.01l-1.05%2C0.58l-0.82%2C0.1l-0.78%2C-0.61l-0.56%2C-0.62l-0.27%2C-0.23l-0.68%2C0.53l-0.2%2C0.42l-1.12%2C0.33l-0.29%2C-0.11l-0.09%2C-0.5l-0.18%2C-0.15l-0.85%2C-0.4l-1.68%2C0l-1.01%2C0.21l-0.56%2C0.56l-1.09%2C0.76l-0.67%2C0.55l-0.45%2C0.54l-0.23%2C0.84l0.34%2C0.78l1.07%2C1.02l0.68%2C0.33l0.51%2C0.11l0.56%2C-0.02l0.8%2C-0.06l-0.5%2C1.1l-0.63%2C0.52l-0.36%2C0.07l-0.53%2C-0.55l-0.77%2C-0.31l-0.74%2C0.05l-0.34%2C-0.89l-0.34%2C-0.26l-0.83%2C0.08l-0.9%2C-0.14l-2.75%2C1.87l-0.43%2C0.46l-0.2%2C-0.43l-0.1%2C-0.35l2.04%2C-1.53l0.81%2C-1.21l0.84%2C-3.59l-1.12%2C-0.6l-0.58%2C-0.79l-0.9%2C-0.68l-0.36%2C-0.94l-1%2C-0.72l0.39%2C-0.47l0.15%2C-0.3l0.05%2C-0.49l-0.43%2C-0.76l-0.69%2C-1.12l-0.52%2C-0.76l-0.18%2C-0.64l-0.25%2C-0.56l-0.05%2C-0.4l0.14%2C-1.27l-1.46%2C0.56l-1.91%2C0.74l-0.81%2C0.76l-0.92%2C0.42l0.04%2C0.42l-0.84%2C0.64l0.14%2C0.16l0.5%2C-0.31l0.58%2C-0.11l0.52%2C0.18l-0.28%2C0.5l-0.13%2C0.09l-1.09%2C0.21l-0.49%2C0.11l-0.48%2C0.04l-0.15%2C0.2l0%2C0.21l-0.2%2C0.45l-0.22%2C0.37l-0.15%2C0.4l-0.3%2C1.24l-0.42%2C0.07l-0.2%2C-0.43l0.01%2C-0.34l0.1%2C-0.74l0.03%2C-0.74l-0.12%2C-0.55l-0.6%2C0.29l-0.44%2C0.45l-0.6%2C0.92l-0.56%2C-0.01l-1.12%2C0.24l-0.6%2C0.3l-0.48%2C0.79l-0.62%2C0.49l-0.5%2C0.17l-0.07%2C0.15l0.54%2C0.25l-0.08%2C0.61l0.21%2C0.52l0.24%2C0.03l0.3%2C0.13l0.58%2C0.38l0.19%2C0.1l0.36%2C-0.01l0.49%2C-0.29l1.4%2C-0.13l1.53%2C-0.45l0.65%2C-0.23l0.65%2C-0.32l0.91%2C0.38l-0.22%2C0.17l-1.08%2C0.22l-0.91%2C0.38l-0.69%2C0.3l-1%2C0.08l-1.5%2C0.56l-0.48%2C-0.07l-0.45%2C0.04l-0.61%2C0.3l-0.21%2C0.44l-0.11%2C0.31l0.05%2C0.38l0.79%2C1.22l0.2%2C0.08l0.19%2C0.53l0.29%2C0.23l0.96%2C-0.08l0.99%2C-0.15l0.88%2C-0.08l1.02%2C-0.28l0.71%2C-0.26l1.06%2C-0.67l0.33%2C0.07l-0.4%2C0.44l-1.36%2C0.79l-1.39%2C0.46l-0.94%2C0.02l-0.37%2C0l-0.52%2C0.26l-0.39%2C0.47l-0.61%2C0.04l0.06%2C0.77l-0.19%2C0.13l-0.26%2C-0.33l-0.46%2C-0.17l-0.51%2C0.78l-0.88%2C0.35l-0.24%2C0.85l-0.61%2C0.77l-0.22%2C-0.04l-0.12%2C-0.81l-0.06%2C-0.35l0.65%2C-1.17l0.07%2C-0.82l0.4%2C-0.64l0.99%2C-0.63l-0.21%2C-0.26l-0.51%2C0.13l-0.06%2C-0.47l0.19%2C-0.56l-0.13%2C-0.45l-0.28%2C-0.72l-0.53%2C-0.45l-0.59%2C-0.06l0.14%2C-0.7L104.5%2C534l-0.78%2C0.06l-0.13%2C-0.86l-0.51%2C-0.05l-0.15%2C0.24l-0.44%2C1.08l0.97%2C1.21l0.19%2C0.18l-1.39%2C0.35l-0.43%2C-0.62l-0.14%2C-0.37l-0.49%2C0.25l-0.11%2C0.27l-0.47%2C0.05l-0.34%2C-0.21l-0.27%2C-0.41l-1.01%2C-0.17l-0.8%2C0.04l-0.78%2C0.2l0%2C0l0.25%2C0.57l0.8%2C0.66l0.13%2C1.73l0.61%2C0.1l0.36%2C0.29l0.5%2C-0.12l0.5%2C0.29l0.1%2C0.34l-0.65%2C1.03l-0.1%2C1.63l-0.28%2C0.78l-0.79%2C1.33l0.94%2C1.88l-0.03%2C0.4l-0.6%2C0.75l-1.6%2C0.46l-0.07%2C0.34l0.01%2C0.29l1.58%2C1.19l-0.34%2C1.09l1.61%2C0.54l0.42%2C-0.27l0.32%2C0.1l0.25%2C-0.12l0.86%2C-0.67l1.74%2C-0.39l1.44%2C0.95l1.76%2C-0.1l0.53%2C-0.29l-1.21%2C-1.92l1.05%2C-0.75l0.96%2C-1l0.34%2C0.04l0.13%2C0.32l0.76%2C0.07l0.38%2C0.24l1.3%2C-1.06l0.4%2C1.23l0.66%2C0.36l1.35%2C0.38l-0.26%2C0.81l0.17%2C1.05l-0.53%2C2.28l0.01%2C1.47l-0.2%2C0.68l0.12%2C0.36l1.09%2C0.2l-0.08%2C0.69l0.3%2C0.01l0.34%2C0.57l1.69%2C0.16l-0.01%2C0.18l-2.21%2C1.08l-0.29%2C0.85l-0.9%2C1.03l-0.13%2C1.38l0.54%2C1.61l0.2%2C2.35l-1.06%2C1.81l-1.18%2C0.74l-5.48%2C2.01l-1.05%2C-0.03l-0.96%2C0.53l-0.85%2C0.08l-2.08%2C1.32l0.18%2C0.54l1.34%2C2.09l0.78%2C-0.08l0.97%2C1.34l0.48%2C0.32l0.83%2C0.17l0.17%2C1.38l0.91%2C1.22l0.93%2C-0.13l0.78%2C1.76l-0.12%2C1.07l-0.29%2C-0.02l-0.1%2C0.19l0.12%2C0.72l-0.59%2C2.21l0.29%2C0.62l-1.12%2C2.44l-2.21%2C1.12l0%2C0l2.7%2C1.26l3.72%2C1.26l3.37%2C1.37l0.72%2C0.75l2.08%2C1.15l2.84%2C-1.26l1.67%2C-0.21l0%2C0l0.49%2C-0.44l0.46%2C-0.83l-0.06%2C-0.45l-0.25%2C-0.07l-0.05%2C-0.33l0.09%2C-0.16l0.4%2C-0.07l0.02%2C-0.19l-0.5%2C-0.26l0.38%2C-0.85l1.3%2C0.82l0.2%2C-0.06l0.67%2C-0.43l0.4%2C-1.11l-0.04%2C-0.91l3.27%2C-1.6l-0.48%2C-2.66l-1.05%2C-3.96l0.39%2C-0.41l-0.21%2C-1.04l0.32%2C-0.12l0.34%2C-0.6h0.44l0.24%2C-1.11l0.9%2C-2.19l0.34%2C-0.21l0.13%2C-0.67l0.39%2C-0.03l-0.08%2C-0.33l0.46%2C-0.36l0.43%2C0.84l2.54%2C-0.43l2.17%2C0.4l3.95%2C1.09l0.64%2C-0.1l0.85%2C-0.62l0.78%2C0.02l0.89%2C0.5l0.01%2C0.84l0.54%2C0.25l1.22%2C-1.56l3.13%2C-0.8l2.89%2C1.46l1.67%2C0.17l0.12%2C0.54l0.51%2C0.14l0.11%2C1.75l0.61%2C0.96l0.15%2C1.2l0.53%2C-0.04l0.49%2C0.32l0.19%2C1.6l0.98%2C0.23l0.11%2C0.21l1.08%2C0.6l0.66%2C0.86l1.6%2C1.03l1.05%2C1.86l0.21%2C1.13l0.65%2C1.22l0.69%2C0.86l2.66%2C-0.55l0.55%2C1.72l0.64%2C-0.04l0.1%2C-0.54l0.37%2C-0.08l0.31%2C-0.67l0.49%2C-0.19l4.76%2C0.85l1.9%2C0.74l0.66%2C0.96l0.87%2C0.69l1.05%2C-0.23l0.33%2C-0.39l0.36%2C-0.13l0.32%2C0.09l0.72%2C-0.15l0%2C0l-4.6%2C-13.97l1.85%2C-6.86L173.74%2C561.8zM99.78%2C517.98l0.33%2C-0.01l0.26%2C-0.08l0.32%2C-0.65l-0.11%2C-0.34l-0.26%2C-0.08l-0.47%2C0.19l-0.43%2C0.17l-0.28%2C0.55l0.16%2C0.14L99.78%2C517.98zM99.49%2C520.09l-0.04%2C0.47l-0.18%2C0.47l-0.54%2C0.45l-0.34%2C0.19l-0.73%2C0.13l-0.9%2C-0.01l-0.77%2C0.28l-0.56%2C0.07l-1.62%2C0.4l-1.93%2C0.41l-1.06%2C0.11l0%2C-0.45l-0.3%2C-0.08l-0.34%2C-0.01l-0.56%2C-0.44l-0.63%2C0.25l-0.55%2C0.6l-0.95%2C0.11l-0.96%2C0.05l0.04%2C-0.77l0.17%2C-0.35l1.17%2C-0.29l1.55%2C-0.28l1.12%2C-0.39h0.45l0.68%2C-0.29l1.23%2C-0.22l0.4%2C-0.57l1.01%2C-0.42l0.17%2C-0.33l0.52%2C-0.55l0.51%2C-0.7l0.41%2C-1.1l0.77%2C-0.84l0.67%2C-0.53l0.25%2C0.08l0.25%2C0.11l1.14%2C0.19l-0.17%2C1.08l0.07%2C0.84l0.02%2C0.1l0.38%2C0.45l0.09%2C0.94L99.49%2C520.09zM92.43%2C526.89l-0.36%2C0.23l-0.46%2C0.84l1.16%2C0.28l1.56%2C-0.66l-0.9%2C-0.6l-0.5%2C-0.02L92.43%2C526.89z%22%2F%3E%0A%09%09%3Cpath%20fill%3D%22white%22%20stroke%3D%22none%22%20id%3D%22NO-08%22%20title%3D%22Telemark%22%20%20d%3D%22M72.14%2C694.9l2.8%2C0.58l0.79%2C0.53l2.49%2C-1.42l1.42%2C-0.59l2.03%2C-0.36l1.03%2C-1.11l1.03%2C-0.26l1.53%2C0.02l0.51%2C0.3l0.83%2C0.19l2.46%2C-0.07l1.56%2C0.61l2.13%2C-0.45l1.07%2C-0.03l1.52%2C0.29l2.15%2C0.12l0.58%2C0.24l2.97%2C2.09l1.04%2C0.97l0.52%2C1.48l0.25%2C2.5l0.46%2C0.75l-0.73%2C0.16l0.42%2C0.6l0.84%2C-0.19l0.68%2C1.16l0.97%2C0.03l0.64%2C0.71l0.81%2C0.5l0.44%2C0.59l-0.42%2C0.87l0.45%2C0.4l-0.25%2C1.27l0.2%2C1.73l1.82%2C1.03l1.1%2C0.24l1.07%2C0.7l-0.47%2C2.83l0.3%2C0.34l-0.35%2C0.89l1.64%2C0.53l-0.04%2C0.94l1.47%2C4.75l1.03%2C0.9l-0.05%2C0.38l-0.79%2C1.21l-0.13%2C0.84l1.76%2C-0.2l0.37%2C0.15l0.36%2C0.5l0.24%2C1.1l0.63%2C0.46l0.2%2C0.61l0.78%2C0.58l0.54%2C0.1l0.68%2C-0.17l1.44%2C0.01l0%2C0l-0.19%2C1.85l0.17%2C1.04l-0.51%2C1.12l2.59%2C3.34l-0.01%2C0.57l0.28%2C0.6l-0.54%2C0.36l0.57%2C0.96l0.2%2C0.73l-0.14%2C0.36l-0.49%2C0.09l-0.6%2C0.49l-0.18%2C1.55l0.49%2C0.65l0.2%2C0.89l-0.1%2C0.58l-0.25%2C0.13l-0.11%2C1.19l-0.48%2C0.07l0.08%2C0.47l0%2C0l-0.37%2C-0.23l-0.15%2C-0.57l-0.17%2C-1.04l-0.43%2C0.82l0.11%2C0.3l-0.1%2C0.3l-0.3%2C-0.23l-0.34%2C-1.03l-0.68%2C-0.05l-0.18%2C-0.96l0.17%2C-0.63l-0.31%2C-0.01l-0.22%2C0.68l-0.08%2C0.71l0.15%2C0.42l0.14%2C0.44l-0.3%2C0.25l-0.52%2C-0.2l-0.31%2C-0.39l-0.27%2C-0.77l0.16%2C-0.94l-0.68%2C-0.71l-0.36%2C-0.27l-0.56%2C0.02l-0.44%2C0.23l-0.16%2C0.38l0.65%2C0.26l0.99%2C0.96l0.05%2C0.92l0.53%2C0.7l1.31%2C0.26l0.93%2C1.05l0.2%2C1.08l-0.09%2C0.24l-0.55%2C-0.11l-0.17%2C0.24l-0.07%2C0.32v0.35l-0.26%2C0.32l-0.61%2C-0.14l-0.18%2C0.14l-0.75%2C0.43l-0.05%2C0.37l0.05%2C0.44l-1.07%2C0.54l-0.58%2C-0.32l-0.95%2C0.15l-0.53%2C0.3l-0.43%2C0.28l-0.02%2C0.59l-0.28%2C0.75l-0.34%2C-0.55l-0.16%2C-0.31l-0.43%2C0.09l-0.05%2C1.18l-0.2%2C0.51l-1.08%2C0.04l-0.83%2C-0.2l-0.48%2C-0.57l-0.11%2C0.86l-0.21%2C0.44l-0.12%2C0.56l0.59%2C0.06l0.29%2C0.03l0.63%2C-0.36l1.01%2C-0.27l1.04%2C0.19l0.57%2C0.47l0%2C0.39l-0.69%2C0.71l0.02%2C0.41l-0.76%2C0.58l-0.41%2C0.61l-0.38%2C0.15l0%2C0l-0.88%2C-0.55l-0.51%2C0.54l-0.81%2C-1.03l-0.77%2C-0.01l-0.97%2C-0.3l-0.16%2C-0.57l-0.04%2C-1.17l-0.43%2C-1.41l-0.36%2C-0.44l-1.83%2C-1.11l-0.84%2C-0.79l-0.29%2C-0.36l-0.9%2C-2.58l-1.42%2C0.25l-2.36%2C-0.08l-0.14%2C0.65l-1.73%2C1.39l0.29%2C0.38l1.5%2C0.92l-1.08%2C2.02l0.4%2C0.22l-0.31%2C0.89l-0.87%2C0.47l-0.61%2C-0.83l-1.29%2C-0.93l-1.06%2C-1.71l-0.47%2C-0.28l-0.44%2C-0.6l-1.59%2C0.99l-0.72%2C1.09l-1.24%2C-0.88l-0.41%2C-0.69l-1.91%2C0.07l-2.5%2C-2.37l-2.04%2C-0.45l-0.92%2C0.41l-0.02%2C0.2l0.33%2C0.19l0.86%2C0.09l-0.78%2C0.5l-0.58%2C0.15l-0.56%2C-0.09l-0.99%2C-0.52l-0.64%2C-0.06l-0.93%2C-1.74l-0.48%2C-0.29l-1.31%2C-2.85l-0.58%2C-0.71l-0.69%2C-1.38l-1.26%2C-1.09l-0.23%2C-0.4l-0.17%2C-0.58l0.31%2C-1.43l0.26%2C-0.59l0.48%2C-0.17l0.06%2C-0.26l-0.32%2C-0.26l-0.82%2C-1.67l-0.58%2C-2.36l-0.38%2C-0.56l-0.49%2C-0.32l-1.17%2C-0.22l-0.29%2C-0.19l-1.85%2C-2.56l0.04%2C-0.31l2.84%2C-0.15L71%2C724l-0.11%2C-0.21l-1.34%2C-0.82l-0.08%2C-0.22l-0.4%2C-1.45l0.77%2C-1.19l-0.34%2C-0.81l-0.18%2C0.05l-1.07%2C-1.07l-0.06%2C-0.63l-0.45%2C-0.35l-0.24%2C-0.5l-0.69%2C0.06l-0.41%2C-0.25l-0.57%2C1.2l-0.85%2C-0.45l-0.3%2C0.16l-0.15%2C-0.34l-0.86%2C-0.73l-0.27%2C0.23l-1.42%2C-0.36l0%2C0l-0.31%2C-0.59l-1.19%2C-0.35l-0.63%2C-0.43l0.05%2C-2.44l-0.39%2C-1.29l0%2C0l1.1%2C-1.41l-0.02%2C-0.33l0.36%2C-0.51l-0.4%2C-1.19l0.43%2C-0.67l-0.31%2C-0.38l0.39%2C-1.12l-0.52%2C-0.12l1.57%2C-3.04l1.39%2C-1.32l1.09%2C-0.26l1.35%2C-0.06l0.86%2C-0.65l0.2%2C-0.34l-0.03%2C-0.76l0.28%2C-1.34l1.11%2C-1.26L72.14%2C694.9z%22%2F%3E%0A%09%09%3Cpath%20fill%3D%22white%22%20stroke%3D%22none%22%20id%3D%22NO-19%22%20title%3D%22Troms%22%20%20d%3D%22M266.84%2C231.69l0.46%2C0.14l0.46%2C0.42l0.2%2C0.52l-0.26%2C0.08l-1.58%2C-0.68l-0.76%2C-1.1l0.2%2C-0.98l0.49%2C0.88L266.84%2C231.69zM287.84%2C225.3l0.24%2C0.7l-0.14%2C0.28l0.23%2C0.42l-0.08%2C0.2l0.18%2C-0.04l-0.1%2C0.16l0.35%2C-0.11l0.12%2C0.19l0.24%2C0.5l-0.03%2C0.62l0.28%2C0.62l0.43%2C0.53l0.34%2C0.06l0.44%2C0.64l0.23%2C0.11l0.45%2C-0.28l0.09%2C1.27l-0.22%2C0.6l-0.51%2C0.4l-0.3%2C0.51l-0.45%2C0.15l-1.09%2C0.25l-0.5%2C-0.08l-1.3%2C0.18l-2.44%2C1.01l-1.35%2C-0.08l-0.09%2C-0.14l0.44%2C-0.4l0.03%2C-0.61l0.32%2C-0.53l0.05%2C-1.04l0.57%2C-0.39l0.77%2C-0.01l0.11%2C-1.09l0.65%2C-1.44l0%2C-0.53l1.02%2C-1.71l0.25%2C-0.16l0.11%2C-0.41l0.32%2C-0.36L287.84%2C225.3zM264.03%2C226.71l-1.1%2C1.23l0.29%2C-0.7l-0.07%2C-0.79l0.15%2C-0.26l1.37%2C-1.13l0.12%2C0.41l-0.11%2C0.46L264.03%2C226.71zM292.8%2C221.25l0.38%2C0.26l0.39%2C-0.08l0.81%2C0.22h1l1.31%2C2.14l0.96%2C0.33l0.41%2C0.57l-0.8%2C1.39l-0.81%2C0.51l-1.93%2C1.92l-1.32%2C1.07l-1.14%2C0.31l-1.01%2C-0.77l-0.22%2C-1.2l0.27%2C-0.44l-0.31%2C-1.21l-0.57%2C-1l-0.2%2C-0.02l-0.24%2C-1.39l-0.67%2C-1.17l0.44%2C-0.42l-0.06%2C-0.73l0.15%2C-0.26l0.69%2C0.49l0.36%2C0.04l0.48%2C0.37l-0.23%2C0.14l-0.05%2C0.41l1.32%2C2.09l0.83%2C0.73l0.4%2C0.22l0.47%2C0.01l-0.12%2C-0.31l-0.71%2C-0.39l-0.76%2C-0.81l-1.07%2C-1.96l0.16%2C-0.59l0.22%2C-0.22l0.87%2C-0.36L292.8%2C221.25zM261.58%2C228.09l-0.45%2C2.46l-1.3%2C1.45l-0.19%2C0.84l-1.07%2C0.69l0.07%2C0.1l0.69%2C-0.18l0.57%2C-0.3l0.35%2C-0.36l-0.05%2C-0.32l1.02%2C-1.01l0.91%2C-0.3l0.72%2C-1.55l0.84%2C0.34l0.18%2C0.16l0.29%2C0.85l-0.25%2C2.7l-0.28%2C1.32l-1.02%2C1.87l-1.28%2C1.43l-0.85%2C0.56l-1.38%2C0.98l-0.38%2C0.54l-0.24%2C0.77l0.59%2C0.89l0.06%2C1.45l0.2%2C0.8l-0.67%2C0.51l-0.49%2C-0.16l-0.12%2C0.22l-0.55%2C1.21l0.06%2C0.3l0.47%2C-0.05l0.42%2C-0.92l0.8%2C-0.5l0.33%2C-0.19l0.25%2C-0.42l-0.11%2C-2.26l-0.31%2C-1.05l0.63%2C-0.34l0.56%2C-0.62l0.65%2C-0.43l0.8%2C-0.46l1.54%2C-1.63l0.49%2C-0.15l0.48%2C0.32l0.51%2C0.27l0.35%2C1.02l-0.13%2C0.78l0.1%2C0.18l0.54%2C-0.16l0.09%2C-0.61l-0.06%2C-0.31l-0.19%2C-1.02l-0.33%2C-0.45l-0.77%2C-0.23l-0.22%2C-0.62l0.56%2C-0.83l0.04%2C-2l0.56%2C-0.91l0.31%2C-0.03l0.63%2C0.46l1.3%2C0.42l1.69%2C-0.19l0.47%2C0.92l0.54%2C0.68l0.29%2C-0.08l-0.17%2C-0.73l-0.36%2C-0.47l-0.15%2C-0.56l-0.56%2C-0.96l-0.77%2C-0.53l-1.08%2C-0.4l-0.88%2C-0.69l-0.26%2C-0.34l-0.71%2C-2.22l0.15%2C-0.3l0.31%2C-0.02l0.3%2C-1l1.11%2C-0.52l0.34%2C-0.65l0.35%2C-0.3l1.22%2C0.15l0.39%2C0.19l0.33%2C0.52l0.34%2C1.14l0.39%2C0.25l0.65%2C-0.12l-0.91%2C-2.89l-0.9%2C-0.65l-0.35%2C-0.04l-0.14%2C-0.69l0.12%2C-0.94l0.22%2C-0.32l0.2%2C-0.11l0.14%2C0.03l0.13%2C0.77l0.65%2C1.19l0.94%2C0.59l1.3%2C1.38l0.8%2C0.46l0.83%2C-0.41l0.34%2C0.29l0.17%2C0.95l-0.14%2C1.06l0.74%2C0.11l0.48%2C-0.17l0.05%2C-0.55l0.4%2C-0.38l0.75%2C0.09l-0.04%2C0.67l-0.66%2C0.3l-0.51%2C0.8l0.16%2C0.22l0.33%2C0.53l0.49%2C-0.04l0.27%2C0.03l0.15%2C0.03l-0.16%2C0.64l-0.18%2C0.76l-0.21%2C0.25l-0.32%2C-0.13l-0.12%2C0.22l0.32%2C0.82l-0.3%2C0.61l0.49%2C0.69l-0.99%2C1.11l0.33%2C0.11l0.43%2C-0.16l0.53%2C0.08l-0.37%2C1.21l-0.75%2C0.73l-0.13%2C0.21l0.42%2C0.18l0.63%2C0.35l0.42%2C0.29l-0.53%2C0.63l0.13%2C1.07l-0.45%2C0.57l-0.77%2C1.45l-0.48%2C0.02l-0.35%2C0.29l0.03%2C0.75l0.02%2C0.89l0.29%2C0.28l0.02%2C0.3l-0.55%2C0.49l-0.73%2C0.43l-0.07%2C-0.23l0.23%2C-0.46l-1.3%2C-0.78l-0.94%2C-0.35l-0.78%2C-0.5l-0.47%2C-0.7l-0.91%2C-0.41l0.12%2C-0.48l-0.36%2C-0.65l-1.13%2C0.31l-0.6%2C0.54l-0.78%2C-0.06l-0.48%2C0.65l-1.18%2C0.3l-1.01%2C1.53l-0.35%2C-0.03l-0.43%2C-0.35l-0.26%2C-1.04l-0.33%2C-0.08l-0.41%2C-0.87l-0.97%2C1.19l0.08%2C0.82l-0.83%2C1.46l-0.06%2C1.48l-1.44%2C0.15l-1.49%2C2.23L257.9%2C249l-0.81%2C0.41l-0.45%2C0.82l-0.34%2C1.13l-0.76%2C0.37l-0.32%2C-0.49l0.04%2C-0.36l0.95%2C-1.39l0.06%2C-0.34l-0.24%2C-0.58l0.14%2C-0.43l-0.11%2C-0.41l-0.35%2C-0.35l0%2C-0.45l-0.5%2C-0.43l-0.35%2C-2.42l0.06%2C-0.28l0.75%2C-0.14l0.42%2C-0.36l0.23%2C-0.59l0.05%2C-0.36l-0.26%2C-0.68l0.15%2C-0.35l-0.53%2C-0.73v-0.5l0.94%2C-0.35l0.62%2C-0.55l0.65%2C0.39l0.27%2C-0.01l0.27%2C-0.21l0.82%2C-1.68l-0.38%2C-1.21l0.23%2C-0.4l-0.01%2C-0.36l-0.26%2C-0.35l-1.69%2C-0.4l-0.13%2C-0.35l0.06%2C-1.17l0.4%2C-1.34l0.71%2C-0.92l0.81%2C-1.09l-0.4%2C-0.79l0.67%2C-1.01l0.5%2C-0.7l0.35%2C-1.24l-0.45%2C-0.8l0.59%2C-0.8l0.24%2C-1.18l-0.45%2C-1.85l0.04%2C-0.68l0.32%2C-0.84l1.25%2C-1.11l0.27%2C0.53l-0.17%2C1.15l0.15%2C1.37l0.31%2C0.63l0.65%2C0.49l0.07%2C0.45l-0.46%2C1.28l-0.27%2C0.31L261.58%2C228.09zM280.07%2C218.45l0.46%2C0.14l-0.14%2C0.26l0.11%2C0.18l0.39%2C-0.12l0.21%2C0.25l0.45%2C0.17l-1.44%2C1.47l-0.68%2C0.49l-0.22%2C-0.22l0.19%2C-0.59l-0.49%2C-0.15l0.09%2C-0.31l0.06%2C-0.55l0.51%2C-0.29l0.05%2C-0.5L280.07%2C218.45zM271.76%2C217.63l0.26%2C0.09l0.4%2C-0.26l0.28%2C0.13l1.35%2C1.6l1.05%2C0.15l0.04%2C-0.27l0.48%2C-0.05l0.15%2C0.41l0.85%2C0.8l0.39%2C0.14l0.19%2C-0.13l-0.34%2C-1.11l0.17%2C-0.3l0.5%2C-0.2l0.21%2C0.08l0.27%2C0.36l0.15%2C0.24l-0.21%2C1.02l0.48%2C0.33l0.36%2C0.27l-0.2%2C0.51l-0.46%2C0.45l0.02%2C1.15l0.56%2C0.01l-0.03%2C0.41l-1.78%2C1.33l-1.5%2C-0.48l-1.48%2C-0.44l-0.24%2C-0.21l-0.08%2C-0.38l-1.25%2C-1.15l-0.36%2C-0.64l-0.14%2C-0.85l-0.94%2C-0.7l-1.16%2C-0.36l0.27%2C-1.34l0.47%2C-0.81l0.43%2C-0.27L271.76%2C217.63zM275.95%2C215.36l0.51%2C0.08l0.08%2C0.22l-0.39%2C0.56l0.04%2C0.42l0.2%2C0.22l0.49%2C-0.1l0.26%2C0.11l0.16%2C0.27l-0.07%2C0.67l-0.39%2C0.26l-0.23%2C-0.43l-0.57%2C-0.24l-0.91%2C0.16l-0.35%2C0.45l-0.54%2C-0.45l-0.18%2C-0.38l0.19%2C-0.61l0.52%2C-0.9l0.67%2C-0.31L275.95%2C215.36zM300.33%2C210.88l-0.37%2C0.33l-0.54%2C0.18l0.12%2C0.84l-0.02%2C0.33l-0.41%2C0.73l-0.45%2C0.92l-0.67%2C0.08l-0.48%2C0.36l-1.12%2C2.44l-0.81%2C0.58l-0.55%2C-0.22l-0.26%2C-0.57l0.33%2C-1.04l-0.25%2C-1.12l0.54%2C-0.78l0.21%2C-1.02l0.63%2C-1.38l1.46%2C-0.44l0.88%2C0.08l1.75%2C-0.69L300.33%2C210.88zM298.1%2C177.67l0.34%2C0.14l0.14%2C0.51l0.56%2C0.57l0.44%2C0.78l0.61%2C0.33l0.11%2C0.55l0.3%2C0.98l0.25%2C0.65l0.21%2C0.07l0.22%2C0.5l-0.14%2C0.6l0.11%2C0.45l0.47%2C0.56l0.2%2C0.77l0.42%2C0.38l0.16%2C-0.26l-0.37%2C-0.65l-0.28%2C-1.24l1.12%2C0.27l0.23%2C-0.19l-0.09%2C-0.31l-0.62%2C-0.27l-0.18%2C-0.39l-0.35%2C-2.81l-0.84%2C-1.82l0.61%2C0.49l0.39%2C0.09l0.52%2C-0.46l0.22%2C0.61l0.33%2C0.3l0.02%2C0.57l0.39%2C0.97l0.42%2C0.37l0.37%2C0.78l0.41%2C0.68l0.19%2C-0.05l0.06%2C-0.32l-0.03%2C-1.16l0.57%2C-1.14l0.41%2C0.05l0.45%2C0.55l0.12%2C-0.05l-0.36%2C-1.02l0.24%2C-0.17l0.3%2C-0.01l0.38%2C0.27l0.2%2C0.7l0.04%2C0.5l0.37%2C0.12l0.27%2C0.87l-0.22%2C0.35l0.11%2C0.7l0.07%2C0.67l-0.41%2C0.48l0.08%2C0.39l-0.13%2C0.18l-0.59%2C0.22l-0.46%2C0.41l-0.13%2C0.84l0.3%2C0.66l-0.44%2C0.64l-0.43%2C-0.05l-0.21%2C0.22l0.19%2C0.16l0.29%2C0.22l0.29%2C0.44l0.28%2C-0.13l0.47%2C-0.08l0.19%2C-0.16l0.2%2C-0.86l0.08%2C-1.3l0.11%2C-0.71l0.22%2C-0.22l0.29%2C-0.01l0.37%2C-1.11l0.38%2C-0.35l1.01%2C0.56l1%2C1.25l0.51%2C0.22l-0.6%2C0.95l-0.61%2C0.4l-0.31%2C0.39l0.12%2C0.77l-0.37%2C0.74l-0.49%2C0.12l-0.39%2C1.12l0.36%2C1.05l0.65%2C0.07l0.14%2C-0.08l-0.28%2C-0.3l0.03%2C-0.39l0.64%2C-1.75l0.51%2C-0.13l0.12%2C0.05l-0.04%2C0.34l0.5%2C0.08l0.27%2C0.9l-0.28%2C0.51l-0.04%2C0.63l0.02%2C0.57l-0.03%2C0.53l-0.06%2C0.23l-0.15%2C0.93l0.11%2C0.57l0.26%2C0.06l0.26%2C-0.2l0.2%2C0.48l-0.23%2C0.07l-0.09%2C0.48l-0.79%2C-0.15l-1.34%2C0.62l-0.68%2C0.34l-0.51%2C-0.04l-0.49%2C0.98l0.22%2C0.58l-0.48%2C-0.18l-0.56%2C0.07l0.06%2C0.28l0.32%2C0.17l0.42%2C0.36l0.27%2C0.88l-0.39%2C0.32l-0.25%2C0.26l-0.03%2C0.73l0.66%2C-0.44l0.55%2C0.31l-0.16%2C0.89l0.4%2C0.02l0.16%2C0.23l-0.2%2C0.79l-0.6%2C0.55l-1.17%2C0.05l-0.36%2C-0.07l-0.21%2C0.38l0.66%2C0.6l0.92%2C0.21l-0.04%2C0.6l0.28%2C0.23l0.35%2C0.27l0.34%2C-0.06l0.41%2C-0.06l0.5%2C0.23l0.16%2C0.32l-1.12%2C0.96l-1.01%2C0.19l-0.79%2C0.49l-1.05%2C0.43l-0.47%2C0.05l-0.31%2C-0.24l-1.81%2C-0.47l-1.56%2C1.09l-1.04%2C0.36l-0.14%2C-0.18l0.1%2C-0.54l-0.18%2C-0.21l-0.36%2C0.07l-0.68%2C0.15l-0.76%2C0.21l-0.96%2C0.43l-0.15%2C-0.14l0.17%2C-0.46l0.44%2C-0.48l0.3%2C-0.06l0.29%2C-0.81l-0.87%2C0.19l-0.04%2C-0.3l1.22%2C-0.89L299%2C203.7l-0.87%2C-0.28l-0.65%2C0.33l-0.34%2C0.4l-0.16%2C0.92l-0.66%2C0.52l-0.22%2C0.79l-0.27%2C0.53l-0.8%2C0.85l-0.62%2C-0.08l-0.27%2C0.18l-0.03%2C0.23l0.26%2C0.33l-0.2%2C0.34l-1.11%2C0.69l-0.04%2C0.27l-0.82%2C1.09l-0.72%2C0.98l-0.21%2C0.6l-0.25%2C0.08l-0.3%2C0.53l-0.03%2C0.56l0.09%2C0.17l0.15%2C-0.06l0.39%2C-0.48l0.24%2C-0.04l0.39%2C0.14l-0.07%2C0.49l0.27%2C1.06l-0.21%2C0.32l-0.36%2C0.16l-0.29%2C-0.23l-1.07%2C0.77l-0.61%2C-0.03l-1.49%2C0.41l-0.37%2C-0.14l-0.13%2C-0.32l0.4%2C-0.86l-0.12%2C-0.4l-0.41%2C-0.19l0%2C-0.17l0.49%2C-0.17l0.18%2C0.31l1.15%2C-0.5l-0.43%2C-0.44l-0.44%2C0.01l-0.11%2C0.4l-0.59%2C-0.1l-0.14%2C-0.18v-0.12l0.33%2C-0.31l0.54%2C0.02l0.33%2C-0.17l0.33%2C-0.49l0.16%2C-0.04l0.53%2C-0.32l0.47%2C-0.18l0.28%2C-0.52l-0.66%2C0.01l-1.05%2C0.48l-0.73%2C0.13l-0.33%2C0.08l-0.43%2C0.06l-0.18%2C-0.23l-0.56%2C-0.26l-0.59%2C0.18l-0.59%2C0.91l-0.45%2C0.24l-0.77%2C0.21l-1.86%2C0.1l-0.55%2C-0.28l0.53%2C-0.19l0.28%2C-0.28l0.03%2C-0.19l-0.69%2C-0.08l-0.16%2C-0.85l0.03%2C-1.01l0.46%2C-0.8l0.1%2C-0.64l0.41%2C-0.26l2.02%2C1.17l0.12%2C-0.62l-0.43%2C-0.75l-0.01%2C-0.31l1.16%2C-0.44l0.6%2C0.15l-0.03%2C-0.33l0.4%2C-0.56l0.78%2C0.86l1.25%2C-0.4l-0.1%2C-0.44l-0.43%2C-0.08l-0.04%2C-0.14l0.41%2C-0.91l0.63%2C-0.3l0.55%2C-0.28l0.6%2C-0.33l0.71%2C-0.59l0.64%2C-0.3l-0.03%2C-0.27l-0.3%2C-0.02l-2.55%2C1.18l-0.96%2C-0.65l-1.11%2C0.04l-1%2C-0.61l-0.9%2C-0.01l-0.4%2C0.2l-0.16%2C-0.27l0.27%2C-0.43l0.72%2C0.22l0.28%2C-0.39l-0.45%2C-0.48l-0.98%2C-0.38l0.13%2C-0.38l0.55%2C-0.39l1.9%2C-0.25l0.22%2C-0.29l1.78%2C1.04l0.91%2C0.08l0.28%2C-0.19l-0.11%2C-0.27l0.1%2C-0.58l-0.15%2C-0.06l-0.32%2C0.06l-0.27%2C-0.62l0.08%2C-0.51l0.36%2C-0.73l0.52%2C-0.23l0.83%2C-0.77l-1.64%2C0.45l-0.4%2C0.45l-0.34%2C0.76l-0.4%2C0.09l-0.47%2C-0.47l-0.49%2C-0.14l-0.06%2C-0.18l0.28%2C-0.25l0.36%2C-0.16l-0.54%2C-0.42l-1.1%2C0.69l-0.3%2C-0.08l-0.06%2C-0.74l1.58%2C-0.95l-0.01%2C-0.14l-0.48%2C-0.11l-0.79%2C0.52l-0.91%2C0.07l-0.71%2C-1.04l0.8%2C-0.45l0.74%2C0.09l0.82%2C-0.68l0.91%2C-0.16l0.92%2C0.42l0.55%2C0.76l0.85%2C0.47l0.26%2C-0.27l-1.25%2C-0.75l0.14%2C-0.4l0.61%2C-0.41l0.54%2C-0.15l0.05%2C-0.18l-0.6%2C-0.28l-0.75%2C0.51l-0.82%2C-0.12l-0.76%2C-0.92l-0.07%2C-0.53l0.37%2C-0.2l3.04%2C0.87l0.36%2C-0.08l-3.39%2C-1.26l-0.84%2C0.18l-0.2%2C0.44l-0.21%2C0.09l-1.05%2C-0.27l-1.2%2C0.05l-0.53%2C-0.85l0.08%2C-0.1l0.23%2C0.17l0.64%2C0.2l0.29%2C-0.21l0.29%2C-0.51l-0.28%2C-0.41l0.51%2C-0.29l-0.09%2C-0.71l0.49%2C0.02l0.69%2C0.78l0.55%2C-0.12l0.2%2C-0.42l0.96%2C-0.12l0.24%2C0.95l0.72%2C0.44l0.08%2C-0.57l0.46%2C-0.29l-0.07%2C-0.63l0.43%2C-0.38l0.34%2C-0.17l0.19%2C-0.29l0.42%2C0.5l0.38%2C-0.16l0.12%2C-0.34l0.58%2C0.07l0.76%2C0.18l0.54%2C0.61l0.41%2C0.33l1.85%2C2.32l0.3%2C0.12l0.12%2C-0.24l-0.17%2C-0.3l0.21%2C-0.67l-0.07%2C-0.4l-0.79%2C-0.38l-0.66%2C0.03l-0.25%2C-0.32l-0.41%2C-0.44l0.25%2C-0.23l-0.78%2C-0.93l0.45%2C-0.39l0.73%2C0.88l0.39%2C-0.29l1.33%2C-0.14l0.13%2C-0.37l0.2%2C-0.07l0.74%2C0.05l0.56%2C0.25l0.15%2C-0.08l-0.13%2C-0.39l-0.4%2C-0.46l-0.63%2C-0.33l-0.65%2C0.08l-0.45%2C0.41l-0.33%2C0.06l-0.78%2C-0.42l-1.7%2C-0.44l-0.62%2C-0.48l-0.02%2C-0.34l-0.52%2C-0.4l0.16%2C-0.29l-0.5%2C-0.63l0.09%2C-0.33l-0.34%2C-0.9l0.51%2C-0.39l0.25%2C0.12l0.69%2C0.86l0.61%2C0.35l0.49%2C1.26l0.54%2C0.61l0.25%2C-0.01l0.2%2C-0.27l-0.6%2C-1.15l0.17%2C-0.81l1.21%2C0.73l0.31%2C-0.15l0.1%2C-0.33l-0.23%2C-0.42l-0.91%2C-0.82l-0.29%2C-0.68l-0.8%2C-1.04l-0.09%2C-0.54l0.21%2C-0.16l0.3%2C0.24l0.47%2C-0.05l0.61%2C0.59l0.33%2C-0.33l0.65%2C0.83l0.4%2C-0.24l0.22%2C0.62l0.81%2C-0.06l0.3%2C0.61l0.05%2C0.64l0.14%2C0.03l0.25%2C-0.17l0.34%2C0.05l0.73%2C0.74l-0.12%2C0.92l0.62%2C0.85l0.55%2C0.02l1.22%2C-0.44l0.6%2C0.03l-0.19%2C-0.31l-0.57%2C-0.18l-0.52%2C-0.58l-1.64%2C-2.81l-1.26%2C-0.96l-0.03%2C-0.5l-0.78%2C-1.63l0.21%2C-0.45l0.14%2C-1.34L298.1%2C177.67zM328.53%2C173.19l0.33%2C0.03l0.07%2C0.27l-0.26%2C1l-0.63%2C0.25l-0.58%2C-0.5l-0.02%2C-0.54l0.47%2C-0.02l0.46%2C-0.16L328.53%2C173.19zM364.48%2C172.67l-0.02%2C0.82l-0.31%2C0.55l-0.26%2C0.15l-0.32%2C-0.59l-0.18%2C-0.6l0.03%2C-0.11l0.21%2C-0.3l0.34%2C-0.11L364.48%2C172.67zM312.63%2C172.65l0.29%2C0.2l0.4%2C-0.05l0.4%2C0.34l0.05%2C0.79l-0.99%2C0.91l-0.88%2C0.11l-0.58%2C-0.3l-0.02%2C-0.15l0.54%2C0.19l0.39%2C-0.36l-0.45%2C-0.69l0.48%2C-0.11l0.48%2C0.19l0.43%2C-0.3l-0.79%2C-0.34l-0.71%2C-0.01l-0.15%2C-0.42l0.82%2C-0.39L312.63%2C172.65zM333.3%2C171.35l-0.46%2C0.93l-0.54%2C0.46l-0.26%2C0.95l0.13%2C0.28l-0.25%2C0.67l-0.66%2C1l-0.45%2C0.38l-0.41%2C-1.21l0.39%2C-1.7l-0.48%2C-0.44l0.32%2C-0.77l0.38%2C0.15l0.19%2C-0.65l0.85%2C-0.03l0.27%2C-0.75l0.64%2C-0.32l0.17%2C0.01L333.3%2C171.35zM315.44%2C168.25l0.27%2C0.71l-0.19%2C0.49l-0.48%2C0.21l-0.34%2C-0.11l-0.02%2C-0.23l-0.9%2C-0.59l-0.28%2C-0.19l-0.08%2C-0.3l0.11%2C-0.38l0.41%2C-0.32l0.59%2C-0.12l0.29%2C-0.48L315.44%2C168.25zM322.31%2C160.71l0.57%2C0.17l0.64%2C0.37l-0.03%2C0.43l-0.37%2C0.11l0.34%2C0.56l-0.12%2C0.37l-0.39%2C0.35l-1.26%2C-0.27l-1%2C0.41l-0.7%2C-0.13l-0.24%2C-0.77l0.19%2C-0.38l0.55%2C-0.61l0.72%2C-0.15l0.21%2C-0.29l-0.1%2C-0.56L322.31%2C160.71zM327.46%2C158.96l0.47%2C0.05l0.51%2C0.41l0.27%2C0.85l0.08%2C0.7l-0.41%2C0.37l-0.39%2C-0.03l0.05%2C0.39l0.21%2C0.17l0.43%2C-0.16l0.41%2C-0.46l0.77%2C0.69l0.22%2C0.25l0.16%2C-0.23l0.24%2C0.11l0.48%2C1.09l0.17%2C-0.18l-0.05%2C-0.37l0.86%2C-0.15l0.71%2C0.87l1.35%2C3.02l-0.18%2C0.74l-1.01%2C1.74l-0.84%2C0.46l-0.37%2C-0.01l0.06%2C0.98l-0.2%2C0.01l-0.37%2C0.73l-0.73%2C0.2l-0.31%2C0.49l-0.46%2C0.34l-1.5%2C0.26l-0.38%2C0.16l-0.38%2C0.46l-0.42%2C-0.12l-0.01%2C0.39l0.25%2C0.48l-0.67%2C1.62l-0.02%2C0.56l0.34%2C-0.25l0.42%2C0.3l0.28%2C-0.03l0.21%2C-0.42l0.35%2C-0.03l0.34%2C0.34l-0.11%2C0.2l0.32%2C1.38l0.32%2C-0.2l0.08%2C0.38l-0.17%2C0.53l-0.43%2C-0.27l-0.41%2C1.41l-0.46%2C0.78l-0.86%2C0.64l-0.31%2C0.03l-0.82%2C-0.07l-0.97%2C-1.11l-0.3%2C-0.05l-0.56%2C0.6l-0.53%2C0.92l-0.45%2C0.23l-2.58%2C0.4l-1.91%2C1.03l-1.18%2C-0.09l-0.86%2C0.18l-0.77%2C0.22l-0.8%2C0.2l-0.65%2C-0.08l-0.62%2C-0.36l-0.4%2C-0.98l-0.82%2C-1.06l-0.12%2C-0.02l-0.08%2C0.25l-0.69%2C0.18l-0.67%2C-0.3l-0.56%2C-0.68l-0.06%2C-0.91l0.38%2C-0.85l-0.22%2C-0.39l0%2C-0.57l0.35%2C-0.02l0.23%2C0.07l0.37%2C0.26l-0.21%2C-0.71l0.14%2C-0.53l0.55%2C-0.03l0.34%2C0.5l1.35%2C-1l0.03%2C-0.26l1.29%2C0.82l0.36%2C-0.21l-0.29%2C-0.28l0.06%2C-0.11l0.44%2C0.17l1.23%2C1.52l-0.14%2C1.31l0.71%2C-1.56l2.09%2C-1.63l-0.03%2C-0.24l-0.29%2C-0.01l-1.62%2C1.05l-0.7%2C0.01l-1.04%2C-1.48l-0.07%2C-0.65l-0.51%2C-0.49v-1.05l-0.79%2C-1.55l0.17%2C-0.67l1.32%2C0.79l0.63%2C-0.22l0.79%2C0.56l0.51%2C0.14l0.25%2C0.32l0.36%2C-0.24l0.23%2C-0.44l0.82%2C-0.11l0.2%2C-0.19l0.31%2C0.12l0.17%2C-0.16l0.76%2C0.2l1.13%2C-0.05l1.53%2C0.62l0.77%2C-0.07l0.13%2C-0.46l-0.05%2C-0.23l-0.98%2C-0.08l-0.79%2C-0.41l-1.84%2C0.07l-0.25%2C-0.21l-0.64%2C-0.09l-1.13%2C-0.07l-0.77%2C0.16l-0.32%2C-0.15l-0.15%2C-1l0.13%2C-0.55l-0.58%2C-2.27l0.49%2C-0.7l1.05%2C-0.82l0.49%2C-0.07l0.45%2C0.49l-0.21%2C0.84l0.64%2C-0.01l0.8%2C-0.46l0.31%2C0.21l0.25%2C0.58l-0.27%2C1.67l0.35%2C0.2l0.31%2C-0.28l0.25%2C-1.78l0.23%2C-0.27l0.31%2C-0.05l-0.1%2C-1.01l0.89%2C-0.29l0.29%2C-0.5l1.3%2C-0.08l0.26%2C0.35l-0.42%2C2.06l0.31%2C0.39l-0.11%2C0.21l-0.72%2C0.11l0.65%2C1.04l0%2C0.87l0.33%2C0.62l-0.12%2C1.05l-0.4%2C0.48l0.58%2C0.76l0.49%2C-0.07l0.48%2C0.13l0.78%2C0.07l-0.12%2C-0.22l-0.46%2C-0.19l-0.51%2C-0.36l-0.15%2C-0.54l0.55%2C-0.81v-1.1l0.44%2C-2.77l0.83%2C-0.38l-0.01%2C-0.15l-0.7%2C-0.26l0.23%2C-0.18l0.64%2C0.18l0.26%2C-0.1l-0.23%2C-0.38l0.24%2C-0.52l-1.17%2C-0.09l0.13%2C-0.35l-0.86%2C-0.44l-0.63%2C-0.73l-0.21%2C-0.73l0.56%2C0.01l-0.77%2C-0.73l-0.16%2C-1.01l0.38%2C-0.48l0.23%2C-0.05l0.3%2C-0.67l0.32%2C-0.25l1.01%2C1.38l0.33%2C-0.13l-0.44%2C-0.81l0.57%2C-0.34L327.46%2C158.96zM372.73%2C157.53l-0.93%2C1.17l0.02%2C0.97l-0.24%2C0.28l-0.01%2C0.59l0.95%2C1.14l0.12%2C0.91l-0.38%2C0.66l-0.65%2C0.57l-2.73%2C1.66l-0.18%2C-0.07l-0.51%2C-0.72l-0.11%2C-1.16l-0.43%2C-1.19l0.04%2C-0.71l0.79%2C-1.49l0.21%2C-1.27l-0.23%2C-0.44l0.08%2C-0.15l0.51%2C-0.35l0.07%2C-0.39l0.23%2C-0.09l1.08%2C0.39l0.98%2C-0.19l0.2%2C-0.31l0.82%2C-0.29l0.34%2C0.19L372.73%2C157.53zM397.01%2C156.09l0.34%2C0.31l0.27%2C0.7l0.5%2C0.79l0%2C1.23l-0.39%2C-0.35l-0.09%2C-0.71l-0.26%2C-0.2l-0.27%2C-0.61l-0.38%2C-0.71l-0.05%2C-0.29L397.01%2C156.09zM395.1%2C154.94l0.38%2C0.56l0.14%2C1.38l-0.66%2C-0.31l-0.56%2C0.03l-1.2%2C-0.39l-0.09%2C-0.17l0.46%2C-0.2l0.75%2C-0.94L395.1%2C154.94zM371.21%2C153.1l0.16%2C0.01l0.12%2C0.34l-0.06%2C0.94l-0.48%2C1l-0.94%2C-0.58l-0.25%2C-0.67l0.5%2C-0.66l0.02%2C-0.85l-0.31%2C-0.58l0.36%2C-0.42l0.26%2C0.17L371.21%2C153.1zM352.96%2C153.12l-0.63%2C1.05l-1.08%2C1.19l-0.39%2C0.82l-0.33%2C0.98l-0.43%2C2.52l-0.69%2C1.21l-0.69%2C0.09l-0.83%2C-0.26l-1.23%2C0.41l-1.02%2C0.08l-2.89%2C1.01l-0.56%2C-0.14l-0.12%2C-0.44l0.13%2C-0.61l0.63%2C-0.63l0.53%2C-1.35l1.4%2C-2.52l1.16%2C-0.66l0.38%2C-0.45l0.43%2C0.08l0.58%2C-0.37l0.64%2C-0.86l0.5%2C-0.13l0.44%2C-0.92l0.31%2C-0.03l0.41%2C-0.53l0.18%2C-0.99l0.8%2C-1.1l1.25%2C0.34l0.79%2C1.42l0.4%2C0.3L352.96%2C153.12zM354.29%2C150.23l0.48%2C0.36l0.48%2C-0.15l0.14%2C0.34l-0.49%2C0.65l-0.21%2C-0.11l-0.86%2C0.19l-1.18%2C-1.07l-0.24%2C-0.58l0.32%2C-0.28l0.46%2C-0.09l0.49%2C0.21l0.13%2C0.38L354.29%2C150.23zM374.32%2C148.66l0.61%2C0.08l0.5%2C0.46l0.64%2C1.24l0.51%2C0.38l-0.03%2C0.66l0.27%2C0.18l0.56%2C0.95l0.29%2C-0.06l0.43%2C-0.52l-0.2%2C-0.28l0.09%2C-0.35l0.44%2C-0.39l0.07%2C0.25l0.25%2C0.1l1.18%2C-0.68l-0.51%2C0.7l0.79%2C-0.2l0.23%2C0.19l-0.8%2C0.95l-0.89%2C0.13l-0.67%2C0.75l-0.65%2C-0.12l0.67%2C0.6l-0.43%2C0.94l-0.85%2C0.86l-1.91%2C0.94l-1.01%2C-0.77l-0.9%2C-1.7l0.06%2C-0.5l0.14%2C-0.09l-0.07%2C-0.5l-0.94%2C-2.29l0.11%2C-0.7l0.24%2C-0.4l1.35%2C-0.91L374.32%2C148.66zM393.43%2C148.21l0.58%2C0.37l0.28%2C0.61l0.58%2C0.44l0.27%2C-0.03l0.41%2C0.5l-0.63%2C0.95l0.16%2C0.42l-0.26%2C0.29l-0.54%2C-0.05l-0.14%2C-0.29l-0.27%2C-0.38l-0.75%2C-0.17l-0.44%2C-0.46l-0.31%2C0.04l-0.3%2C-0.27l-0.22%2C-0.32l0.04%2C-0.3l-0.25%2C-0.13l-0.09%2C-0.28l0.61%2C-0.3l-0.09%2C-0.17l0.29%2C-0.35l0.78%2C-0.29L393.43%2C148.21zM322.44%2C147.52l0.28%2C0.09l0.12%2C0.15l0.06%2C0.51l0.26%2C0.01l-0.02%2C0.15l-0.33%2C0.13l-0.34%2C0.83l-0.21%2C-0.11l-0.2%2C-0.03l-0.31%2C0.05l-0.02%2C-0.33l-0.15%2C-0.42l0.32%2C-0.17l-0.03%2C-0.78L322.44%2C147.52zM384.13%2C149.26l-0.34%2C-0.07l-0.52%2C-0.86l0.84%2C-0.81l0.67%2C0.01l0.29%2C1.06l-0.63%2C0.59L384.13%2C149.26zM378.72%2C146.99l-0.08%2C0.34l0.22%2C0.19l0.16%2C0.66l0.15%2C0.05l-0.39%2C0.43l-0.38%2C0.03l-0.31%2C0.58l0.8%2C-0.18l0.02%2C0.19l-0.46%2C0.81l-0.46%2C0.43l-0.79%2C0.35l-0.29%2C-0.24l-0.07%2C-0.79l0.38%2C-0.54l0.32%2C-0.18l-0.04%2C-0.43l0.47%2C-0.66l0.17%2C-0.87l0.16%2C-0.16L378.72%2C146.99zM341.81%2C146.92l-0.32%2C0.2l0.1%2C0.28l-0.41%2C0.25l-0.58%2C-0.58l0.43%2C-0.17l-0.17%2C-0.47l0.02%2C-0.9l0.25%2C-0.08l0.41%2C0.48l0%2C0.51l0.24%2C0.13L341.81%2C146.92zM337.77%2C145.13l0.17%2C0.55l-0.54%2C0.87l0.06%2C0.4l0.31%2C0.02l0.41%2C-0.7l1.45%2C-0.61l0.19%2C0.43l-0.57%2C1.1l0.03%2C1.02l0.17%2C0.75l0.34%2C0.57l0.37%2C0.83l0.25%2C0.77l0.75%2C0.83l0.42%2C0.05l0.38%2C-0.28l-0.37%2C-0.25l-0.11%2C-0.82l0.19%2C-0.71l0.25%2C-1.04l0.31%2C-0.5l1.01%2C-0.82l0.83%2C-0.02l0.17%2C0.22l0.78%2C0.32l0.22%2C0.5l-0.16%2C1.22l0.21%2C1.21l-0.24%2C1.23l0.6%2C-0.48l-0.1%2C-0.76l0.94%2C-1.54l0.79%2C0.46l0.88%2C1.2l0.14%2C0.48l-0.12%2C0.83l0.1%2C0.34l-0.84%2C0.35l-0.6%2C0.76l-1.65%2C0.28l-0.91%2C0.46l-0.69%2C-0.03l0%2C0.48l0.55%2C0.92l-0.32%2C1.46l-1.11%2C1.19l-0.55%2C1.59l-0.68%2C0.75l-0.51%2C1.31l0.01%2C0.42l-0.27%2C0.29l-0.86%2C0.51l-0.25%2C0.55l-0.8%2C0.22l-0.6%2C0.53l-0.69%2C-0.15l-0.78%2C0.49l-1.56%2C0.31l-0.82%2C-0.31l-0.26%2C-0.73l-0.78%2C-0.92l-0.22%2C-1.16l-0.4%2C-0.42l-1.6%2C-0.94l-0.22%2C-0.51l0.32%2C-0.4l-0.41%2C-0.15l-0.42%2C0.09l-0.42%2C-0.93l-0.57%2C-0.19l-2.85%2C-1.76l-0.54%2C-0.72l0.1%2C-0.28l-0.17%2C-0.52l0.29%2C-1.01l0.56%2C-0.85l1.16%2C0.4l0.42%2C0.09l0.15%2C0.37l0.4%2C0.11l0.08%2C-0.27l0.36%2C-0.11L329.3%2C155l0.77%2C-1.36l-0.78%2C-0.12l-1%2C-1.24l-0.05%2C-1.22l0.17%2C-0.25l-0.01%2C-0.45l0.73%2C-0.24l0.03%2C-0.69l1.1%2C-0.44l0.96%2C0.14l0.22%2C0.32l-0.06%2C0.55l0.32%2C-0.07l0.46%2C-1.16l0.49%2C-0.42l1.06%2C0.9l0.08%2C1.12l0.71%2C0.44l-0.46%2C-0.71l0.24%2C-0.4l0.42%2C-0.26l0.11%2C-0.4l-1.36%2C-1.38l0%2C-0.55l-0.09%2C-0.36l0.04%2C-0.32l0.45%2C-0.57l0.06%2C1.2l0.23%2C0.09l0.35%2C-0.27l0.4%2C-0.98l0.52%2C-0.37l0.52%2C0.02l0.14%2C0.53l0.7%2C-0.94L337.77%2C145.13zM327.46%2C143.92l0.37%2C0.03l0.28%2C1.19l-0.13%2C1.65l0.22%2C0.39l-0.03%2C0.27l0.27%2C0.02l0.09%2C-1.05l0.37%2C-0.35l0.33%2C-0.75l0.29%2C-0.07l0.6%2C-1.35l0.2%2C0.02l0.39%2C-0.48l0.06%2C1.65l0.23%2C0.17l-0.04%2C-0.51l0.32%2C-0.1l0.9%2C1.07l0.17%2C0.01l0.13%2C0.42l-0.75%2C0.63l-0.14%2C0.58l-0.54%2C0.63l-0.53%2C0.31l-0.4%2C-0.19l-0.67%2C0.11l-0.44%2C0.27l-0.22%2C-0.1l-0.33%2C0.5l-0.37%2C0.11l-0.32%2C0.64l-0.2%2C-0.03l-0.28%2C0.36l-0.28%2C0.38l-0.2%2C0.64L326.5%2C151l0%2C0.74l-0.31%2C-0.01l0.08%2C0.41l-0.22%2C0.12l-0.25%2C-0.3l-0.19%2C-0.07l-0.32%2C-0.49l0.08%2C-0.44l-0.3%2C-0.04l-0.1%2C-0.37l0.13%2C-0.31l0.28%2C-0.16l0.12%2C-0.56l-0.26%2C-0.18l-0.42%2C-0.3l-0.05%2C-1.22l0.46%2C-0.92l-0.03%2C-0.5l0.37%2C-0.34l0.67%2C-0.02l0.13%2C-0.2l-0.09%2C-0.34l-0.34%2C-0.17l0.36%2C-0.36l-0.49%2C-1.15l0.31%2C-0.67l0.38%2C-0.15L327.46%2C143.92zM386.44%2C142.97l0.61%2C0.86l0.07%2C0.55l-0.31%2C0.25l-0.38%2C-0.22l-0.75%2C-0.1l-0.26%2C-0.49l-0.06%2C-0.3l0.26%2C-0.16l-0.16%2C-0.17l0.08%2C-0.12L386.44%2C142.97zM332.34%2C142.36l0.41%2C0.19l0.49%2C1.55l0.46%2C0.22l-0.13%2C0.3l-0.06%2C0.3l-0.29%2C-0.12l-0.58%2C-0.05l-0.1%2C0.34l0.25%2C0.33l-0.2%2C0.11l-0.34%2C-0.54l0.15%2C-0.33l-0.21%2C-0.24l-0.29%2C-0.38l-0.03%2C-0.23l-0.19%2C-1.15l0.05%2C-0.2L332.34%2C142.36zM328.49%2C142.08l0.66%2C0.13l0.1%2C0.17l-0.04%2C0.99l0.21%2C0.47l-0.16%2C1.13l-0.62%2C0.81l-0.22%2C-0.86l0.17%2C-0.48l-0.19%2C-0.39l-0.28%2C-0.18l0.06%2C-0.22l-0.03%2C-0.34l0.17%2C-0.29l-0.3%2C-0.71l0.16%2C-0.26L328.49%2C142.08zM376.54%2C143.47l0.66%2C1.01l-0.19%2C0.49l-1.03%2C1.5l-0.62%2C0.31l-0.33%2C-0.01l-0.23%2C-0.13l-0.95%2C-1.37l-0.4%2C-1.69l1.11%2C-2.43l0.48%2C-0.56l0.14%2C0.01l0.46%2C1.19l0.36%2C0.38l0.3%2C1.01L376.54%2C143.47zM342.57%2C140.11l0.99%2C1.34l1.54%2C1.07l0.96%2C0.72l-0.08%2C0.91l-0.2%2C0.45l-0.33%2C0.15l-0.66%2C-0.22l-0.51%2C0.31l-1.62%2C-0.42l-1.08%2C-0.82l-0.68%2C0.07l0.02%2C-0.34l-0.56%2C-0.64l0.34%2C-1.52l1.01%2C-1.19l0.42%2C-0.09L342.57%2C140.11zM355.63%2C139.4l0.48%2C0.02l0.99%2C0.75l0.08%2C0.44l-0.09%2C0.31l-0.24%2C0.14l-0.06%2C0.37l-0.19%2C0.02l-0.5%2C-0.63l-0.59%2C-0.28l-0.43%2C0.05l-0.53%2C-0.5l0.17%2C-0.7l0.49%2C-0.47l0.42%2C-0.07L355.63%2C139.4zM332.14%2C138.29l0.32%2C-0.16l0.18%2C0.83l-0.06%2C0.86l-0.52%2C0.52l-0.28%2C-0.38l0.08%2C-0.3l-0.22%2C-0.18V139l0.28%2C-0.06l-0.31%2C-0.37l0.29%2C-0.07L332.14%2C138.29zM329.39%2C138.15l0.23%2C0.16l0.33%2C-0.27l0.19%2C0.21l0.17%2C0.15l-0.03%2C0.17l0.18%2C0.62l-0.33%2C0.2l0.15%2C0.26l-0.06%2C0.6l0.13%2C0.69l-0.23%2C0.64l-0.57%2C-0.01l-0.3%2C-0.37l-1.05%2C-0.07l-0.23%2C0.18l-0.17%2C-0.2l-0.12%2C-1.07l0.26%2C0.05l0.42%2C-0.2l0.12%2C-0.45l0.28%2C-0.15l0.07%2C-0.98l0.33%2C-0.28L329.39%2C138.15zM383.16%2C136.19l3.71%2C1.63l1.5%2C0.44l0.09%2C0.52l0.29%2C-0.01l0.57%2C-0.58l0.54%2C0.52l0.31%2C0.09l0.61%2C-0.07l0.57%2C-0.58l1.81%2C0.2l-0.42%2C0.66l0.32%2C0.93l1.2%2C0.6l0.04%2C0.41l1.17%2C0.91l0.27%2C0.99l1.46%2C0.6l0.39%2C0.78l1.27%2C-0.51l0.11%2C-1.05l0.59%2C-1.19l0.09%2C-0.66l0.21%2C-0.03l0.72%2C0.41l0.38%2C-0.01l1.61%2C-2.08l0.88%2C0.43l1%2C2.8l-0.21%2C0.68l0.66%2C1.27l0.82%2C2.42l0.83%2C0.96l0.09%2C1.08l-0.7%2C0.75l0.02%2C1.01l1.28%2C2.17l0.08%2C1.61l0.56%2C0.22l0.69%2C0.6l2.46%2C1.22l0.89%2C-0.17l1.64%2C0.89l0.05%2C0.69l-1.81%2C1.82l0.7%2C0.88l1.27%2C0.15l0.28%2C0.23l0.25%2C0.59l-1.14%2C1.21l-1.11%2C2.53l0.44%2C0.58l1.55%2C0.94l0.36%2C1.55l-0.13%2C1.72l0.49%2C1.4l0.42%2C0.48l3.53%2C2.58l0.26%2C0.11l2.05%2C-1l1.26%2C1.23l-1.16%2C1.74l-1.53%2C1.01l-0.08%2C1.49l-0.68%2C1.59l0.08%2C0.58l-1.08%2C0.32l0.5%2C2.19l-2.04%2C-0.5l-2.2%2C0.24l-1.09%2C0.24l-2.28%2C1.34l-1.02%2C0.31l-1.72%2C0.2l-0.11%2C0.22l-0.04%2C0.37l0.72%2C1.23l-0.41%2C1.97l0.34%2C1.27l0.63%2C0.78l0.02%2C1.63l0.6%2C0.28l0.34%2C0.36l0.62%2C1.54l0.25%2C1.13l0.96%2C1.5l0.53%2C1.58l0.88%2C0.56l0.19%2C0.6l0.23%2C2.21l-0.29%2C2.36l0.12%2C1.5l-0.59%2C1.03l0.11%2C0.92l-0.74%2C1.04l-2.26%2C1.04l-1.06%2C0.81l-3.94%2C0.07l-2.06%2C0.24l-2.21%2C-0.64l0%2C0l-5.16%2C-7.94l-2.38%2C-4.26l-7.98%2C-2.32l-4.23%2C3.33l-2.09%2C2.46l-0.34%2C1.95l1.31%2C3.35l0.25%2C1.21l1.19%2C1.18l-1.17%2C4.32l-7.82%2C-5.37l-3.97%2C3.95l-11.26%2C0.89l4.1%2C5.74l1.56%2C1.89l0.67%2C7.87l-3.07%2C8.64l-3.44%2C4.7l-2.65%2C2.09l2.03%2C1.69l4.61%2C2.47l-5.77%2C6.61l-1.23%2C1.89l-21.52%2C-10.1l-8.37%2C0.64l-4.94%2C-4.71l-6.41%2C2.84l-2.47%2C-4.68l-4.21%2C0.57L300%2C242.3l-0.68%2C-0.1l-4.44%2C1.96l-2.04%2C0.45l-1.63%2C0.14l-7.62%2C-0.99l-0.97%2C1.27l-0.91%2C0.77l-1.51%2C1.7l-0.96%2C0.34l-0.28%2C0.09l-0.74%2C0.26l-1.05%2C-0.07l-0.28%2C-0.89l-0.21%2C-1.12l0.65%2C-0.27l0.99%2C0.3l0.01%2C-1.23l-0.01%2C-0.43l-0.67%2C-0.75l-0.88%2C-0.62l0.04%2C-0.96l0.08%2C-0.6l0.58%2C-1.36l0.4%2C-0.54l0.18%2C-0.28l1.62%2C-0.58l0.74%2C0.19l-0.03%2C-0.96l0.21%2C-0.35l1.39%2C-0.61l0.78%2C-0.28l0.85%2C-0.16l0.51%2C0.4l0.51%2C-0.2l1.24%2C-1.42l0.31%2C-0.46l1.68%2C-0.14l0.17%2C0.32l-0.14%2C0.71l0.09%2C0.5l0.34%2C0.49l0.51%2C0.68l0.99%2C1.27l0.31%2C0.59l0.78%2C-0.01l0.75%2C-0.93l-0.88%2C-0.08l-1.39%2C-1.07l-0.06%2C-0.91l0.16%2C-1.19l0.18%2C-0.24l1.31%2C-0.4l2.05%2C-1l0.66%2C0.1l0.73%2C0.46l0.38%2C0.25l0.56%2C-0.3l0.81%2C-0.11l0.37%2C0.57l0.37%2C0.89l-0.05%2C0.86l0.35%2C0.27l0.42%2C0.45l1.13%2C0.19l0.4%2C-0.04l1.42%2C-0.4l1.94%2C1.18l0.12%2C-0.38l-1.23%2C-0.93l-1.73%2C-0.42l-1.69%2C-0.25l-0.38%2C-1.02l0.09%2C-0.69l-0.24%2C-0.54l-0.48%2C-0.35l-1.03%2C-0.4l-1.84%2C0.19l-1.4%2C-0.68l-0.03%2C-0.53l0.19%2C-0.55l0.4%2C-0.28l0.65%2C-0.12l1.07%2C-0.81l1.4%2C-1.29l0.06%2C-0.29l0.87%2C-0.24l0.61%2C0.06l3.2%2C2.24l2.5%2C0.36l0.99%2C0.74l0.48%2C0.99l0.26%2C0.16l-0.07%2C-0.23l0.13%2C-0.03l0.03%2C0.63l0.12%2C-0.06l-0.28%2C-1.84l-0.68%2C-0.91l-0.82%2C-0.41l-2.01%2C-0.22l-1.55%2C-0.91l-1.09%2C-0.86l-0.63%2C-0.11l-0.71%2C-0.36l0%2C-0.33l1.76%2C-1.54l0.29%2C-0.71l0.48%2C-0.17l0.75%2C-0.96l1.06%2C-0.38l0.61%2C0.11l0.25%2C-0.41l0.31%2C0.02l0.35%2C0.58l-0.24%2C0.42l-0.63%2C0.18l0.52%2C0.55l0.51%2C0.18l0.15%2C-0.15l0.4%2C0.2l0.36%2C-0.06l0.82%2C0.5l1.08%2C-0.18l-1.44%2C-1.75l-0.35%2C-0.65l-0.76%2C-0.24l0.04%2C-0.12l-0.51%2C-0.35l-0.16%2C0.34l-0.38%2C-0.13l0.02%2C-0.49l0.37%2C-0.22l-0.13%2C-0.3l0.13%2C-0.33l-0.93%2C0.08l-2.3%2C1.04l-0.75%2C0.15l-0.48%2C0.35l-0.41%2C-0.04l-1.03%2C0.87l-0.21%2C0.01l-0.26%2C-0.84l0.04%2C-0.5l0.23%2C-0.5l0.6%2C-0.62l-0.25%2C-1.27l0.59%2C-0.4l0.87%2C0.19l0.55%2C-0.08l0.12%2C-0.47l-0.39%2C-0.24l-0.04%2C-0.84l-1.29%2C0.08l-0.17%2C-0.17l-0.17%2C-0.65l0.08%2C-0.29l0.37%2C-0.31l0.84%2C-1.03l0.02%2C-0.45l0.31%2C-0.62l1.07%2C-0.69l0.39%2C-0.69l1.88%2C-2.06l-0.18%2C-0.2l-0.81%2C-0.47l-0.62%2C0.16l0.46%2C-0.9l1.51%2C-0.7l0.68%2C-0.05l0.28%2C0.33l0.94%2C-0.17l0.86%2C-0.64l0.33%2C-0.11l1.11%2C-0.3l0.95%2C-0.79l1%2C-0.36l0.42%2C-0.06l0.85%2C0.15l0.52%2C0.05l0.08%2C0.79l0.09%2C0.13l0.35%2C0.09l1.42%2C-0.7l0.46%2C0.48l0.66%2C0.97l0.34%2C0.03l0.22%2C-0.38l-1.5%2C-1.37l0.47%2C-0.12l-0.5%2C-0.35l-0.46%2C-0.17l-0.34%2C-0.12l-0.46%2C0.08h-0.21l-0.3%2C-0.46l0.23%2C-0.42l-0.07%2C-0.34l-0.34%2C-0.06l-0.16%2C-0.39l0.21%2C-1.04l0.25%2C-1.88l-0.52%2C-0.3l-0.82%2C0.16l-0.95%2C0.46l-0.09%2C-0.16l0.02%2C-0.39l0.66%2C-1.17l-0.04%2C-0.89l-0.28%2C-0.39l-0.01%2C-0.34l0.27%2C-1.5l-0.26%2C-0.55l0.23%2C-0.15l0.31%2C0.06l1.04%2C-0.56l0.31%2C-0.35l0.24%2C-0.93l0.61%2C-0.36l0.12%2C-0.37l-0.05%2C-1.15l-0.29%2C-0.79l0.42%2C-0.33l1.2%2C0.03l0.25%2C-0.36l-0.11%2C-0.42l-0.42%2C-0.13l0.23%2C-2.07l-0.71%2C-1.8l0.39%2C-0.6l0.37%2C-0.04l0.72%2C0.48l0.48%2C-0.56l0.34%2C-0.75l0.22%2C-0.19l1.08%2C0.26l0.4%2C0.42l0.85%2C0.37l0.51%2C0.44l0.13%2C0.33l-0.08%2C1.84l-0.33%2C1.29l0.15%2C0.53l-0.29%2C0.97l-1.75%2C2.18l-0.68%2C2.46l-0.16%2C0.4l-0.23%2C0.88l0.1%2C0.46l0.66%2C-0.52l0.31%2C-0.53l0.4%2C-1.53l-0.19%2C-1.38l0.94%2C-1.11l1.2%2C-1.47l0.41%2C-0.58l1.4%2C0.8l0.63%2C0.42l0.39%2C0.53l-0.21%2C1.93l0.03%2C0.64l0.26%2C0.56l0%2C1.64l-0.23%2C0.66l0.4%2C0.84l-0.1%2C0.65l-0.53%2C1.21l0.12%2C0.67l-0.25%2C0.97l0.07%2C0.41l0.18%2C-0.07l0.55%2C-1.71l0.11%2C-1.2l0.39%2C-0.3l0.05%2C-1.62l0.27%2C-0.82l-0.1%2C-1.42l-0.22%2C-0.52l0.19%2C-0.65l-0.04%2C-0.59l0.48%2C-0.47l0.39%2C0.23l0.23%2C0.74l-0.05%2C0.57l-0.39%2C0.81l1.08%2C1.46l0.25%2C0.08l0.6%2C0.71l0.7%2C0.34l0.37%2C0.86l-0.07%2C0.45l0.11%2C0.37l0.19%2C-0.17l0.16%2C-0.75l-0.05%2C-0.77l-0.65%2C-0.5l-0.73%2C-0.95l-0.27%2C-0.71l0.58%2C-0.06l0.12%2C-0.51l0.29%2C-0.1l1.27%2C0.1l0.31%2C-0.38l0.46%2C-0.04l0.46%2C0.07l-0.03%2C0.29l0.85%2C0.08l-0.01%2C-0.19l0.9%2C0.12l0.54%2C0.26l-0.12%2C0.29l-0.39%2C0.05l-0.26%2C0.3l0.59%2C0.26l0.73%2C0.46l0.38%2C-0.1l0.3%2C0.72l1.22%2C-0.06l-0.13%2C-0.32l-0.54%2C-0.19l-0.1%2C-0.18l0.21%2C-0.33l-0.07%2C-0.18l-0.55%2C-0.36l0.01%2C-0.48l-0.46%2C-0.49l-0.54%2C0.05l-0.4%2C-0.01l-0.85%2C-0.21l-0.39%2C-0.41l-0.28%2C-0.03l-0.01%2C0.34l-0.11%2C0.11l-1.3%2C-0.94l-0.44%2C0.11l-0.26%2C-0.1l-1.03%2C-0.88l-1.05%2C-0.5l-0.68%2C-0.68l-0.15%2C-0.48l-0.21%2C-0.93l0.02%2C-0.51l-0.61%2C-0.87l-1.97%2C-1.2l-0.32%2C0.13l-0.4%2C-0.31l0.07%2C-0.93l0.63%2C-1.45l-0.24%2C-0.94l-0.69%2C-0.58l0.17%2C-0.57l1.56%2C-0.52l0.47%2C-0.14l0.54%2C-0.25l1.11%2C-0.63l1.53%2C-0.11l0.31%2C-0.24l1.33%2C-0.36l0.75%2C0.06l0.39%2C-0.23l0.38%2C-0.44l0.09%2C-0.49l0.35%2C-0.11l0.57%2C0.7l0.33%2C1.88l-0.03%2C1.23l-0.72%2C0.62l0.09%2C0.46l0.48%2C0.21l0.61%2C-0.37l0.15%2C0.12l0.31%2C2.46l0.68%2C1.05l0.22%2C0.44l0.63%2C0.05l0.35%2C0.28l0.17%2C0.48l-0.31%2C1.09l0.18%2C0.55l0.88%2C1.39l1%2C1.13l0.79%2C0.45l2.79%2C-0.11l0.85%2C0.16l0.48%2C-0.16l0.66%2C0.51l0.47%2C0.93l0.16%2C0.69l-0.1%2C1.12l-1.01%2C0.78l-0.56%2C0.75l-0.03%2C0.32l-0.8%2C1.25l0.02%2C0.3l-0.06%2C0.56l0.48%2C0.54l0.62%2C0.27l0.64%2C-0.25l0.04%2C-0.28l0.71%2C-0.41l0.55%2C-0.03l0.63%2C0.34l1.07%2C0.28l0.76%2C0.49l0.69%2C0.17l1.17%2C0.17l-0.35%2C-0.32l-1.02%2C-0.46l-0.82%2C-0.67l-0.7%2C-0.76l-0.39%2C-0.76l-0.09%2C-1.93l0.18%2C-1.93l-1.39%2C-2.91l-0.75%2C-0.38l-0.82%2C-0.29l-0.3%2C-0.33l-2.43%2C0.35l-1.21%2C-0.01l-0.69%2C-0.71l-0.36%2C-0.72l-0.28%2C-2.32l-0.7%2C-0.46l-0.45%2C-0.04l-0.29%2C-0.57l-0.37%2C-0.28l-0.22%2C-0.37l0.19%2C-1.06l0.48%2C-0.93l0.07%2C-1.32l0.15%2C-0.34l1.19%2C-0.92l0.51%2C-1.14l2%2C-0.5l0.42%2C0.97l0.85%2C0.9l0.4%2C0.7l0.16%2C-0.18l-0.17%2C-0.58l-1.26%2C-1.94l0.03%2C-0.77l-0.17%2C-0.16l-0.22%2C0.07l-0.42%2C0.59l-0.33%2C-0.08l-0.6%2C0.27l-1.01%2C0.1l-0.49%2C0.35l-0.1%2C0.71l-0.43%2C0.62l-0.38%2C0.07l-0.39%2C-0.54l-0.54%2C-0.28l-0.18%2C-0.83l-0.34%2C-0.55l-0.2%2C-2.36l0.17%2C-1.38l0.48%2C-1.23l1.09%2C-1.02l0.23%2C-0.86l0.77%2C-0.83l0.5%2C-0.83l0.41%2C-1.18l0%2C-1.56l0.88%2C-0.92l0.4%2C0.16l0.3%2C0.14l0.22%2C-0.13l0.77%2C-1.41l1.62%2C-0.94l1.04%2C-0.02l1.5%2C0.05l0.43%2C0.03l0.43%2C-0.44l0.31%2C-0.11l0.24%2C0.2l1.44%2C-1l0.81%2C-0.17l0.44%2C0.31l1.04%2C-0.78l0.78%2C-0.18l0.46%2C-0.32l0.46%2C-0.07l0.82%2C0.23l0.33%2C0.5l0.05%2C0.42l-0.33%2C0.76l-0.03%2C0.97l-0.95%2C1.26l0.63%2C1.32l-0.79%2C1.93l-0.23%2C2.12l-0.51%2C0.68l0.32%2C0.13l0.95%2C0.22l0.98%2C0.82l0.14%2C0.35l-0.74%2C1.32l-0.05%2C0.27l0.26%2C0.76l-0.61%2C1.46l0.12%2C0.43l-0.11%2C0.46l-0.57%2C1.13l-0.4%2C0.31l-0.22%2C0.47l0.08%2C0.55l-0.29%2C0.8l-0.02%2C0.47l0.27%2C0.91l0.79%2C0.77l-0.84%2C1.36l-1.19%2C1.39l-0.66%2C0.48l-0.79%2C1.65l-0.68%2C0.87l0.46%2C0.11l1.18%2C-1.59l0.92%2C-0.91l0.25%2C0.01l0.37%2C0.35l0.32%2C0.64l0.34%2C-0.14l-0.42%2C-0.97l0.43%2C-1.46l0.96%2C-0.95l0.12%2C-0.49l0.55%2C-0.48l0%2C-0.61l-0.59%2C-0.27l0.13%2C-0.37l0.07%2C-0.58l0.53%2C-0.76l-0.01%2C-0.56l-0.38%2C-0.45l-0.14%2C-0.68l0.64%2C-1.06l0.35%2C-1.28l-0.11%2C-0.56l-0.32%2C-0.04l-0.16%2C-0.58l0.59%2C-0.04l0.6%2C-0.35l0.5%2C0.32l0.74%2C0.16l1.49%2C0.46l0.72%2C0.58l1.09%2C0.53l2.17%2C-0.02l0.84%2C-0.2l-0.07%2C-0.22l-1.63%2C0.13l-1.22%2C-0.23l-1.15%2C-0.98l-1.58%2C-0.44l-0.05%2C-0.26l-0.8%2C-0.52l-0.37%2C-1.29l0.11%2C-0.98l-1.12%2C-1.4l0.01%2C-0.67l0.43%2C-0.43l0.11%2C-1.1l0.49%2C-0.72l0.7%2C-0.48l-0.21%2C-0.58l-0.08%2C-0.89l0.23%2C-1.05l0.73%2C-0.83l0.61%2C-0.15l0.77%2C-2.54l0.48%2C-0.47l0.69%2C-1.24l0.14%2C1.01l-0.14%2C1.32l-0.3%2C0.35l-0.53%2C2.66l0.21%2C0.41l0.53%2C-0.33l0.23%2C-0.74l0.44%2C-1.47l0.27%2C-1.35l1.25%2C-3.91l0.67%2C-1.17l0.24%2C-1.62l0.4%2C-1.26l0.65%2C-0.34l0.12%2C1.69l-0.05%2C0.63l-0.31%2C0.51l1.03%2C3.16l0.21%2C-0.15l0.03%2C-0.62l-0.72%2C-1.64l0.25%2C-1.02l0.01%2C-1.3l0.31%2C-1.03l1.25%2C-1.59l0.11%2C-0.78l0.58%2C-0.13l1.05%2C1.17l1.04%2C4.11l0.38%2C0.33l0%2C1.35l-0.82%2C2.27l0%2C1.17l-0.44%2C0.86l-0.62%2C2.03l-0.61%2C4.16l0.04%2C0.58l-0.07%2C0.83l-0.73%2C0.87l0.11%2C0.19l0.39%2C1.4l0.16%2C0.3l0.38%2C0.33l0.61%2C0.01l0.26%2C0.56l0.38%2C0.16l-0.03%2C1.24l-0.17%2C0.55l-0.51%2C0.54l-0.2%2C1.01l-0.4%2C0.22l-0.33%2C-0.46l-0.22%2C0.18l-0.08%2C0.52l-1.1%2C0.24l0.3%2C0.52l-0.21%2C0.48l0.09%2C0.77l0.47%2C0.07l0.76%2C-0.06l-0.37%2C0.45l-0.77%2C0.32l0.11%2C0.72l0.17%2C0.44l-0.05%2C0.22l-0.4%2C0.6l-0.32%2C0.69l0.96%2C-0.27l-0.09%2C0.54l-0.03%2C0.72l0%2C0.47l-0.57%2C0.92l-0.45%2C0.46l-0.15%2C-0.41l0.34%2C-0.44l-0.34%2C-0.2l-0.07%2C-0.96l-0.31%2C0.2l-0.16%2C1.19l-0.39%2C1.08l0.05%2C0.65l0.09%2C0.8l-0.29%2C1.34l-0.17%2C0.35l-0.93%2C0.91l-1.03%2C0.43l-0.72%2C0.63l-1.05%2C1.18l-0.2%2C0.56l0.31%2C0.29l-0.8%2C1.61l-0.55%2C0.69l-0.52%2C1.59l0.09%2C0.39l0.33%2C0.33l0.58%2C-0.14l-0.57%2C-0.28l0.78%2C-0.4l0.19%2C-1.17l0.56%2C-0.57l0.85%2C-1.93l0.66%2C-0.48l0.22%2C-0.54l0.66%2C-0.38l2.22%2C-2.03l1.01%2C0.46l0.39%2C-0.71l0.39%2C-0.3l-0.3%2C-1.36l0.46%2C-0.59l0.14%2C-0.77l0.57%2C-0.8l0.38%2C-0.59l0.32%2C-2.01l1.13%2C-3.92l0.27%2C-2.41l0.36%2C-0.32l0.57%2C-0.1l0.35%2C0.4l1.68%2C1.12l0.27%2C0.57l0.09%2C0.85l0.33%2C0.14l0.23%2C-0.23l0.32%2C0.01l0.41%2C0.53l0.41%2C1.11l0.47%2C0.43l1.18%2C0.33l1.28%2C-0.14l1.5%2C1.33l0.25%2C-0.25l-0.39%2C-0.35l-0.83%2C-1.3l-0.54%2C0.02l-0.45%2C-0.18l-0.75%2C0.16l-1.1%2C-0.81l-1.01%2C-1.5l-0.52%2C-1.67l-0.85%2C-1.17l-1.09%2C-0.72l-0.37%2C-0.6l-0.34%2C-1.07l0.22%2C-1.56l0.14%2C-0.54l0.29%2C-0.07l0.2%2C-0.4l0.68%2C-2.1l-0.18%2C-1.76l-0.8%2C-0.85l0.14%2C-0.48l-0.58%2C-0.31l-0.09%2C-0.28l0.73%2C-0.25l0.58%2C0.23l3.09%2C-1.83l0.5%2C-0.09l0.45%2C0.18l0.36%2C-0.17l0.16%2C-0.53l0.59%2C-0.43l0.7%2C-0.97l0.18%2C-0.44l-0.01%2C-0.59l0.19%2C-0.27l0.03%2C-0.49l-0.28%2C-0.45l-0.43%2C-0.23l-0.29%2C-0.59l0.33%2C-0.87l0.44%2C-0.53l1.07%2C-0.4l0.37%2C-0.29l0.15%2C-0.17l0.08%2C-0.83l0.41%2C-0.43l1.27%2C-0.52l0.83%2C-0.11l0.37%2C-0.27l1.12%2C-1.57l0.65%2C-0.29l0.3%2C0.05l0.33%2C0.4l-0.35%2C0.43l0.02%2C0.43l-1.13%2C0.65l-0.62%2C0.84l-0.33%2C0.09l-0.38%2C0.17l0.28%2C0.25l-0.88%2C0.86l0.01%2C0.37l-0.9%2C1.76l-1.18%2C0.91l0.39%2C0.27l0.75%2C-0.24l0.42%2C-0.02l0.68%2C0.11l-0.18%2C0.35l0.39%2C0.2l0.05%2C0.33L376.9%2C162l-0.25%2C0.19l-0.08%2C1l0.27%2C0.09l0.4%2C1.58l0.57%2C0.29l0.16%2C0.78l0.22%2C0.25l0.23%2C0.04l0.52%2C-0.54l0.05%2C-0.62l0.46%2C0.08l0.25%2C0.05l0.19%2C-0.17l-0.61%2C-0.47l-0.76%2C-0.93l0.15%2C-0.67l0.79%2C-0.52l0.3%2C0.05l0.33%2C-0.51l-0.11%2C-0.91l-0.23%2C-0.17l-0.15%2C0.02l-0.2%2C-0.29l0.06%2C-0.39l0.34%2C-0.35l-0.22%2C-0.29l0.36%2C-0.16l0.08%2C0.31l0.72%2C-0.61l0.4%2C0.32l1.18%2C-0.31l0.65%2C0.18l0.12%2C0.24l0.16%2C0.84l-1.1%2C1.27l0.13%2C0.65l-0.43%2C0.43l-0.03%2C0.69l-0.14%2C0.74l0.13%2C0.18l0.38%2C-1.02l0.61%2C-0.41l0.14%2C-0.49l0.48%2C-0.33l0.51%2C-0.88l-0.95%2C-2.91l0.29%2C-0.83l0.36%2C0.12l0.49%2C0.29l1.14%2C-0.09l0.65%2C0.15l0.28%2C-0.47l-0.11%2C-0.58l-1.45%2C-0.22l-1.68%2C-1.16l0.31%2C-0.48l-0.02%2C-0.74l0.37%2C-0.8l-0.18%2C-0.84l0.25%2C-0.53l0.09%2C-0.81l0.46%2C-0.99l1.09%2C-0.08l0.77%2C-0.61l0.2%2C-0.01l0.48%2C-0.01l1.13%2C0.17l0.68%2C0.25l0.14%2C0.1l0.14%2C0.78l0.82%2C0.4l1.16%2C1.09l0.07%2C0.61l-0.04%2C0.67l0.23%2C0.35l0.67%2C0.37l0.22%2C0.58l-0.31%2C0.35l-0.03%2C0.69l0.63%2C1.27l0.73%2C0.12l1.92%2C1.45l1.36%2C0.36l1.06%2C1.3l0.32%2C0.89l0.24%2C-0.01l0.43%2C0.33l0.54%2C-0.09l0.02%2C0.25l-0.43%2C0.2l0.26%2C0.22l0.07%2C0.77l0.65%2C0.94l0.86%2C2.26l1%2C0.58l0.53%2C-0.41l0.07%2C0.18l0.09%2C0.33l0.42%2C0.69l0.34%2C0.38l-0.26%2C0.3l-0.62%2C0.48l-0.66%2C-0.07l0.82%2C0.64l0.63%2C-0.16l0.32%2C-0.26l0.75%2C-0.35l0.73%2C-0.05l0.27%2C-0.61l-1.4%2C-0.94l-0.29%2C-0.01l-0.16%2C-0.23l0.05%2C-0.27l0.56%2C0.11l0.3%2C-0.55l-0.38%2C-0.19l-2.4%2C-2.92l-0.24%2C-0.03l0.11%2C0.53l-0.38%2C0.23l-1.39%2C-1.6l0.23%2C-0.82l1.05%2C0.69l0.78%2C-0.01l0.13%2C-0.23l0.69%2C0.04l0.29%2C-0.42l-0.06%2C-0.3l-0.8%2C-0.86l-1.22%2C-0.23l-0.73%2C-0.41l-0.11%2C-0.57l-0.3%2C-0.25l0.12%2C-0.21l-0.14%2C-0.33l0.09%2C-0.62l-0.34%2C-0.39l0.01%2C-0.85l-0.33%2C-0.92l0.25%2C-0.65l0.38%2C0.05l0.08%2C-0.27l0.54%2C0.16l0.17%2C-0.26l-0.07%2C-0.3l-0.56%2C-0.21l-0.53%2C-0.82l-0.04%2C-0.39l0.18%2C-0.34l0.88%2C-0.41l1.48%2C-0.28l0.41%2C0.1l0.3%2C0.48l0.09%2C1.28l-0.28%2C0.78l0.05%2C0.27l-0.5%2C0.26l0.36%2C0.29l0.64%2C0.17l0.17%2C0.34l0.1%2C-0.07l0.2%2C-0.66l-0.36%2C-0.92l0.23%2C-2.08l-0.29%2C-0.83l-0.6%2C-0.95l0.37%2C-0.29l0.82%2C-0.13l0.66%2C-0.61l-0.18%2C-0.13l-1.08%2C0.12l-0.85%2C0.4l-0.38%2C-0.04l-0.29%2C0.38l-1.41%2C0.36l-1.12%2C0.05l-1.25%2C-1l-0.53%2C-0.78l0.58%2C-0.44l0.38%2C0.01l1.01%2C-1.15l1.77%2C-0.07l0.1%2C-0.16l0.51%2C-0.01l0.21%2C-0.25l0.65%2C-0.26l-0.01%2C-0.64l0.62%2C-0.79l0.7%2C-0.46l0.31%2C-1.52l-0.28%2C-0.16l-0.32%2C0.45l-0.12%2C0.79l-0.45%2C0.45l-0.37%2C0.16l-0.11%2C-0.39l-0.26%2C0.01l-0.06%2C0.82l-0.48%2C0.32l-0.56%2C0.75l-1.1%2C-0.11l-1.18%2C0.39l-0.61%2C-0.51l-0.01%2C-0.5l-0.17%2C-0.12l-0.17%2C0.17l-0.04%2C0.55l0.39%2C0.72l-2.11%2C0.98l-0.81%2C-0.8l-0.24%2C0.14l-0.71%2C-0.38l-1.38%2C-1.06l-0.02%2C-0.63l0.24%2C-0.49l-0.35%2C-0.44l-0.17%2C-0.01l-0.45%2C1.07l-0.44%2C0.17l-0.63%2C-0.32l-0.97%2C-0.13l-0.25%2C-0.24l-0.18%2C-0.29l-0.18%2C-1.14l-0.82%2C-1.74l0.89%2C-0.26l0.91%2C-0.96l-0.25%2C-0.73l-0.63%2C0.4l-0.53%2C0.22l-1.36%2C0.59l-0.82%2C0.05l-0.53%2C-0.14l-0.68%2C-0.43l-0.57%2C-0.67l0%2C-0.43l0.1%2C-0.49l-0.36%2C-0.35l-0.29%2C-0.02l0%2C-0.49l-0.22%2C-0.52l-0.16%2C0.04l-0.18%2C0.49l-0.28%2C0.05l-0.02%2C-0.58l-0.25%2C-0.27L383.16%2C136.19zM372.78%2C135.48l0.42%2C0.03l0.08%2C0.87l0.86%2C0.32l0.23%2C0.79l-0.02%2C1.14l-0.42%2C1.19l-0.11%2C1.03l-0.62%2C1.59l-0.22%2C2.04l0.3%2C0.85l0.73%2C1.09l0.22%2C1.08l-1.86%2C0.8l-1.01%2C-0.15l-0.61%2C-0.26l-0.03%2C-0.88l-0.2%2C-0.01l-0.22%2C0.5l0.01%2C0.64l-0.29%2C0.36l-1.25%2C0.49l-0.69%2C-0.15l-0.06%2C-0.46l0.9%2C-2.41l-0.6%2C-1.09l0.1%2C-0.33l-0.26%2C-1.28l-0.13%2C1.6l0.28%2C0.93l-0.05%2C0.32l-0.52%2C0.77l-0.33%2C-0.38l-0.34%2C-0.02l0.19%2C1.27l-0.4%2C0.23l-0.8%2C0.09l-1.31%2C-0.99l-0.44%2C-0.67l-0.2%2C-0.98l0.27%2C-2.3l0.22%2C-0.99l-0.29%2C-0.66l0.33%2C-0.56l0.2%2C-0.4l0.29%2C-0.57l0.02%2C-0.76l0.66%2C-0.64l0.75%2C-0.4l0.41%2C-0.13l0.25%2C0.22l0.43%2C-0.18l0.12%2C-0.47l-0.15%2C-0.41l0.07%2C-0.51l0.42%2C-0.69l0.29%2C-0.15l0.44%2C-0.01l0.96%2C-0.4l0.79%2C0.2l0.65%2C-0.07l0.51%2C-0.41h0.46L372.78%2C135.48zM337.55%2C133.93l0.3%2C0.46l0.01%2C0.26l0.27%2C0.6l0.31%2C0.26l-0.16%2C0.97l-0.36%2C-0.1l-0.15%2C0.22l0.59%2C0.66l0.12%2C1.12l0.29%2C0.6l-0.86%2C1.54l-0.09%2C0.7l0.29%2C0.26l-0.12%2C0.77l-0.56%2C0.17l-0.18%2C0.35l0.1%2C0.46l-0.27%2C0.05l-1.67%2C0.45l-0.39%2C-0.28l-1.25%2C-1.73l-0.68%2C-0.3l-0.21%2C-0.34l-0.55%2C-0.07l-0.04%2C-0.21l0.27%2C-0.31l0.32%2C-0.21l0.29%2C0.01l0.46%2C-0.36l0.05%2C-0.31l0.51%2C-0.05l0.4%2C0.24l0.06%2C0.85l0.3%2C0.36l0.3%2C0.02l-0.23%2C-0.37l0.21%2C-0.81l-0.07%2C-0.43l-0.37%2C-0.64l0.03%2C-0.37l0.29%2C-0.4l0.61%2C-0.26l0.47%2C0.16l0.38%2C-0.09l-0.17%2C-0.39l-1.4%2C-0.26l0.08%2C-0.47l0.48%2C-0.33l-0.04%2C-0.24l-0.59%2C-0.59l-0.23%2C-0.59l0.6%2C-0.31l0.34%2C0.52l0.05%2C-0.55l0.17%2C-0.1l0.41%2C0.26l0.25%2C-0.24l-0.18%2C-0.41l0.15%2C-0.37l0.27%2C-0.12l0.1%2C0.35l0.37%2C0.14l-0.12%2C-0.27l0.25%2C-0.29L337.55%2C133.93zM350.19%2C135.87l-0.37%2C0.07l-0.24%2C-0.6l-0.46%2C-0.14l-0.07%2C-0.52l0.08%2C-0.32l0.27%2C-0.14l0.22%2C-0.7l0.42%2C-0.16l0.5%2C0.3l0.13%2C1.07l-0.23%2C0.89L350.19%2C135.87zM346.68%2C131.91l0.71%2C-0.12l0.25%2C0.32l0.02%2C0.47l0.43%2C0.99l-0.08%2C1.47l0.16%2C0.94l0.12%2C0.12l0.18%2C-0.12l-0.12%2C-0.48l0.16%2C-0.27l0.61%2C0.2l0.4%2C0.33l-0.03%2C0.45l0.57%2C1.43l-0.09%2C1.6l0.28%2C1.08l0.85%2C0.27l0.04%2C-0.83l0.56%2C-0.7l0.25%2C-2.17l0.63%2C0.81l0.57%2C0.07l0.61%2C0.42l0.28%2C0.94l-0.08%2C0.26l-0.64%2C-0.13l-0.13%2C0.77l0.58%2C0.28l0.19%2C0.72l0.52%2C0.53l0.25%2C0.55l0.14%2C-0.05l-0.11%2C-0.17l0.46%2C0.05l-0.18%2C0.15l0.16%2C0.2l-0.22%2C0.2l0.07%2C0.11l0.73%2C0.2l0.36%2C0.38l0.86%2C-0.18l0.55%2C0.92l1.03%2C-0.03l0.13%2C0.43l-0.06%2C0.14l-0.8%2C0.27l-0.45%2C0.3l-1.61%2C0.63l-0.14%2C0.43l0.28%2C0.3l-0.39%2C0.85l-0.45%2C0.32l-1%2C0.06l-0.81%2C0.37l-1.05%2C-0.54l-1.25%2C0.11l-0.33%2C-0.22l-0.72%2C0.01l-0.65%2C-0.45l-0.18%2C-0.31l-0.24%2C-1.3l-0.47%2C-0.63l0.2%2C-0.53l0.54%2C-0.02l-0.02%2C-0.67l-0.39%2C-1.22l-0.24%2C-0.12l-0.78%2C-1.15l0.12%2C-0.28l0.29%2C-0.07l0%2C-0.36l-1.64%2C-2.74l-0.27%2C-0.28l-1.48%2C-0.64l-0.23%2C-0.24l-0.2%2C-0.87l0.06%2C-0.49l0.18%2C-0.14v-0.69l0.2%2C-0.35l0.72%2C0.88l0.51%2C0.2l-0.27%2C-0.26l0.01%2C-0.36l-0.46%2C-0.36l0.38%2C-0.2l0.3%2C-0.81l-0.06%2C-0.57l0.3%2C-0.46l0.47%2C-0.14L346.68%2C131.91zM362.05%2C133.27l0.41%2C-0.01l0.14%2C0.19l-0.23%2C0.73l-0.94%2C1.01l-0.68%2C1.44l-0.33%2C-0.64l-0.18%2C-3.56l-0.2%2C-0.61l-0.45%2C-0.59l0.09%2C-0.99l0.44%2C-0.1l0.31%2C0.18l0.12%2C0.44l0.57%2C0.82l0.24%2C1.07L362.05%2C133.27z%22%2F%3E%0A%09%09%3Cpath%20fill%3D%22white%22%20stroke%3D%22none%22%20id%3D%22NO-10%22%20title%3D%22Vest-Agder%22%20%20d%3D%22M46.36%2C779.58l1.86%2C0.33l0.53%2C0.74l-0.12%2C0.63l-0.53%2C0.3l-0.56%2C-0.26l-0.19%2C-0.45l-0.23%2C0.06l-0.45%2C0.1l-0.23%2C-0.27l-0.33%2C-1.17L46.36%2C779.58zM55.71%2C738.25l0.21%2C-0.31l1.27%2C-0.02l0.56%2C0.32l3.7%2C1.06l0.38%2C0.7l-0.41%2C0.36l-0.89%2C4.02l0.04%2C0.42l0.43%2C0.37l0.27%2C0.54l-0.14%2C0.58l-1.12%2C-0.13l-0.21%2C0.28l0.28%2C1.17l0.4%2C0.15l0.37%2C1.04l-0.06%2C1.46l-0.3%2C0.65l-0.46%2C0.43l-1.38%2C0.36l0.02%2C0.34l0.68%2C0.32l-0.05%2C0.31l-0.14%2C0.35l-1.16%2C1.09l-0.01%2C0.2l2.93%2C0.04l0.09%2C-0.64l2.52%2C-0.26l1.39%2C-0.58l0.45%2C-0.06l0.19%2C0.2l0.6%2C-0.5l1.42%2C-0.75l0.31%2C0.1l0.12%2C0.28l-0.12%2C0.5l0.79%2C-0.35l1.91%2C0.51l0.08%2C0.56l1.39%2C2.71l0.35%2C0.38l-0.02%2C1.66l-0.08%2C0.33l-0.56%2C0.73l-0.29%2C1.07l-0.57%2C0.25l-0.96%2C-0.03l-0.26%2C0.2l-0.13%2C2.27l0.1%2C0.27l1.1%2C0.52l0.51%2C0.43L71%2C765.2l-0.52%2C0.76l-1.46%2C1.1l-0.04%2C0.4l0.36%2C1.01l-0.17%2C0.79l1.02%2C1.6l1.43%2C-0.49l0.67%2C0.23l0.56%2C0.44l0.42%2C-0.91l1.6%2C0.35l0.4%2C-0.07l0.17%2C-0.21l0.28%2C0.13l0.05%2C1.34l-0.48%2C0.63l1.18%2C0.31l0.32%2C0.2l0.19%2C0.49l0.52%2C0.04l0.29%2C0.19l0.23%2C0.51l-0.18%2C0.48l0.21%2C0.31l0%2C0.39l0.69%2C1.17l0.59%2C0.24l0.15%2C-0.07l-0.02%2C-0.77l0.27%2C-0.55l0.85%2C-0.97l0.36%2C-0.2l0.37%2C0.04l-0.16%2C0.97l0.43%2C0.3l0.09%2C1.58l0.2%2C0.28l-0.46%2C0.43l-0.01%2C0.41l1.21%2C0.07l0.33%2C0.33l0.57%2C-0.34l0.4%2C0.03l0.25%2C0.14l0.05%2C0.28l-0.33%2C0.58l1.05%2C0.69l-0.31%2C1.01l-0.03%2C0.67l-0.77%2C0.63l-0.2%2C0.5l0.3%2C1.3l0.46%2C0.26l0%2C0l-0.24%2C0.56l-0.57%2C0.43l-0.05%2C0.51l-0.65%2C-0.21l-0.64%2C-0.52l-0.12%2C-0.49l-0.53%2C0.56l-0.22%2C-0.98l-0.12%2C-0.34l0.4%2C-0.71l0.19%2C-0.4l0.18%2C-0.48l0.02%2C-0.28l-0.25%2C-0.32l-0.3%2C-0.81l-0.3%2C0.25l-0.18%2C0.54l0.03%2C0.68l0.1%2C0.76l-0.3%2C0.41l-0.07%2C0.56l-0.24%2C0.02l-0.63%2C-0.05l-0.17%2C0.15l-0.01%2C0.35l-0.01%2C0.67l-0.04%2C0.57l-0.12%2C0.7l-0.28%2C0.36l-0.39%2C-0.06l-0.3%2C-0.44l-0.21%2C0.62l-0.22%2C0.26l-1.3%2C-0.05l-0.37%2C0.4l-0.5%2C0.01l0%2C-0.59l-0.31%2C-0.04l-0.46%2C0.53l-1.24%2C0.71l-0.88%2C0.22l-0.45%2C0.66l-0.06%2C0.78l-0.92%2C-0.46l-0.21%2C0.63l-0.88%2C-0.01l-1.9%2C0.04l-0.11%2C-0.34l-0.35%2C-0.24l-0.54%2C-0.17l-1.08%2C0.8l-1.1%2C-0.68l-0.63%2C-0.29l-0.33%2C0.19l-1.01%2C-0.08l0.22%2C-1.03l-0.39%2C0.09l-0.51%2C0.19l-0.48%2C0.5l-0.33%2C-0.05l-0.29%2C-0.76l-0.31%2C0.04l-0.65%2C0.27l-0.38%2C0.06l-0.28%2C0.06l-0.15%2C0.67l-0.13%2C0.46l-0.13%2C0.38l-0.63%2C0.72l-0.68%2C0.4l-0.41%2C-0.33l-0.14%2C-0.45l0.2%2C-1.02l0.55%2C-0.89l1.8%2C-1.21L60%2C786.99l-0.48%2C-0.38l-0.22%2C0.68l-0.7%2C0.43l-0.45%2C0.48l-1.08%2C0.81l-0.34%2C-0.07l-0.18%2C-0.32l0%2C-0.39l0.81%2C-0.57l-0.14%2C-0.59l0.31%2C-0.63l0.92%2C-1.11l-0.1%2C-0.39l-0.59%2C0.43l-0.44%2C0.65l-0.44%2C0.82l-0.43%2C0.36l0.06%2C0.62l-0.49%2C0.28l-0.3%2C-0.08l-0.09%2C-0.38l0.06%2C-0.62l-0.15%2C-0.36h-0.51l-0.64%2C-0.07l-0.94%2C-0.11l-0.25%2C-0.16l-0.47%2C-0.25l0.58%2C-0.27l0.52%2C-0.38l1.08%2C-0.66l0.12%2C-0.29l-0.44%2C-0.28l-0.8%2C-0.58l-0.53%2C-0.86l-0.06%2C-0.21l-0.14%2C-0.37l-0.7%2C0.02l0.25%2C1.27l1.03%2C0.48l0.37%2C0.56L54%2C784.92l-0.6%2C0.28l-0.5%2C0.4l-1.17%2C-0.16l-0.12%2C0.5l1.22%2C0.65l0.26%2C0.18l-0.09%2C0.63l-0.56%2C0.45l-0.21%2C0l-0.32%2C-0.7l-1.03%2C0.21l-0.62%2C0.04l-0.45%2C-0.12l-0.44%2C-0.39l-0.24%2C0.06l-0.26%2C0.43l-0.98%2C-0.81l-0.82%2C-1.11l-0.16%2C-0.37l0.87%2C-0.42l0.67%2C-1.27l0%2C-0.95l0.4%2C-0.08l0.85%2C-0.38l0.5%2C-0.35l0.51%2C-0.35l0.1%2C-0.18l-0.97%2C-2.31l-0.59%2C-0.92L49%2C778.51l0.47%2C1.21l-0.42%2C0.34l-0.45%2C-0.34l-2.16%2C-0.38l-0.8%2C-0.17l-0.46%2C-0.09l-0.28%2C-0.36l-0.23%2C0.11l-0.2%2C-0.02l-0.81%2C-0.2l-0.64%2C-0.4l0%2C0l3.91%2C-2.07l1.13%2C-1.63l0.24%2C-0.59l-0.39%2C-2.29l0.4%2C-0.13l0.4%2C-0.66l-0.24%2C-0.32l-0.3%2C-1.32l-0.38%2C-0.65l0.54%2C-2.36l-0.56%2C-2.2l0.4%2C-0.37l0.14%2C-0.59l-0.75%2C0.33l-1.11%2C-0.41l-0.76%2C0.56l-0.17%2C-0.04l-0.35%2C-1l-0.94%2C-0.7l0.41%2C-0.57l0.41%2C-0.16l0.92%2C0.03l2.41%2C-0.92l0.12%2C-0.38l-0.12%2C-0.71l-0.45%2C-0.73l-0.47%2C-0.39l0.08%2C-1l-1.39%2C-0.21l0.09%2C-0.77l0.95%2C-2.39l1.01%2C-1.91l-0.11%2C-0.12l-0.74%2C0.04l-0.19%2C-0.15l-0.1%2C-0.76l1.69%2C-1.71l-0.43%2C-1.16l0.06%2C-0.41l1.45%2C-0.55l0.65%2C-0.53l1.51%2C-1.62l0.41%2C-0.99l2.49%2C-2.25l-0.01%2C-0.97l-0.38%2C-0.52l0.33%2C-0.63l0.55%2C-0.34L55.71%2C738.25z%22%2F%3E%0A%09%09%3Cpath%20fill%3D%22white%22%20stroke%3D%22none%22%20id%3D%22NO-07%22%20title%3D%22Vestfold%22%20%20d%3D%22M135.08%2C738.81l0.23%2C0l0.57%2C0.43l0.43%2C0.26l-0.06%2C0.37l-0.59%2C0.02l-0.11%2C0.72l0.49%2C-0.34l0.06%2C0.34l-0.4%2C0.46l-0.05%2C1.04l0.12%2C0.48l0.09%2C0.57l-0.44%2C0.8l-0.19%2C-0.12l-0.16%2C-0.54l-0.01%2C-0.59l-0.23%2C-0.67l-0.06%2C-0.6l-0.02%2C-1.67l-0.09%2C-0.46L135.08%2C738.81zM135.84%2C734.89l0.33%2C1.34l0.4%2C0.2l-0.11%2C0.97l0.3%2C0.42l-0.65%2C1.2l-1.03%2C-0.66l-0.63%2C0.34l-0.15%2C-0.69l0.11%2C-1.11l0.48%2C-0.97l0.03%2C-1.42l0.32%2C-0.13L135.84%2C734.89zM134.75%2C716.26l0.75%2C2.11l0.03%2C0.74l-0.21%2C0.49l-0.13%2C0.25l-0.19%2C0.5l0.16%2C0.8l-0.11%2C0.78l-0.02%2C0.28l-0.32%2C0.35l-1.02%2C-0.11l-0.69%2C-0.45l-0.85%2C-1.01l-0.52%2C-0.52l-0.23%2C0.4l0.66%2C1.57l0.93%2C1.37l0.55%2C0.66l0.42%2C0.69l0.29%2C0.48l0.6%2C1.03l0.48%2C-0.58l0.72%2C0.15l0.42%2C0.08l0.58%2C0.8l0.4%2C-0.23l0.05%2C0.82l-0.27%2C0.22l-0.23%2C1.28l-0.31%2C0.69l0.2%2C0.76l0.29%2C0.31l0.57%2C0.78l0.44%2C0.43l-0.15%2C1l-0.39%2C0.61l-0.3%2C0.62l-0.27%2C0.69l-0.26%2C0.25l-0.2%2C0.02l-0.31%2C-0.74l-0.26%2C-0.43l-0.82%2C-0.39l-0.48%2C0.06l-0.12%2C0.18l-0.72%2C2.42l-0.24%2C1.22l0.12%2C1.17l-0.1%2C0.43l-0.11%2C0.73l-0.07%2C0.95l-0.24%2C-0.33l-0.23%2C-0.33l-0.36%2C-0.34l-0.16%2C0.19l0.28%2C0.62l0.37%2C1.13l0.06%2C0.6l0.08%2C0.61l-0.24%2C0.83l-0.57%2C-2.8l-0.39%2C-0.47l0.01%2C0.93l0.4%2C1.23l-0.03%2C0.58l0.02%2C0.81l-0.21%2C0.3l-0.2%2C-1.07l-0.2%2C-0.21l0.01%2C-1.31l-0.32%2C-0.29l-0.24%2C0.11l-0.29%2C0.79l0.26%2C0.38l0.14%2C0.87l-0.08%2C0.45l-0.47%2C0.99l-0.42%2C0.24l-0.64%2C0.49l-0.23%2C0.09l-0.47%2C0.04l-0.05%2C-0.93l0.91%2C-0.36l0.15%2C-0.3l-0.13%2C-0.75l-1.25%2C1.15l-0.5%2C0.35l-0.51%2C0.35l-0.17%2C-1.14l-1.1%2C-0.2l0.03%2C0.77l0.42%2C0.51l0.19%2C0.48l0.27%2C0.5l-0.44%2C0.72l-0.76%2C0.04l-0.4%2C0.18l-0.19%2C-0.17l-0.23%2C-0.29l-0.22%2C0.31l0.17%2C0.48l-0.25%2C0.2l-0.71%2C-0.13l-0.66%2C-0.04l-0.73%2C-0.4l-0.15%2C0.14l0.09%2C0.36l-0.23%2C0.28l-0.15%2C-0.41l-0.68%2C-0.19l-0.11%2C-0.21l0.61%2C-0.35l0.24%2C-0.34l-0.06%2C-0.5l-0.14%2C-0.64l-0.11%2C-0.96l-0.38%2C0.23l0%2C0l-0.08%2C-0.47l0.48%2C-0.07l0.11%2C-1.19l0.25%2C-0.13l0.1%2C-0.58l-0.2%2C-0.89l-0.49%2C-0.65l0.18%2C-1.55l0.6%2C-0.49l0.49%2C-0.09l0.14%2C-0.36l-0.2%2C-0.73l-0.57%2C-0.96l0.54%2C-0.36l-0.28%2C-0.6l0.01%2C-0.57l-2.59%2C-3.34l0.51%2C-1.12l-0.17%2C-1.04l0.19%2C-1.85l0%2C0l-0.47%2C-2.1l1.54%2C-0.34l2.08%2C0.56l0.5%2C-0.16l0.12%2C-0.4l1.38%2C0.07l0.33%2C0.23l1.09%2C-0.53l-1.05%2C-1.99l-1.3%2C-1.55l-0.18%2C-0.51l-0.78%2C-0.82l0.37%2C-0.33l-0.07%2C-0.8l0.83%2C-0.52l0.23%2C-0.34l0.19%2C-1.11l0.57%2C-0.46l0.75%2C0.91l0.93%2C-0.11l0.84%2C-1.15l1.99%2C0.01l0.48%2C-0.2l0.37%2C-0.01l1.36%2C0.11l0.47%2C-1.11l0%2C0l0.49%2C0.1l0.34%2C0.29L134.75%2C716.26z%22%2F%3E%0A%09%3C%2Fg%3E%0A%3C%2Fsvg%3E)
Choropleth Map of Norway (Norge)
Regionify is a choropleth map tool that turns regional data into clear, publish-ready visualizations. Color administrative divisions by any numeric metric — GDP per capita, population density, election results, or your own dataset — then export as PNG, SVG, animated GIF, or an embeddable iframe. No GIS expertise required.
Create your map of NorwayWhat you can create for Norway with Regionify
From static maps to animated time-series — every format, ready to export.
Norway choropleth map
Visualize Norway's 19 counties as a choropleth map. Color regions by any numeric dataset — population, GDP, unemployment, health outcomes, and more. Export as PNG, JPEG, or PDF.
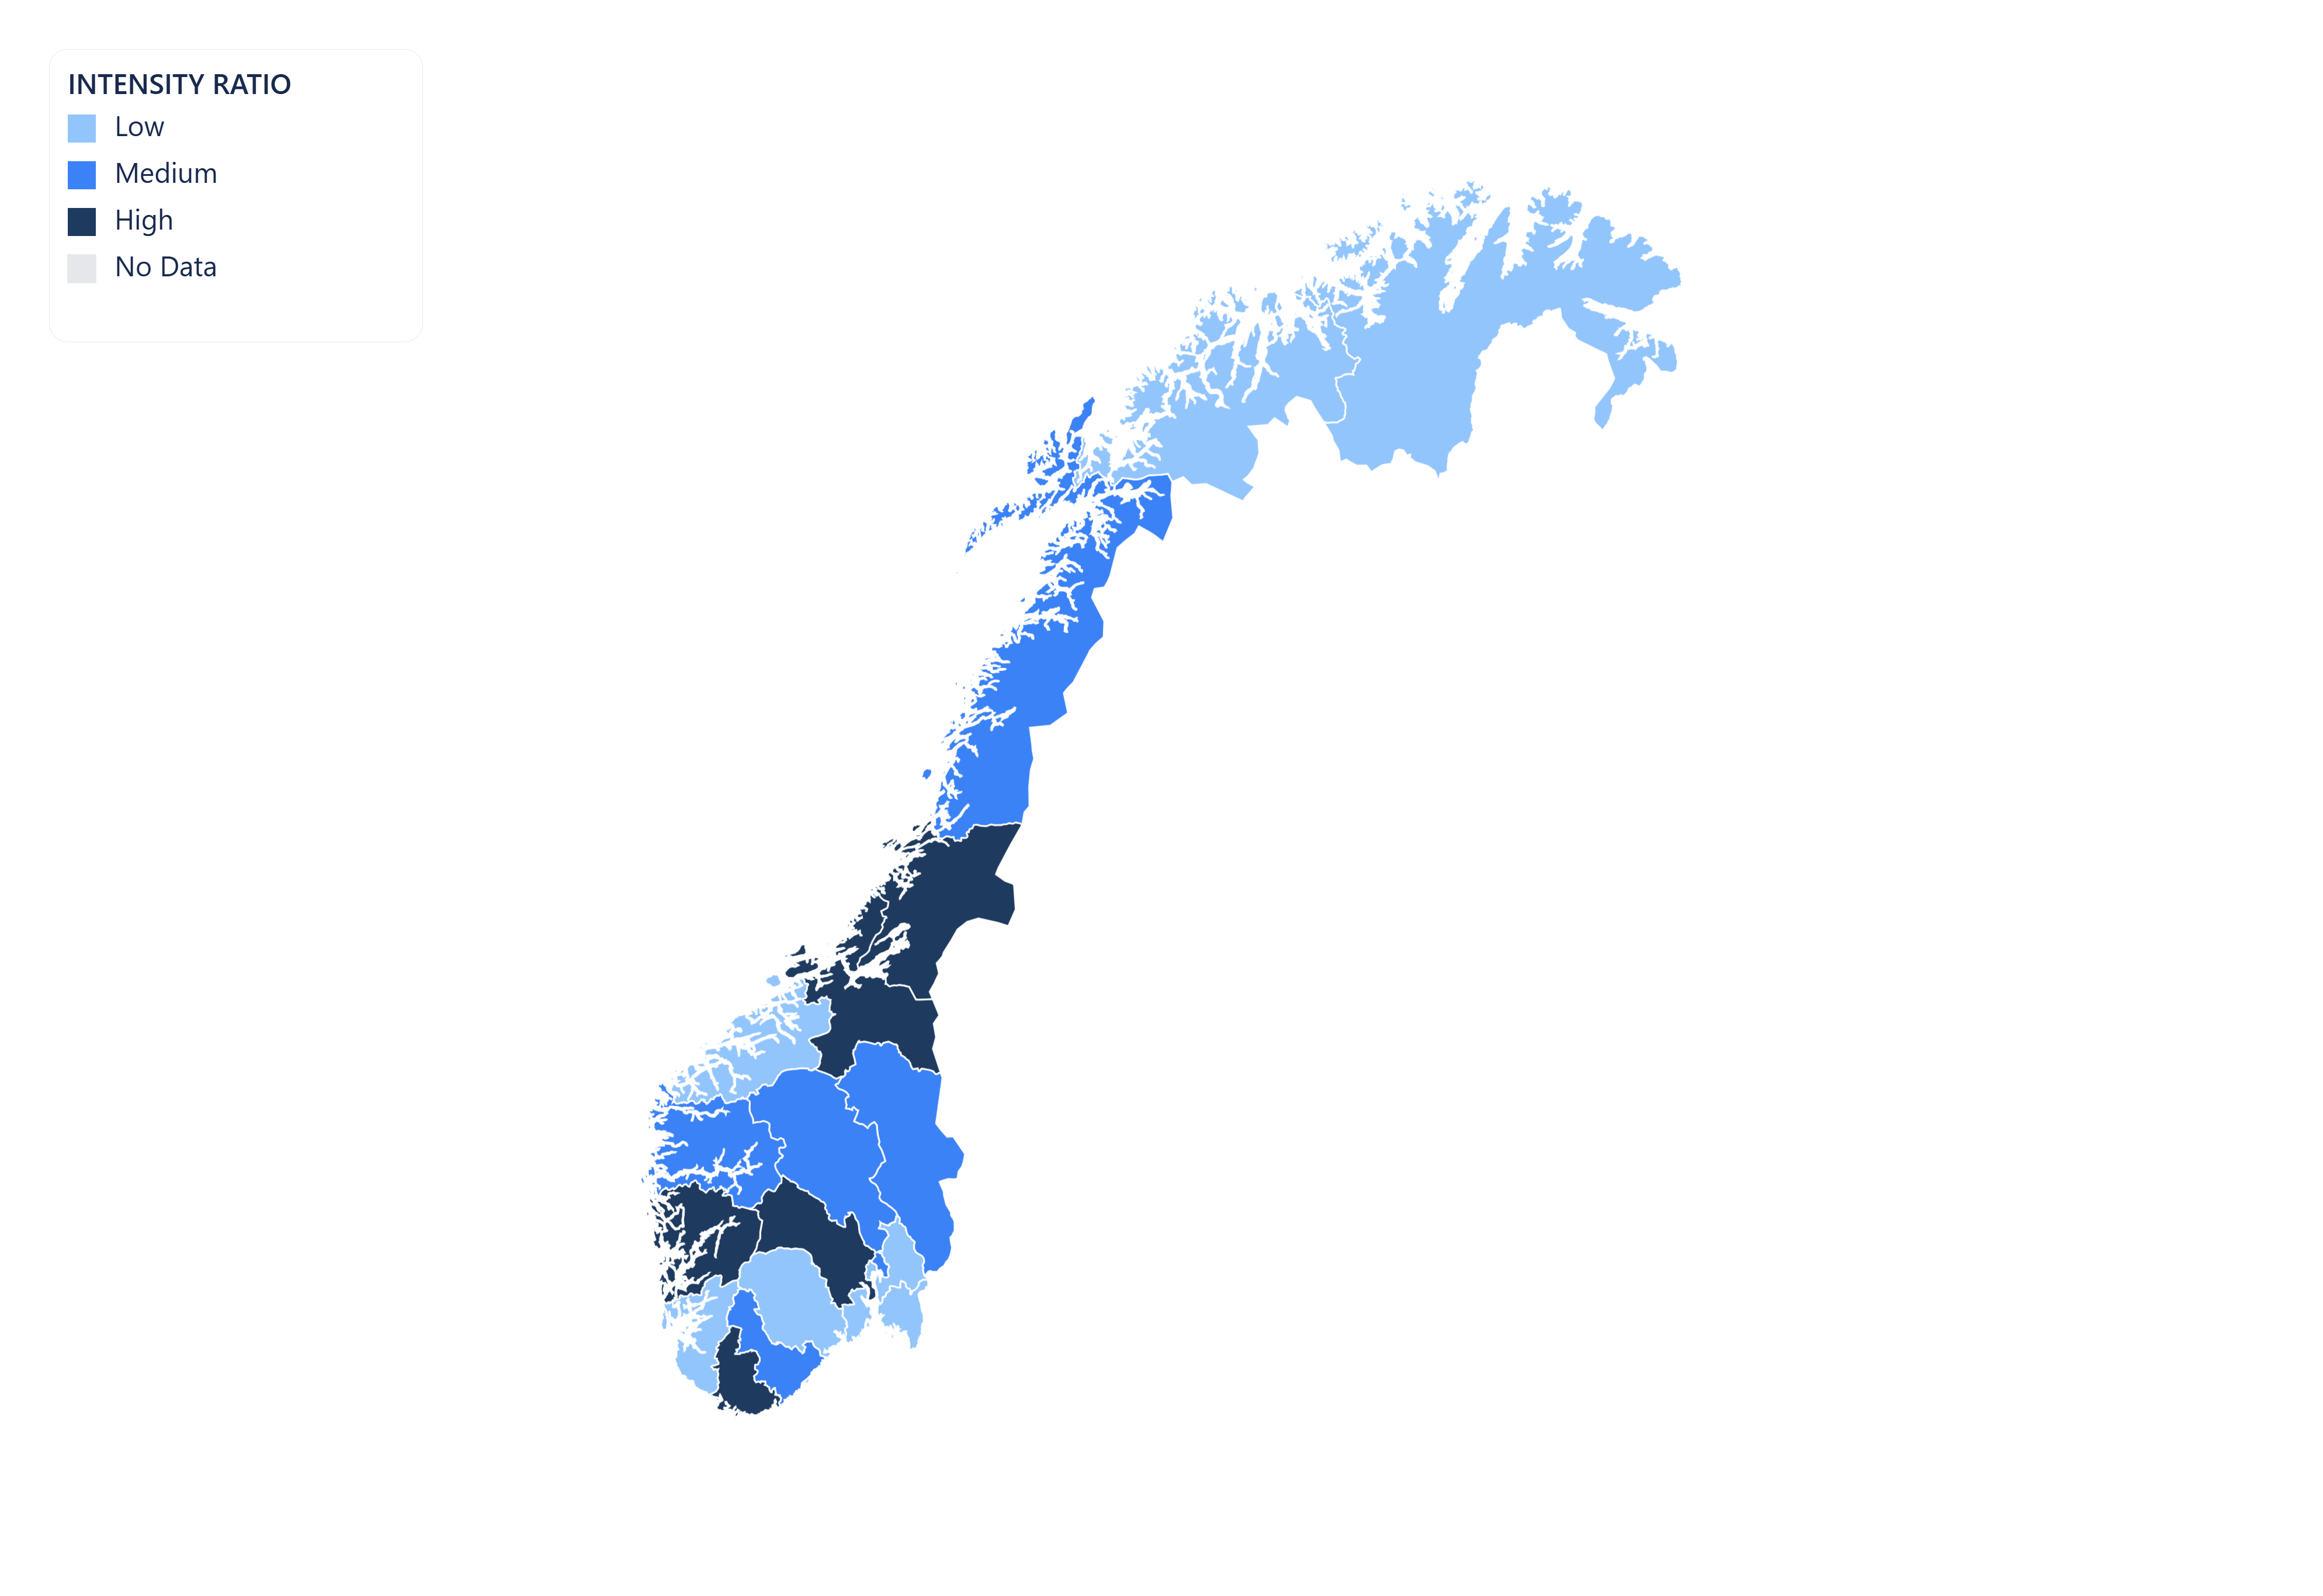
Vector SVG export
Export your Norway map as a scalable vector graphic (SVG). Ideal for print publications, editorial illustrations, and web use — scales to any resolution without quality loss.

Animated GIF
Bring your Norway data to life. Import historical time-series data and export a looping animated GIF showing how regional values changed over time.
MP4 video export
Export your Norway time-series map as an MP4 video. Perfect for presentations, reports, and social media posts where motion communicates change more clearly than static images.
Public share page
Share your Norway choropleth map with a public link. Anyone with the URL can view the full interactive map — no account or login required.
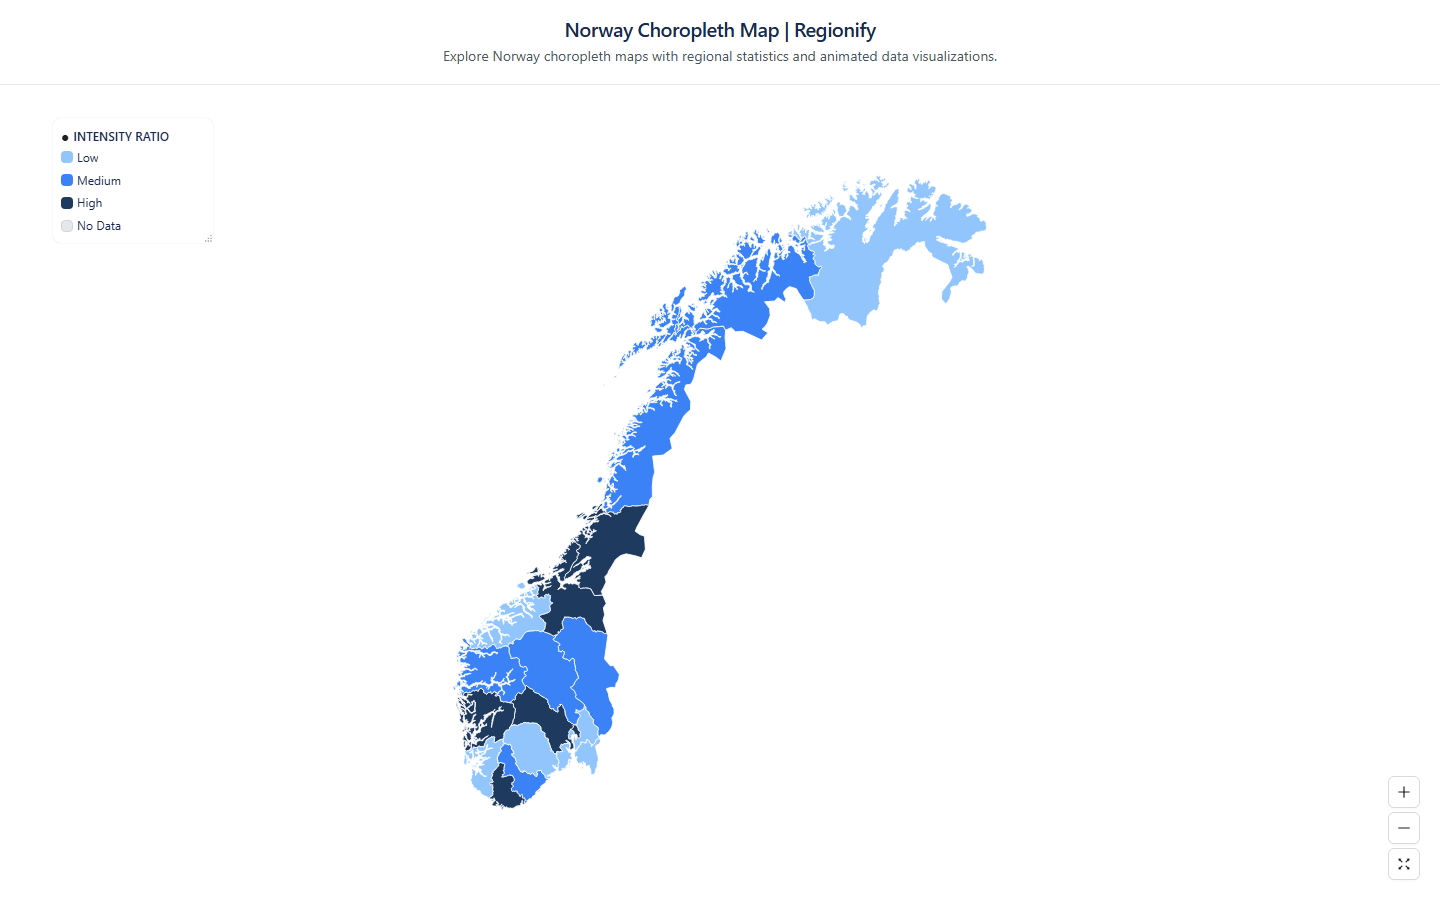
Embeddable iframe
Embed your Norway choropleth map anywhere with a single line of HTML. The iframe stays live — viewers always see the latest version of your map, no re-publishing needed.
AI-powered data import for Norway maps
No spreadsheet? No problem. Regionify's AI Agent turns a plain-text description or raw pasted data into a ready-to-visualize dataset in seconds.
AI Generator
Generate Norway data from a prompt
Describe the dataset you need in plain English — for example "GDP per capita of Norway's 19 counties in 2023" or "election results by counties" — and the AI generates a plausible, structured dataset that maps directly onto Norway's administrative boundaries. Edit any values in the table view before saving.
- ✓ Works for population, GDP, health, election, and custom metrics
- ✓ Supports time-series prompts for animated maps
- ✓ Output pre-matched to Norway's 19 counties
AI Parser
Clean and import messy Norway data
Paste raw text, a copied Wikipedia table, or an unstructured CSV with regional figures for Norway. The AI parser normalises region names, strips noise, resolves mismatched spelling across Norway's counties, and outputs a clean id–label–value table ready to visualise.
- ✓ Handles inconsistent or misspelled counties names
- ✓ Auto-detects time columns for historical data
- ✓ Streams results in real time as AI processes
AI Agent is available on the Chronographer plan.
Counties of Norway
- Akershus
- Aust-Agder
- Buskerud
- Finnmark
- Hedmark
- Hordaland
- Møre og Romsdal
- Nordland
- Nord-Trøndelag
- Østfold
- Oppland
- Oslo
- Rogaland
- Sogn og Fjordane
- Sør-Trøndelag
- Telemark
- Troms
- Vest-Agder
- Vestfold
Build your own Norway choropleth map — free
Upload any dataset, color Norway's counties by any numeric metric, and export as PNG, SVG, GIF, or MP4. No design skills required — start in seconds, publish anywhere.