%20ammap.com%20%7C%20SVG%20map%20of%20Spain%20High%20--%3E%0A%3Csvg%20xmlns%3D%22http%3A%2F%2Fwww.w3.org%2F2000%2Fsvg%22%20xmlns%3Aamcharts%3D%22http%3A%2F%2Famcharts.com%2Fammap%22%20xmlns%3Axlink%3D%22http%3A%2F%2Fwww.w3.org%2F1999%2Fxlink%22%20version%3D%221.1%22%20viewBox%3D%220%200%20820%201250%22%20width%3D%22100%25%22%20height%3D%22100%25%22%20preserveAspectRatio%3D%22xMidYMid%20slice%22%3E%0A%09%3Cdefs%3E%0A%09%09%0A%0A%09%09%3Camcharts%3Aammap%20projection%3D%22mercator%22%20leftLongitude%3D%22-18.161674%22%20topLatitude%3D%2243.794381%22%20rightLongitude%3D%224.332045%22%20bottomLatitude%3D%2227.636889%22%3E%3C%2Famcharts%3Aammap%3E%0A%0A%09%09%3C!--%20All%20areas%20are%20listed%20in%20the%20line%20below.%20You%20can%20use%20this%20list%20in%20your%20script.%20--%3E%0A%09%09%3C!--%7Bid%3A%22ES-AN%22%7D%2C%7Bid%3A%22ES-AR%22%7D%2C%7Bid%3A%22ES-AS%22%7D%2C%7Bid%3A%22ES-CB%22%7D%2C%7Bid%3A%22ES-CL%22%7D%2C%7Bid%3A%22ES-CM%22%7D%2C%7Bid%3A%22ES-CN%22%7D%2C%7Bid%3A%22ES-CT%22%7D%2C%7Bid%3A%22ES-EX%22%7D%2C%7Bid%3A%22ES-GA%22%7D%2C%7Bid%3A%22ES-RI%22%7D%2C%7Bid%3A%22ES-MD%22%7D%2C%7Bid%3A%22ES-MC%22%7D%2C%7Bid%3A%22ES-NC%22%7D%2C%7Bid%3A%22ES-IB%22%7D%2C%7Bid%3A%22ES-PV%22%7D%2C%7Bid%3A%22ES-VC%22%7D--%3E%0A%0A%09%3C%2Fdefs%3E%0A%09%3Cg%3E%0A%09%09%3Cpath%20fill%3D%22white%22%20stroke%3D%22none%22%20id%3D%22ES-AN%22%20title%3D%22Andalusia%22%20%20d%3D%22M438.16%2C248.99l-0.01%2C0.64l-1.23%2C0.51l-0.44%2C1.01l-1.72%2C0.46l-2.19%2C-2.7l-1.48%2C-1.17l-1.33%2C-0.24l-1.63%2C1.04l-1.35%2C-0.9l0.35%2C0.36l-0.44%2C-0.32l-2.25%2C0.65l-1.68%2C3.23l-0.68%2C0.73l-1.44%2C0.57l-1.91%2C0.06l-1.17%2C-0.81l-0.95%2C0.35l-2.01%2C-1.94l-1.45%2C0.48l-7.49%2C-0.55l-2.3%2C0.53l-0.72%2C0.81l-1.5%2C0.69l-1.64%2C-0.11l-1.26%2C-0.95l0.11%2C0.23l-0.9%2C0.12l-1.26%2C-0.99l-1.5%2C-0.09l-0.55%2C0.58l-1.03%2C-0.11l-0.38%2C0.46l-0.55%2C-0.62l-0.48%2C0.27l-1.83%2C-0.84l-3.32%2C0.95l-3.05%2C-0.75l-0.99%2C0.82l-2.11%2C0.31l-3.96%2C0.11l-1.82%2C-0.38l-0.58%2C0.53l0.04%2C-0.39l-2.68%2C4.01l-0.6%2C0.61l-1.92%2C0.69l-0.9%2C1.82l-2.84%2C0.77l-2.97%2C-0.73l-1.61%2C0.02L358%2C260.4l-2.04%2C0.29l-2.02%2C1.19l-0.61%2C-0.03l-1.15%2C1.33l-0.77%2C2.24l-1.85%2C2.64l-0.62%2C2.51l-0.7%2C-0.04l-0.58%2C-0.73l-1.08%2C0.11l-0.6%2C1.16l0.46%2C2.38l-0.92%2C0.69l-0.59%2C-0.13l-3.3%2C1.59l-0.99%2C-1.41l-1.16%2C-0.62l-0.99%2C0.21l-1.52%2C-0.93l-0.52%2C0.33l-1.72%2C-2.25l-1.54%2C-1.3l-3.24%2C0.08l-1.86%2C-3.46l-1.04%2C-0.39l-1.01%2C-2.36l-1%2C-0.91l-1.97%2C-4.35l-0.78%2C-0.16l1.04%2C-0.51l-0.32%2C0.33l0.35%2C0.1l0.06%2C-0.32l-0.12%2C0.42l0.52%2C1l0.13%2C-0.39l0.08%2C0.25l0.74%2C-1.3l0.23%2C-0.92l-0.25%2C-0.46l-1%2C0.05l-0.92%2C-1.27l-0.61%2C0.18l0.28%2C-0.18l-0.5%2C-0.23l0.09%2C0.48l-0.5%2C-0.53l-0.37%2C0.36l-0.99%2C-0.64l-1.33%2C-3.52l2.32%2C-1.85l-1.11%2C-0.65l-1.29%2C-3.12l-2.24%2C-2.67l-6.37%2C-4.23l-2.78%2C-1.28l-1.89%2C-1.49l0.6%2C0.96l2.21%2C1.81l-3.02%2C-2.61l-0.65%2C-0.08l0.39%2C0.42l-0.34%2C-0.02l-2.69%2C-1.23l-7.37%2C0.57l-0.99%2C0.79l-0.97%2C-0.38l-0.3%2C-1.66l-0.5%2C-0.67l0.32%2C-0.8l-0.56%2C-1.25l0.03%2C-2.71l-0.62%2C-0.66l0.5%2C-0.32l-0.66%2C-1.73l0.17%2C-0.59l-0.57%2C-0.38l-0.21%2C-0.84l-0.54%2C-0.06l-0.33%2C-1.05l0.42%2C-0.2l0.1%2C-1.55l1.36%2C-1.49l0.92%2C-3.74l0.75%2C-0.23l2.54%2C-2.58l0.53%2C-1.92l0.71%2C-1.01l-0.09%2C-1.9l1.55%2C-0.7l1.97%2C-0.01l0.11%2C-0.89l0.67%2C-0.48l1.1%2C0.84l1.47%2C-0.13l0.57%2C-2.79l0.94%2C-1.72l-0.38%2C-0.21l0.03%2C-0.51l0.92%2C-1.15l0%2C0l2.32%2C1.04l1.38%2C-0.04l-0.44%2C2.28l1.05%2C-0.02l0.03%2C0.43l0.63%2C0.27l0.72%2C-0.31l1.94%2C0.35l0.56%2C-0.27l0.69%2C0.73l0%2C0l0.43%2C0.52l0%2C0l0.12%2C1.33l0.66%2C-0.2l0%2C0l0.32%2C0l0%2C0l1.94%2C0.75l0.31%2C-0.21l-0.16%2C-0.61l0.73%2C-0.58l-0.25%2C-0.32l1.03%2C-0.1l1.24%2C0.32l0.28%2C1.15l0.74%2C0.63l0%2C0l0.13%2C0.05l0%2C0l0.62%2C0.63l1.4%2C0.25l0.37%2C0.41l1.03%2C-0.1l0.56%2C0.74l1.77%2C-1.51l1.78%2C-0.46l2.67%2C0.09l0.49%2C-1.78l0.71%2C-0.72l-0.57%2C-0.73l0.08%2C-0.58l1.24%2C-0.93l0.08%2C-0.79l0.71%2C-0.56l1.41%2C-0.1l0.49%2C-0.38l0.69%2C0.17l0.78%2C-0.56l1.13%2C0.53l0.04%2C0.73l-0.26%2C-0.36l-0.31%2C0.17l0.26%2C0.54l-1.24%2C0.79l0.19%2C1.39l0.77%2C0.23l1.93%2C-1.93l1.42%2C0.22l0.19%2C-0.64l1.03%2C-0.44l-0.15%2C-0.77l0.35%2C-0.66l0%2C0l0.1%2C-0.05l0%2C0l0.04%2C-2l-1.3%2C-2.28l0.44%2C-1.28l-0.74%2C-0.71l0.03%2C-0.55l1.01%2C-1.66l0.72%2C-0.46h0.96l0.13%2C-0.72l1.85%2C-1.25l0%2C0l-0.11%2C-0.26l0%2C0l0.39%2C-0.67l0.47%2C0.26l-0.22%2C-0.5l0.62%2C-1.03l1.7%2C0.17l-0.09%2C-0.51l0.52%2C-0.64l0.97%2C-0.5l0.88%2C-1.1l0.25%2C0.26l0.15%2C-0.63l0.22%2C0.38l0.1%2C-0.35l0.33%2C0.27l-0.01%2C-0.53l0.47%2C-0.06l0%2C0l0.04%2C-0.08l0%2C0l-0.46%2C-1.34l2.35%2C0.36l1.4%2C-0.77l0%2C0l0.99%2C0.43l0.21%2C0.78l1.57%2C0.43l1.88%2C-0.08l0.51%2C2.45l4.1%2C1.41l0.12%2C0.67l1.02%2C0.17l1.18%2C0.89l0.78%2C1.27l0.22%2C-0.28L370%2C191l0.2%2C0.5l0.48%2C-0.18l2.39%2C2.81l4.49%2C2l0.49%2C-0.13l-0.25%2C-1.13l0.37%2C-0.69l3.64%2C0.72l5.87%2C0.38l1.61%2C-0.2l0.67%2C-0.63l0.19%2C-0.79l0.67%2C-0.2l0%2C0l0.5%2C-0.16l0%2C0l1.14%2C0.39l0.27%2C-0.35l3.12%2C1.06l0.73%2C-0.38l0.16%2C-1.5l0.38%2C-0.07l0.85%2C0.31l0.21%2C1.12l1.64%2C0.38l1.2%2C-0.3l1.31%2C-1.18l-0.04%2C-0.68l0%2C0l0.11%2C-0.31l0%2C0l1.31%2C-0.42l0%2C0l0.15%2C0.07l0%2C0l1.21%2C0.74l3.8%2C0.64l1.93%2C-1.33l1.74%2C2.39l0.23%2C-1.48l0.75%2C-0.63l1.66%2C0.01l0.63%2C0.57l0.54%2C-0.8l0.63%2C-0.34l0.21%2C0.26l0%2C-0.34l1.06%2C-0.51l0.11%2C-0.43l0.2%2C0.17l0.29%2C-0.77l2.58%2C1.27l1.79%2C-0.62l0%2C0l0.25%2C0l0%2C0l0.86%2C0.78l-0.11%2C2.64l2.44%2C0.62l-0.06%2C3.28l1.19%2C0.55l0.16%2C0.72l-0.5%2C1.68l0.2%2C1.08l-2.91%2C3.53l0.75%2C0.44l0%2C0h0.35l0%2C0l2.49%2C1.32l2.22%2C0.2l0%2C0l1.11%2C0.78l1.25%2C2.23l2.19%2C1.7l1.31%2C-0.41l1.07%2C0.94l0.6%2C-0.35l1.11%2C0.51l0.44%2C-0.39l0.49%2C0.21l0%2C0l0.17%2C-0.01l0%2C0l0.2%2C0.26l-0.57%2C0.79l-0.37%2C2.29l0.37%2C1.65l-0.47%2C0.92l0.3%2C1.64l0%2C0l0.18%2C0.19l0%2C0l4.08%2C6.6l0.98%2C0.72l-0.04%2C-0.62l2.05%2C0.37l2.96%2C2.32l0%2C0l-1.34%2C0.7l-0.88%2C1.64l-2.49%2C2.7l-1.34%2C5.33l-1.4%2C2.71l0.13%2C1.37l-0.29%2C0.42l-0.91%2C0l-0.72%2C1.26l-0.63%2C0.13l-0.35%2C0.47l0.11%2C1.39l-1.07%2C0.51L438.16%2C248.99z%22%2F%3E%0A%09%09%3Cpath%20fill%3D%22white%22%20stroke%3D%22none%22%20id%3D%22ES-AR%22%20title%3D%22Aragon%22%20%20d%3D%22M443.97%2C66.05L444.25%2C66.6L446.12%2C66.57L447.55%2C67.96L449.25%2C67.65L451.87%2C69.48L451.87%2C69.48L452.53%2C69.61L452.53%2C69.61L453.05%2C69.45L453.05%2C69.45L453.37%2C69.15L453.37%2C69.15L455.88%2C69.3L456.64%2C68.4L456.55%2C67.91L457.74%2C65.71L458.67%2C64.78L458.51%2C63.68L458.51%2C63.68L458.23%2C63.71L458.23%2C63.71L457.39%2C63.69L457%2C62.47L456.12%2C61.74L456.31%2C59.75L455.63%2C58.31L456.33%2C56.34L456.13%2C55.68L458.02%2C53.39L457.88%2C52.79L457.22%2C52.52L457.71%2C50.84L459.47%2C48.97L459.14%2C47.19L459.78%2C45.95L460.74%2C46.48L461.31%2C46.23L461.31%2C46.23L461.45%2C46.23L461.45%2C46.23L461.49%2C45.16L462.67%2C44.37L462.11%2C43.91L462.71%2C43.93L462.83%2C42.57L465.89%2C42.61L465.9%2C40.99L466.28%2C40.64L467.82%2C40.53L469.08%2C39.05L469.69%2C39.06L469.7%2C38.42L470.67%2C38.34L471.13%2C37.45L470.8%2C37L470.91%2C35.24L471.91%2C34.45L471.99%2C33.19L472.93%2C32.48L474.5%2C32.55L474.5%2C32.55L474.27%2C33.4L475.23%2C34.05L475.73%2C33.83L476.29%2C34.72L477.78%2C35.8L477.82%2C36.73L478.72%2C36.72L478.75%2C37.63L479.17%2C37.79L479.4%2C37.23L479.83%2C37.21L479.89%2C36.56L480.5%2C35.95L482.18%2C37.16L483.04%2C36.7L483.74%2C36.93L484.74%2C35.6L485.33%2C35.71L485.67%2C35.15L487.16%2C36.21L487.57%2C36.13L487.7%2C36.66L489.08%2C37.46L489.82%2C37.05L491.3%2C39.91L492.31%2C40.02L492.5%2C40.85L493.76%2C41.22L494.41%2C41.06L494.58%2C40.62L495.55%2C40.81L496.29%2C40.13L497.27%2C40.28L498.59%2C39.82L498.98%2C39.3L501.25%2C40.08L501.36%2C40.91L502.19%2C41.64L502.91%2C41.28L503.03%2C40.49L503.98%2C39.77L505.68%2C41L507.22%2C40.66L508.26%2C40.97L508.55%2C40.55L510.16%2C40.84L510.44%2C40.45L512.18%2C40.98L512.18%2C40.98L512.29%2C41.24L512.29%2C41.24L512.51%2C41.38L512.51%2C41.38L513.12%2C42.2L513.39%2C43.54L515.07%2C43.96L514.38%2C46.41L514.63%2C46.79L514.2%2C46.6L513.84%2C47.05L513.8%2C47.57L514.33%2C47.85L513.65%2C48.51L513.31%2C48.25L513.01%2C48.57L514.49%2C52.27L513.87%2C52.96L515.15%2C53.48L514.34%2C54.03L514.99%2C54.58L513.31%2C59.46L513.19%2C60.06L513.65%2C60.38L513.08%2C60.86L513.32%2C62.09L512.45%2C64.68L512.06%2C64.92L512.06%2C66.43L511.73%2C67.05L511.61%2C66.66L511.07%2C66.84L510.72%2C67.83L510.23%2C67.62L509.56%2C68.67L510.77%2C69.33L510.46%2C69.4L510.37%2C70.54L510.77%2C71.05L510.05%2C71.36L510.03%2C71.78L509.37%2C71.75L509.04%2C72.9L508.23%2C72.88L507.4%2C73.64L506.98%2C74.93L505.11%2C75.18L505.02%2C76.11L504.71%2C75.82L503.13%2C78.03L503.09%2C78.71L503.96%2C79.76L503.75%2C80.92L505.17%2C81.16L505.88%2C80.83L506.41%2C82.97L505.05%2C84.86L503.54%2C85.07L503.88%2C86.28L502.94%2C88.29L504.38%2C89.8L503.68%2C90.69L504.25%2C91.12L504.14%2C91.64L504.73%2C92.58L504.52%2C94.09L504.13%2C94.04L504.08%2C94.51L502.94%2C94.57L502.22%2C96.94L501.1%2C97.21L500.93%2C97.91L500.03%2C97.65L499.69%2C98.05L499.7%2C99.48L500.21%2C99.57L500.51%2C100.54L500.17%2C101L500.54%2C100.82L500.53%2C101.27L500.9%2C101.06L501.79%2C101.78L501.3%2C101.97L501.9%2C103.18L501.9%2C103.18L501.85%2C103.46L501.85%2C103.46L502.19%2C103.68L501.1%2C105.5L501.1%2C105.5L501.13%2C105.7L501.13%2C105.7L500.74%2C106.77L501.78%2C109L500.59%2C110.21L500.45%2C110.91L499.02%2C111.35L498.97%2C111.83L498.58%2C111.52L498.83%2C112.09L498.83%2C112.09L498.21%2C112.61L497.15%2C112.32L495.31%2C113.59L495.31%2C113.59L494.99%2C113.48L494.99%2C113.48L494.67%2C112.47L494.67%2C112.47L494.66%2C112.36L494.66%2C112.36L494.12%2C112.19L494.12%2C112.19L493.58%2C112.22L493.58%2C112.22L492.49%2C112.31L491.26%2C111.73L490.29%2C110.87L490.27%2C110.25L488.86%2C110.3L487.92%2C111.84L487.76%2C113.61L485.83%2C114.71L485.22%2C114.02L483.89%2C114.52L484.15%2C116.39L485.39%2C116.76L486.23%2C116.51L486.04%2C119.92L486.69%2C120.48L486.81%2C121.28L485.13%2C121.96L484.78%2C122.5L486.41%2C124.45L486.56%2C125.24L484.97%2C126.15L484.23%2C127.38L483.6%2C127.35L483.3%2C127.76L483.77%2C128.84L482.59%2C129.56L480.79%2C130.11L479.4%2C129.27L478.45%2C133.32L477.62%2C133.71L477.12%2C134.53L477.48%2C135.69L477.04%2C135.56L475.67%2C136.62L473.7%2C136.56L472.97%2C138.4L471.5%2C138.99L471.45%2C140.88L472.57%2C142.38L470.54%2C143.58L469.39%2C142.71L469.69%2C142.08L469.35%2C141.1L469.59%2C140.34L469.15%2C139.45L468.83%2C139.73L467.32%2C138.88L465.05%2C138.96L464.5%2C139.34L463.85%2C139.2L463.63%2C139.57L463.16%2C139.24L463.16%2C139.24L462.53%2C137.79L462.53%2C137.79L464.75%2C136.88L465.08%2C136.41L464.91%2C135.72L463%2C134.18L460.35%2C134.05L460.35%2C133.03L459.54%2C132.53L459.1%2C131.48L459.1%2C131.48L458.93%2C131.05L458.93%2C131.05L458.9%2C130.73L458.36%2C131.19L458.37%2C132.97L457.92%2C133.17L457.92%2C133.17L457.43%2C133.6L457.43%2C133.6L456.81%2C133.3L456.32%2C133.5L456.32%2C133.5L456.02%2C133.32L456.02%2C133.32L454.74%2C133.14L454.74%2C133.14L455.03%2C131.24L454.07%2C131.65L453.12%2C131.01L452.25%2C131.46L448.22%2C127.19L447.41%2C128.35L447.17%2C127.48L447.42%2C126.91L448.03%2C126.86L447.37%2C126.1L447.37%2C126.1L447.21%2C126.01L447.21%2C126.01L445.88%2C124.33L445.15%2C124.04L445.18%2C123.66L445.4%2C123.34L445.64%2C123.56L446.73%2C121.64L448.14%2C120.85L447.89%2C119.17L448.13%2C117.73L448.66%2C117.17L450.7%2C118.22L452.12%2C117L451.64%2C116.37L452.39%2C113.79L451.73%2C111.95L452.27%2C111.2L452.34%2C109.94L451.86%2C108.7L451.41%2C108.61L450.11%2C106.91L450.45%2C105.19L450.45%2C105.19L450.2%2C104.61L450.2%2C104.61L449.34%2C103.85L449.34%2C103.85L449.03%2C103.36L449.03%2C103.36L445.17%2C99.36L443.77%2C98.89L442.49%2C97.67L442.49%2C97.67L442.15%2C97.77L442.15%2C97.77L440.82%2C96.38L438.28%2C97.23L438.28%2C97.23L437.54%2C96.33L435.77%2C95.89L434.98%2C92.11L435.53%2C90.54L435.36%2C89.8L436.41%2C89.19L437.05%2C86.5L438.81%2C87.15L438.59%2C88.29L438.99%2C88.72L441.44%2C87.89L441.47%2C87.4L441.01%2C87.27L441.06%2C85.92L440.31%2C85.03L440.7%2C82.88L439.94%2C81.63L439.99%2C80.91L441.85%2C80.94L442.59%2C79.67L442.59%2C79.67L442.83%2C79.53L442.83%2C79.53L443.2%2C79.51L443.63%2C78.67L445.01%2C78.59L444.92%2C77.74L445.92%2C76.37L445.01%2C75.93L445.13%2C75.31L443.76%2C74.02L444.68%2C72.65L444.72%2C71.69L443.72%2C69.83L443.67%2C67.53L443.67%2C67.53z%22%2F%3E%0A%09%09%3Cpath%20fill%3D%22white%22%20stroke%3D%22none%22%20id%3D%22ES-AS%22%20title%3D%22Asturias%22%20%20d%3D%22M335.23%2C5.06l0.33%2C0.63l1.35%2C0.44l-0.23%2C0.53l0.59%2C0.36l0.3%2C0.88l2.14%2C0.43l-0.42%2C0.37l-0.22%2C-0.24l0.13%2C0.63l0.34%2C-0.27l-0.32%2C0.53l0.64%2C0.08l0.23%2C-0.33l0.47%2C0.29l0.77%2C-0.59l0.69%2C0.38l2.05%2C-0.18l0.61%2C0.31l2.39%2C-0.4l0.51%2C0.93l0.44%2C-0.34l2.11%2C0.16l2.16%2C2.3l2.5%2C-0.39l3%2C0.98l2.38%2C-0.15l1.41%2C0.72l0.96%2C-0.12l0.1%2C0.47l0.6%2C-0.22l3.18%2C1.18l2.08%2C0.46l2.9%2C0.05l0%2C0l0.03%2C0.49l-0.75%2C0.9l0.59%2C1.63l-0.14%2C1.27l-0.71%2C0.36l-0.12%2C-0.66l-1.44%2C-0.5l-0.71%2C1.2l-2.62%2C0.39l0.27%2C0.84l-0.48%2C1.74l-1.1%2C-0.19l-0.89%2C0.38l0%2C0l-0.14%2C-0.07l0%2C0l-0.61%2C0.08l0%2C0l-0.83%2C-1.64l-1.15%2C-0.39l-1.44%2C0.97l-0.87%2C1.39l-0.67%2C-0.41l-1.46%2C0.13l-0.72%2C2.92l-1.04%2C-0.04l-0.21%2C-0.42l-1.61%2C0.79l0%2C0l-0.08%2C0.18l0%2C0l-3.14%2C0.36l-0.52%2C-0.58l-0.68%2C-0.02l-0.42%2C0.31l-0.19%2C1.37l-2.41%2C-0.2l-0.38%2C1.25l-3.85%2C-0.49l-1.51%2C-0.86l-1.02%2C0.57l-1.07%2C2.06l0.08%2C0.6l-1.16%2C0.25l-0.99%2C0.03l-0.54%2C-0.65l-0.76%2C0.02l0.08%2C-0.5l-0.72%2C0.04l-1.18%2C-1.01l-0.47%2C-1.69l-1.26%2C0.37l-1.64%2C-0.75l-0.47%2C1.63l-1.08%2C0.44l-1.08%2C-1.02l-1.03%2C0.02l-0.35%2C1.37l-1.01%2C-0.26l-0.55%2C-0.71l-0.3%2C0.34l-0.85%2C-0.18l-0.11%2C-0.52l-0.74%2C-0.5l-0.39%2C0.66l-0.64%2C0.12l0.11%2C0.65l-0.5%2C0.11l-0.33%2C1.1l-0.38%2C-0.16l-0.24%2C0.42l-0.7%2C-0.37l0%2C0l-0.18%2C0.01l0%2C0l0.13%2C0.93l1.04%2C0.13l-0.01%2C0.86l-1.15%2C0.24l-0.35%2C0.51l-0.59%2C-0.3l-0.88%2C0.55l-1.86%2C-0.44l-2.08%2C0.1l-0.95%2C0.2l-1.02%2C1.3l-0.36%2C-0.04l0.05%2C-0.6l-1.39%2C-0.58l0%2C0l-0.46%2C-0.46l0.14%2C-1.16l-0.94%2C-1.13l-1.02%2C-0.03l-1.27%2C-1.72l-0.05%2C1.48l-0.41%2C0.02l-0.68%2C-0.93l0.43%2C-0.77l0.44%2C0.24l-0.03%2C-0.98l0.74%2C-0.94l0.67%2C0.45l0.54%2C-0.63h0.62l1.12%2C-1.16l0.19%2C-0.77l-0.91%2C-1.06l-0.79%2C0.19l0.05%2C0.35l-1.47%2C0.92l-0.5%2C-0.08l-0.64%2C-1.14l0.42%2C-0.84l-0.15%2C-0.58l-0.82%2C-0.16l-0.25%2C-0.57l-0.3%2C0.33l-1.11%2C-1.12l-0.26%2C-0.89l0.27%2C-1.34l-1.08%2C0.06l-0.82%2C-1.01l0.06%2C-1.53L300%2C15.3l-0.59%2C0.33l-0.49%2C-0.3l0.12%2C-0.68l0%2C0L299%2C14.52l0%2C0l0.01%2C-0.94l1.89%2C0.1l0.38%2C-1.05l0.93%2C-0.65l0%2C0l0.62%2C-0.95l-0.28%2C-0.37l0.31%2C-0.81l0.7%2C0.06l-0.68%2C-0.55l0.06%2C-0.56l1.47%2C0.13l0.6%2C-0.55l0.16%2C0.21l0.05%2C-0.46l1.49%2C0.2l0.35%2C0.43l0.67%2C-0.49l1.17%2C0.61l1.77%2C-0.44l0.58%2C0.67l0.38%2C-0.54l0.96%2C0.13l1.31%2C-0.46l0.22%2C0.38l0.41%2C-0.14l0.1%2C0.42l1.54%2C-0.03l0.24%2C0.38l1.65%2C-0.12l0.08%2C-0.81l1.15%2C0.67l0.9%2C-0.27l1.12%2C0.34l2.69%2C-1.01l0.32%2C-0.63l0.63%2C0.58l0.32%2C-0.25l0.16%2C0.47l0.4%2C-0.24l-0.01%2C0.56l0.75%2C-0.17l1.23%2C0.53l2.63%2C-1.24l0.64%2C0.58l1.04%2C-0.25l0.51%2C-0.56l-0.26%2C-0.14l0.88%2C-0.34l0%2C-0.65l0.93%2C-0.02l0.6%2C-0.47l0.03%2C-0.71L335.23%2C5.06z%22%2F%3E%0A%09%09%3Cpath%20fill%3D%22white%22%20stroke%3D%22none%22%20id%3D%22ES-CB%22%20title%3D%22Cantabria%22%20%20d%3D%22M404.86%2C22.15l-0.6%2C-2.02l1.09%2C-0.51l0.47%2C0.26l-0.54%2C1.05l0.03%2C1.05l0%2C0L404.86%2C22.15zM396.64%2C10.44l0.02%2C0.42l0.98%2C-0.27l0.31%2C0.62l0.6%2C-0.11l0.39%2C0.79l1.92%2C0.35l0.19%2C0.78l-0.8%2C0.17l0.75%2C1.02l0.48%2C-0.31l1.22%2C0.3l1.16%2C-0.28l-0.05%2C0.72l0.59%2C-0.35l2.04%2C0.48l0.93%2C1.23l1.09%2C0.4l0%2C0l-0.11%2C1.94l-0.91%2C0.12l-0.5%2C0.55l-0.42%2C-0.93l-1.46%2C0.7l-0.43%2C-0.39l-0.75%2C0.29l-0.25%2C-0.3l-0.2%2C0.84l-1.19%2C0.29l-0.42%2C0.89l-1.39%2C0.38l0.22%2C0.71l0%2C0l0.18%2C0.28l0%2C0l0.46%2C2.8l0%2C0l-2.01%2C0.01l-2.22%2C-0.71l-0.82%2C0.09l-0.23%2C-0.68l-1.04%2C-0.44l-0.91%2C1.39l0%2C0l-0.02%2C0.17l0%2C0l-0.57%2C0.84l-1.32%2C0.57l-0.33%2C0.75l-1.79%2C0l-0.71%2C-0.35l0.16%2C1.82l-1.15%2C-0.01L387.61%2C29l-0.96%2C0.51l-0.99%2C2.53l0.45%2C0.83l1.17%2C-0.13l-0.07%2C0.57l1.78%2C-2.06l1%2C0.99l-0.97%2C1.09l-1.21%2C-0.48l0.46%2C0.84l-0.83%2C-0.01l0.7%2C0.3l-0.41%2C0.55l0%2C0l-0.04%2C0.21l0%2C0l1.1%2C0.33l0.23%2C-1.35l0.75%2C0.36l0.58%2C1.64L390.19%2C37l-1.12%2C0.46l-0.82%2C-0.66l-0.48%2C1.35l-0.55%2C-0.21l-1.28%2C0.56l-0.12%2C-0.38l-0.46%2C0l-0.16%2C-2.3l-0.42%2C0.44l0.14%2C0.45l-0.46%2C0.23l0.13%2C0.42l-0.56%2C0.28l0.08%2C0.59l-0.96%2C0.16l-0.48%2C-1.09l-1.36%2C0.07l-0.91%2C-0.76l-0.04%2C-0.42l0.67%2C-0.61l0.61%2C0.19l0.28%2C-0.9l-0.61%2C-0.51l-1.36%2C0.98l-0.67%2C-0.45l0.07%2C-1.98l-0.4%2C-0.22l-0.06%2C-1.49l-2.95%2C-0.65l-1.46%2C-2.27l-1.7%2C-1.01l-0.41%2C0.82l-1.16%2C-0.26l-1.03%2C1.01l-1.28%2C-0.61l-0.88%2C0.7l-1.21%2C-0.34l-1.44%2C0.2l-0.14%2C-1.28l-0.63%2C-0.02l-0.01%2C-0.71l-1.79%2C-1l-0.51%2C-0.88l0.44%2C-1.18l-0.46%2C-0.61l0.34%2C-0.31l0%2C0l0.61%2C-0.08l0%2C0l0.14%2C0.07l0%2C0l0.89%2C-0.38l1.1%2C0.19l0.48%2C-1.74l-0.27%2C-0.84l2.62%2C-0.39l0.71%2C-1.2l1.44%2C0.5l0.12%2C0.66l0.71%2C-0.36l0.14%2C-1.27l-0.59%2C-1.63l0.75%2C-0.9l-0.03%2C-0.49l0%2C0l1.12%2C0.17l1.42%2C-0.35l0.98%2C0.28l1.24%2C-0.55l0.44%2C0.6l1.16%2C0.04l2.86%2C-0.49l1.71%2C-0.66l0.82%2C-0.73l0.74%2C0.18l0.21%2C-0.44l0.34%2C0.43l0.38%2C-0.59l1.48%2C0.4l-0.36%2C-0.13L386.9%2C12l2.91%2C-0.31l0.72%2C-0.6l0.74%2C0.12l-0.06%2C0.52l0.63%2C0.39l-1.06%2C0.24l-0.9%2C0.71l-0.01%2C0.4l0.65%2C0.23l-0.11%2C0.85l0.25%2C-0.54l0.12%2C0.27l0.63%2C-0.4l-0.35%2C-0.41l0.37%2C-0.04l0.14%2C-0.59l0.73%2C-0.07l-0.67%2C-0.35l1.01%2C0.04l0.34%2C-0.55l0.92%2C-0.06l1.16%2C-0.87l0.85%2C0.06L396.64%2C10.44zM382.39%2C36.04l0.04%2C-0.05l0%2C0l0.02%2C0l0%2C0l0.36%2C0.18l0%2C0l0.11%2C0.78l-0.34%2C0.24l-0.27%2C-0.82l0%2C0L382.39%2C36.04zM380.84%2C36.16l0.15%2C0.16l0%2C0l-0.03%2C0.17l0%2C0l-0.3%2C0.12l0%2C0l-0.19%2C-0.26l0%2C0l-0.04%2C-0.1l0%2C0l0.02%2C-0.09l0%2C0l0.1%2C-0.04l0%2C0L380.84%2C36.16z%22%2F%3E%0A%09%09%3Cpath%20fill%3D%22white%22%20stroke%3D%22none%22%20id%3D%22ES-CL%22%20title%3D%22Castile%20and%20Leon%22%20%20d%3D%22M414.24%2C44.04l0.33%2C0.41l-0.51%2C-0.2l0%2C0L414.24%2C44.04zM412.83%2C44.18l-0.19%2C0.1l0%2C0l0.03%2C-0.17l0%2C0l0.07%2C-0.11l0%2C0l-0.02%2C-0.13l0%2C0l-0.01%2C-0.04l0%2C0l0.27%2C-0.03l0%2C0l-0.02%2C0.2l0%2C0L412.83%2C44.18zM417.29%2C37.56l0.08%2C-0.05l0%2C0l2.5%2C-0.29l2.39%2C1.05l1.1%2C-0.19l0.38%2C0.73l0.83%2C-0.45l-0.42%2C1.43l-0.4%2C0.47l-0.3%2C-0.14l-0.24%2C0.69l0.87%2C1.04l1.48%2C-0.57l0.15%2C1.39l-0.84%2C0.27l-0.17%2C-0.39l-2.21%2C0.07l-0.63%2C-0.91l-1.23%2C-0.06l-0.38%2C0.44l-1.34%2C-0.15l-0.48%2C-1.18l-1.07%2C-0.38l-1.22%2C-1.14l0.82%2C-1.54l0%2C0l0.16%2C-0.47l0%2C0l0.1%2C0.17l0%2C0L417.29%2C37.56zM380.63%2C36.15l0.21%2C0.02l0%2C0l0.09%2C0.04l0%2C0l0%2C0l0%2C0l0.06%2C0.11l0%2C0l-0.03%2C0.17l0%2C0l-0.3%2C0.12l0%2C0l-0.19%2C-0.26l0%2C0l-0.04%2C-0.1l0%2C0l0.02%2C-0.09l0%2C0l0.1%2C-0.04l0%2C0L380.63%2C36.15zM382.65%2C36.09l0.17%2C0.08l0%2C0l0.11%2C0.78l-0.34%2C0.24l-0.27%2C-0.82l0%2C0l0.12%2C-0.38l0%2C0l0.02%2C0l0%2C0L382.65%2C36.09zM308.53%2C32.71l1.39%2C0.58l-0.05%2C0.6l0.36%2C0.04l1.02%2C-1.3l0.95%2C-0.2l2.08%2C-0.1l1.86%2C0.44l0.88%2C-0.55l0.59%2C0.3l0.35%2C-0.51l1.15%2C-0.24l0.01%2C-0.86l-1.04%2C-0.13l-0.13%2C-0.93l0%2C0l0.18%2C-0.01l0%2C0l0.7%2C0.37l0.24%2C-0.42l0.38%2C0.16l0.33%2C-1.1l0.5%2C-0.11l-0.11%2C-0.65l0.64%2C-0.12l0.39%2C-0.66l0.74%2C0.5l0.11%2C0.52l0.85%2C0.18l0.3%2C-0.34l0.55%2C0.71l1.01%2C0.26l0.35%2C-1.37l1.03%2C-0.02l1.08%2C1.02l1.08%2C-0.44l0.47%2C-1.63l1.64%2C0.75l1.26%2C-0.37l0.47%2C1.69l1.18%2C1.01l0.72%2C-0.04l-0.08%2C0.5l0.76%2C-0.02l0.54%2C0.65l0.99%2C-0.03l1.16%2C-0.25l-0.08%2C-0.6l1.07%2C-2.06l1.02%2C-0.57l1.51%2C0.86l3.85%2C0.49l0.38%2C-1.25l2.41%2C0.2l0.19%2C-1.37l0.42%2C-0.31l0.68%2C0.02l0.52%2C0.58l3.14%2C-0.36l0%2C0l0.08%2C-0.18l0%2C0l1.61%2C-0.79l0.21%2C0.42l1.04%2C0.04l0.72%2C-2.92l1.46%2C-0.13l0.67%2C0.41l0.87%2C-1.39l1.44%2C-0.97l1.15%2C0.39l0.83%2C1.64l0%2C0l-0.34%2C0.31l0.46%2C0.61l-0.44%2C1.18l0.51%2C0.88l1.79%2C1l0.01%2C0.71l0.63%2C0.02l0.14%2C1.28l1.44%2C-0.2l1.21%2C0.34l0.88%2C-0.7l1.28%2C0.61l1.03%2C-1.01l1.16%2C0.26l0.41%2C-0.82l1.7%2C1.01l1.46%2C2.27l2.95%2C0.65l0.06%2C1.49l0.4%2C0.22l-0.07%2C1.98l0.67%2C0.45l1.36%2C-0.98l0.61%2C0.51l-0.28%2C0.9l-0.61%2C-0.19l-0.67%2C0.61l0.04%2C0.42l0.91%2C0.76l1.36%2C-0.07l0.48%2C1.09l0.96%2C-0.16l-0.08%2C-0.59l0.56%2C-0.28l-0.13%2C-0.42l0.46%2C-0.23l-0.14%2C-0.45l0.42%2C-0.44l0.16%2C2.3l0.46%2C0l0.12%2C0.38l1.28%2C-0.56l0.55%2C0.21l0.48%2C-1.35l0.82%2C0.66l1.12%2C-0.46l0.17%2C-1.29l-0.58%2C-1.64l-0.75%2C-0.36l-0.23%2C1.35l-1.1%2C-0.33l0%2C0l0.04%2C-0.21l0%2C0l0.41%2C-0.55l-0.7%2C-0.3l0.83%2C0.01l-0.46%2C-0.84l1.21%2C0.48l0.97%2C-1.09l-1%2C-0.99l-1.78%2C2.06l0.07%2C-0.57l-1.17%2C0.13l-0.45%2C-0.83l0.99%2C-2.53l0.96%2C-0.51l0.66%2C-0.98l1.15%2C0.01l-0.16%2C-1.82l0.71%2C0.35l1.79%2C0l0.33%2C-0.75l1.32%2C-0.57l0.57%2C-0.84l0%2C0l0.02%2C-0.17l0%2C0l0.91%2C-1.39l1.04%2C0.44l0.23%2C0.68l0.82%2C-0.09l2.22%2C0.71l2.01%2C-0.01l0%2C0l4.46%2C-2.39l0.85%2C0.98l1.48%2C-0.22l0.65%2C0.42l-1.06%2C1.82l0.78%2C0.53l0.29%2C-0.2l0.2%2C0.46l-0.62%2C0.86l0.45%2C0.26l-0.02%2C1.4l-0.95%2C0.29l0.85%2C0.55l2.27%2C0.15l0.67%2C0.8l-0.13%2C0.4l1.68%2C1.18l-1.07%2C1.11l-1.97%2C0.33l-1.54%2C-0.69l0.06%2C-0.6l-2.15%2C-0.57l-1.65%2C2.51l1.92%2C2.05l0.26%2C-0.05l-0.42%2C-0.41l0.82%2C-1.12l0.93%2C0.46l1.05%2C-1.3l0.28%2C0.77l-1.36%2C2.5l0.92%2C0.57l-0.63%2C1.17l2.67%2C-0.29l0.18%2C0.96l0.69%2C-0.05l0%2C0l0%2C0.13l0%2C0l0.99%2C1.23l1.36%2C-0.14l0.76%2C0.52l0.14%2C0.87l0%2C0l-0.07%2C0.07l0%2C0l0.29%2C0.7l0.84%2C0.38l0%2C0l-0.68%2C0.64l-0.37%2C-0.25l-0.38%2C0.3l-0.93%2C-0.72l-1%2C0.13l-0.61%2C-0.35l-0.37%2C0.46l-1.78%2C-0.32l0.63%2C1.91l0%2C0l-0.41%2C0.1l0%2C0l-0.78%2C1.19l-0.8%2C0.43l0.26%2C0.33l0.95%2C-0.19l0.44%2C0.35l-0.11%2C0.95l-0.52%2C0.56l1.33%2C1.54l-0.45%2C0.79l0.18%2C1.99l-0.69%2C-0.95l0.11%2C-0.72l-0.61%2C-0.02l-0.11%2C1.12l0.56%2C0.01l0.58%2C0.91l-1.26%2C0.33l0.22%2C0.85l0%2C0l0.16%2C0.12l0%2C0l-0.31%2C0.45l0.47%2C2.47l-0.39%2C1.19l-0.68%2C0.58l2.6%2C4.05l2.62%2C-0.08l0.59%2C1.78l0%2C0v0.29l0%2C0l0.87%2C0.84l0.83%2C-0.78l1.2%2C-0.24l0.42%2C-2.37l0%2C0l0.07%2C-0.25l0%2C0l0.48%2C-0.56l0.6%2C0.23l0.44%2C-0.26l0.77%2C0.78l-0.07%2C0.73l-1.28%2C1.87l0.3%2C0.85l1.13%2C-0.22l0.82%2C0.66l1.33%2C-0.35l1.18%2C0.39l0.89%2C-2.06l0.89%2C-0.64l0.05%2C-1.63l0.76%2C0.26l0.76%2C-0.31l0.46%2C-0.76l3.27%2C-0.3l1.05%2C0.5l0.38%2C1.55l0.9%2C-0.51l2.92%2C0.16l-0.03%2C0.69l-0.87%2C0.5l1.44%2C2.23l-0.36%2C0.31l0.23%2C1.24l2.67%2C0.65l0%2C0l0.16%2C0.16l0%2C0l0.74%2C0.72l0.5%2C-0.03l2.91%2C-1.74l0%2C0l0.04%2C2.29l1.01%2C1.86l-0.05%2C0.97l-0.91%2C1.36l1.36%2C1.29l-0.12%2C0.62l0.91%2C0.44l-1%2C1.37l0.09%2C0.85l-1.37%2C0.08l-0.43%2C0.85l-0.37%2C0.02l0%2C0l-0.23%2C0.14l0%2C0l-0.74%2C1.27l-1.87%2C-0.03l-0.05%2C0.72l0.75%2C1.25l-0.38%2C2.15l0.75%2C0.9l-0.05%2C1.35l0.46%2C0.13l-0.03%2C0.5l-2.45%2C0.82l-0.4%2C-0.43l0.22%2C-1.14l-1.77%2C-0.65l-0.64%2C2.69l-1.05%2C0.62l0.18%2C0.73l-0.55%2C1.57l0.79%2C3.79l1.77%2C0.44l0.74%2C0.9l0%2C0l-0.3%2C1.2l0.44%2C1.28l-0.25%2C0.33l-2.08%2C-1.8l-1.16%2C1.22l-1.42%2C-0.49l-0.83%2C1.02l-0.81%2C-0.12l-0.84%2C0.5l-0.91%2C-1.04l-1.68%2C1.01l-0.36%2C-0.53l-1.02%2C-0.18l-0.38%2C-1.34l-0.73%2C-0.16l-0.22%2C-1.02l-0.55%2C-0.46l-1.02%2C0.81l-0.57%2C-0.38l0.42%2C-1.03l-1.15%2C-0.23l0.77%2C-0.49l0.1%2C-0.91l-1.08%2C0.31l-0.45%2C-0.85l-1.7%2C-0.41l-0.24%2C-0.79l-1.19%2C0.03l-0.44%2C0.68l-1.12%2C-0.11l-1.28%2C-0.61l-0.11%2C-1.56l-1.03%2C-0.38l-0.91%2C0.47l-0.29%2C0.77l-1.85%2C0.13l-1.17%2C0.54l-3.41%2C-1.07l-1.27%2C0.39l-0.58%2C1.31l-0.49%2C-0.63l-0.49%2C0.65l-0.89%2C-0.12l-0.33%2C0.33l-1.58%2C-0.17l-0.53%2C-0.54l0.42%2C1.01l-0.12%2C1.15l-1.09%2C-0.06l-0.59%2C1.12l-1.1%2C0.48l0%2C0l-0.25%2C0.23l0%2C0l-0.06%2C0.05l0%2C0l-0.31%2C-0.1l0%2C0l-0.31%2C0l0%2C0l0%2C0l0%2C0l-1.36%2C0.18l-1.15%2C0.82l-1.23%2C1.89l-1.71%2C1.05l-1.1%2C1.88l-3.06%2C1.23l-0.79%2C1.38l-0.44%2C0.09l-1.12%2C5l-1.34%2C0.21l-1.15%2C-0.42l-0.73%2C1.59l-1.74%2C2.14l0%2C0l-0.63%2C-0.31l0%2C0l-0.41%2C0.11l0%2C0l-1.44%2C0.23l-0.6%2C0.46l0%2C0l0%2C0l0%2C0l-0.42%2C-0.15l-0.78%2C0.51l-0.05%2C0.6l0%2C0l-0.38%2C0.38l1.18%2C0.32l0%2C0l0.33%2C0.88l-0.3%2C1.37l-0.87%2C0.5l-0.16%2C0.54l0.32%2C2.47l-0.68%2C1.03l0.51%2C0.93l-2.72%2C0.15l-0.56%2C0.73l0.1%2C1.31l-0.6%2C0.33l0.17%2C0.76L371.7%2C127l-0.68%2C-1.03l-0.54%2C0.09l0.48%2C1.74l-1.08%2C1.23l0.24%2C1.23l-0.52%2C0.27l0%2C0l-1.73%2C0.67l-1.05%2C-0.36l-0.18%2C-1.49l-0.43%2C-0.39l0.16%2C-0.76l-1.11%2C0.31l0%2C0l-0.56%2C0.39l0%2C0l-1.21%2C-0.5l-0.37%2C0.77l0.27%2C0.71l-1.79%2C1.25l0%2C0l-0.08%2C0.18l0%2C0l-1.28%2C0.88l-0.15%2C1.23l-1.88%2C0.84l0%2C0l-0.26%2C0.07l0%2C0l-0.31%2C-1.74l-1.34%2C0.29l-0.57%2C0.93l-0.29%2C-0.11l-1.12%2C1.25l-0.8%2C0.21l-0.85%2C0.12l-0.27%2C-0.84l-1.37%2C-0.12l0%2C0l-0.18%2C-0.04l0%2C0l-1.04%2C0.11l0%2C0l-0.6%2C-0.18l0%2C0l-0.19%2C-0.08l0%2C0l-0.88%2C-1.7l-0.05%2C-1.91l0.73%2C-1.64l-2.31%2C0.36l-1.17%2C1.53l-0.7%2C0.34l-1.44%2C0l0%2C0l-0.22%2C-0.07l0%2C0l-0.33%2C-0.21l0%2C0l-0.41%2C-0.21l0%2C0l-0.79%2C-0.17l-0.2%2C-1l-0.78%2C-0.15l-0.21%2C-0.71l-0.9%2C-0.77l-1.27%2C-0.07l-0.73%2C0.48l-0.74%2C-0.21l-0.29%2C-0.38l0.49%2C-0.9l-0.69%2C-1.33l-2.29%2C1.41l-0.69%2C1.46l-1.56%2C-0.5l0%2C0l-0.28%2C-0.19l0%2C0l-0.74%2C-0.53l0%2C0l-0.13%2C-0.18l0%2C0l0.06%2C-0.74l-2.38%2C-0.59l0.6%2C-0.29l-0.1%2C-0.48l0.35%2C-0.28l-0.31%2C-0.15l0.49%2C-0.18l-0.53%2C-0.37l0%2C0l-0.13%2C-0.05l0%2C0l-1.02%2C-0.48l0.33%2C-0.71l-0.78%2C0.21l-0.36%2C-0.79l-1.98%2C-1.04l-3.2%2C1.86l0%2C0l-0.38%2C0.39l0%2C0l-0.18%2C0.71l-1.33%2C0.14l-0.62%2C0.98l-0.66%2C-0.04l-2.22%2C1.12l-0.46%2C0.77l0.16%2C1.04l-0.82%2C0.73l-2.09%2C0.21l-0.74%2C0.76l-0.71%2C-0.96l-1.05%2C1.05l-0.77%2C-0.34l0%2C0l-0.48%2C0l0%2C0l-0.1%2C0.26l-0.76%2C-0.18l-0.87%2C-0.74l0%2C0l0.11%2C-1.1l1.89%2C-1.16l0.29%2C-1.21l-1.49%2C-1.6l-0.31%2C-1.41l1.39%2C-2.24l-0.14%2C-1.37l-1.13%2C-0.66l1.31%2C-3.26l-0.96%2C-3.31l0.39%2C-1.89l-0.27%2C-1.33l0.69%2C-0.13l0%2C-0.52l-0.22%2C-0.8l-1.05%2C-0.68l-0.3%2C-1.74l-1.7%2C-1.87l-0.29%2C-0.93l0.45%2C-0.33l1.49%2C0.41l1.4%2C-0.35l1.42%2C-2.32L310%2C97.77l1.91%2C-1.78l0.21%2C-0.98l1.15%2C-1.36l1.33%2C0.11l0.26%2C-0.39l0.46%2C0.58l1.41%2C-1.32l0.28%2C0.39l0.51%2C-0.13l0.38%2C-0.3l-0.25%2C-0.52l1.12%2C-0.33l0.86%2C-1.72l1.03%2C-0.41l-0.43%2C-0.36l0.08%2C-0.56l0.59%2C-0.31l0.45%2C0.53l0.94%2C-0.3l-0.43%2C-0.86l1%2C-0.83l-0.25%2C-0.6l3.11%2C-4.49L325.35%2C81l-0.79%2C-0.33l-1.7%2C-1.92l-4%2C-0.93l-0.38%2C0.59l-1.14%2C0.4l-1.35%2C-1.06l0.04%2C-1.39l-0.53%2C-0.75l1.43%2C-4.52l-1.5%2C-0.54l0.68%2C-1.74l-1.13%2C-1.24l-0.87%2C0.94l-2.14%2C0.27l-1.41%2C-0.33l-0.64%2C-1.55l-0.75%2C-0.21l-0.82%2C1.71l-3.1%2C-0.03l-0.39%2C-0.84l-0.65%2C-0.2l0%2C0l-0.15%2C-0.78l0.73%2C-1.17l-0.37%2C-1.01l-0.92%2C0.09l-0.65%2C-0.87l0.8%2C-0.39l0.43%2C-1.37l0.97%2C-0.27l0.23%2C-1.58l1.18%2C-0.63l0.41%2C-0.9l1.14%2C-0.44l1.26%2C0.71l0.06%2C-0.56l0%2C0l-0.14%2C-0.3l0%2C0l1.62%2C-2.37l0.15%2C-2.28l-0.9%2C-0.28l-0.39%2C-0.55l-1.07%2C-0.17l-0.58%2C-0.65l0%2C0l0.02%2C-0.08l0%2C0l0.66%2C-0.76l-0.19%2C-0.92l0.41%2C-0.52l-0.42%2C-0.96l-0.85%2C0.24l-2.04%2C-1.24l-0.83%2C0.12l-0.4%2C0.88l-1.71%2C-0.47l0%2C0l-0.5%2C-0.04l0%2C0l-0.55%2C-0.03l0.45%2C-0.79l-0.17%2C-0.88l0.84%2C-1.13l-0.38%2C-0.46l0.04%2C-1.21l1.15%2C-0.56l-1.04%2C-1.91l0.91%2C-1.05l1.04%2C-0.07l0.35%2C-1.07l0.67%2C0.49l1.86%2C-1.72l-0.05%2C-0.53l0.74%2C-0.79l-0.79%2C-1.86l1%2C-0.29l-0.18%2C-0.91L308.53%2C32.71z%22%2F%3E%0A%09%09%3Cpath%20fill%3D%22white%22%20stroke%3D%22none%22%20id%3D%22ES-CM%22%20title%3D%22Castile-La%20Mancha%22%20%20d%3D%22M377.9%2C114.18l0.6%2C-0.46l1.44%2C-0.23l0%2C0l0.41%2C-0.11l0%2C0l0.63%2C0.31l0%2C0l-0.38%2C0.78l0.36%2C1.55l-1.86%2C0.7l0%2C0l-0.45%2C0.04l0%2C0l-0.45%2C-0.13l-0.22%2C-0.79l-0.52%2C0.01l0%2C0l-1.18%2C-0.32l0.38%2C-0.38l0%2C0l1.69%2C-0.1L377.9%2C114.18zM397.91%2C96.65l0.31%2C0l0%2C0l0.31%2C0.1l0%2C0l0.06%2C-0.05l0%2C0l0.25%2C-0.23l0%2C0l1.1%2C-0.48l0.59%2C-1.12l1.09%2C0.06l0.12%2C-1.15l-0.42%2C-1.01l0.53%2C0.54l1.58%2C0.17l0.33%2C-0.33l0.89%2C0.12l0.49%2C-0.65l0.49%2C0.63l0.58%2C-1.31l1.27%2C-0.39l3.41%2C1.07l1.17%2C-0.54l1.85%2C-0.13l0.29%2C-0.77l0.91%2C-0.47l1.03%2C0.38l0.11%2C1.56l1.28%2C0.61l1.12%2C0.11l0.44%2C-0.68l1.19%2C-0.03l0.24%2C0.79l1.7%2C0.41l0.45%2C0.85l1.08%2C-0.31l-0.1%2C0.91l-0.77%2C0.49l1.15%2C0.23l-0.42%2C1.03l0.57%2C0.38l1.02%2C-0.81l0.55%2C0.46l0.22%2C1.02l0.73%2C0.16l0.38%2C1.34l1.02%2C0.18l0.36%2C0.53l1.68%2C-1.01l0.91%2C1.04l0.84%2C-0.5l0.81%2C0.12l0.83%2C-1.02l1.42%2C0.49l1.16%2C-1.22l2.08%2C1.8l0.25%2C-0.33l-0.44%2C-1.28l0.3%2C-1.2l0%2C0l2.54%2C-0.84l1.33%2C1.39l0%2C0l0.34%2C-0.1l0%2C0l1.28%2C1.22l1.4%2C0.47l3.86%2C4.01l0%2C0l0.31%2C0.48l0%2C0l0.87%2C0.76l0%2C0l0.25%2C0.59l0%2C0l-0.34%2C1.71l1.3%2C1.71l0.45%2C0.09l0.48%2C1.24l-0.07%2C1.26l-0.54%2C0.75l0.66%2C1.85l-0.75%2C2.57l0.48%2C0.64l-1.42%2C1.21l-2.04%2C-1.05l-0.53%2C0.56l-0.25%2C1.44l0.25%2C1.67l-1.41%2C0.79l-1.09%2C1.92l-0.23%2C-0.22l-0.23%2C0.32l-0.03%2C0.37l0.73%2C0.29l1.33%2C1.68l0%2C0l0.17%2C0.1l0%2C0l0.66%2C0.76l-0.61%2C0.05l-0.25%2C0.57l0.24%2C0.86l0.82%2C-1.16l4.03%2C4.27l0.87%2C-0.45l0.95%2C0.64l0.96%2C-0.41l-0.3%2C1.9l0%2C0l-0.01%2C0.69l1.19%2C0.86l-0.28%2C0.27l1.22%2C2.72l2.66%2C0.34l0%2C0l0.05%2C0.1l0%2C0l0.72%2C0.23l2.25%2C-0.57l0%2C0l0.63%2C1.45l0%2C0l-1.72%2C0.75l-0.18%2C0.58l0.39%2C0.7l0%2C0l-0.09%2C0.43l0%2C0l-0.46%2C3.35l-1.6%2C2.42l0.35%2C1.4l-0.44%2C0.68l-0.96%2C0.29l0%2C0l-0.73%2C-0.35l0%2C0l-0.78%2C-0.29l-0.93%2C0.79l-1.59%2C3.14l-1.57%2C0.95l0.48%2C0.09l0.1%2C1.64l-0.35%2C0.16l0.24%2C0.63l-0.27%2C0.7l-0.41%2C0.15l0.23%2C0.81l0.63%2C0.09l0%2C0l-0.2%2C0.24l0%2C0h0.6l-0.18%2C0.65l0.61%2C0l-0.26%2C0.32l0.38%2C-0.21l0%2C0l0.07%2C-0.06l0%2C0l0.19%2C0.61l-0.39%2C0.01l0.5%2C0.18l-0.05%2C0.48l0%2C0l-0.12%2C0.06l0%2C0l0.67%2C-0.49l0%2C0l0.06%2C0.16l0%2C0l0.06%2C0.33l0.05%2C-0.65l0.69%2C0.16l-0.29%2C0.31l0.67%2C0.05l0%2C0.44l0.47%2C-0.04l0.84%2C0.77l0.23%2C-0.29l0%2C0l0.18%2C0.05l0%2C0l0.94%2C0.35l0%2C0h0.16l0%2C0l0.57%2C0.07l0%2C0l0.16%2C0.08l0%2C0l0.91%2C0.35l0.32%2C-0.33l1.24%2C0.68l-0.52%2C3.35l-2%2C3.62l-0.21%2C2.11l1.01%2C0.75l2.23%2C3.34l3.01%2C-0.19l0.88%2C-0.54l1.12%2C0.2l0.3%2C1.19l0.66%2C0.59l-0.32%2C1.3l0.35%2C1.11l-0.14%2C1.36l-0.9%2C0.42l1.25%2C2.65l-1.29%2C1.37l-1.74%2C0.03l0%2C0l-2.44%2C-1.91l-0.1%2C-0.95l-1.82%2C-0.56l-1.37%2C0.43l0%2C0l-0.33%2C0.16l0%2C0l-2.54%2C2.08l-0.65%2C-0.92l-0.51%2C0.18l-1.71%2C1.69l-0.11%2C2.33l-0.95%2C0.67l-0.27%2C0.94l0.47%2C1.81l0.05%2C3.72l-3.02%2C2.26l-2.16%2C-0.02l-0.62%2C-1l0%2C0l-0.01%2C-0.14l0%2C0l0.26%2C-0.53l-0.51%2C-0.5l-0.45%2C0.38l-0.72%2C-0.6l-0.69%2C0.06l-0.03%2C0.46l-0.67%2C-0.14l0.3%2C0.46l-3.4%2C2.02l-1.99%2C0.56l-1.77%2C-0.85l-0.5%2C0.37l0%2C0l-0.36%2C0.66l0%2C0l-0.95%2C1.34l-2.68%2C1.17l-1.48%2C3.29l-1.71%2C1.42l-0.27%2C1.41l0%2C0l-2.22%2C-0.2l-2.49%2C-1.32l0%2C0h-0.35l0%2C0l-0.75%2C-0.44l2.91%2C-3.53l-0.2%2C-1.08l0.5%2C-1.68l-0.16%2C-0.72l-1.19%2C-0.55l0.06%2C-3.28l-2.44%2C-0.62l0.11%2C-2.64l-0.86%2C-0.78l0%2C0l-0.25%2C0l0%2C0l-1.79%2C0.62l-2.58%2C-1.27l-0.29%2C0.77l-0.2%2C-0.17l-0.11%2C0.43l-1.06%2C0.51l0%2C0.34l-0.21%2C-0.26l-0.63%2C0.34l-0.54%2C0.8l-0.63%2C-0.57l-1.66%2C-0.01l-0.75%2C0.63l-0.23%2C1.48l-1.74%2C-2.39l-1.93%2C1.33l-3.8%2C-0.64l-1.21%2C-0.74l0%2C0l-0.15%2C-0.07l0%2C0l-1.31%2C0.42l0%2C0l-0.11%2C0.31l0%2C0l0.04%2C0.68l-1.31%2C1.18l-1.2%2C0.3l-1.64%2C-0.38l-0.21%2C-1.12l-0.85%2C-0.31l-0.38%2C0.07l-0.16%2C1.5l-0.73%2C0.38l-3.12%2C-1.06l-0.27%2C0.35l-1.14%2C-0.39l0%2C0l-0.5%2C0.16l0%2C0l-0.67%2C0.2l-0.19%2C0.79l-0.67%2C0.63l-1.61%2C0.2l-5.87%2C-0.38l-3.64%2C-0.72l-0.37%2C0.69l0.25%2C1.13l-0.49%2C0.13l-4.49%2C-2l-2.39%2C-2.81l-0.48%2C0.18L370%2C191l-0.52%2C-0.11l-0.22%2C0.28l-0.78%2C-1.27l-1.18%2C-0.89l-1.02%2C-0.17l-0.12%2C-0.67l-4.1%2C-1.41l-0.51%2C-2.45l-1.88%2C0.08l-1.57%2C-0.43l-0.21%2C-0.78l-0.99%2C-0.43l0%2C0l1.57%2C-0.43l1.49%2C-4.27l0.53%2C-0.78l1.8%2C0.14l0.44%2C-1.87l-1.98%2C-0.9l-0.46%2C0.12l-1.11%2C-3.43l2.29%2C0.89l1.13%2C-0.43l0%2C0l0.09%2C-0.05l0%2C0l0.17%2C-0.55l-0.47%2C-0.33l0%2C0l-0.28%2C-0.11l0%2C0l-0.52%2C-0.98l0.93%2C-2.12l0%2C0h0.19l0%2C0l0.67%2C-1.21l1.89%2C0.2l2.46%2C0.97l-1.6%2C-1.56l-0.16%2C-1.2l-0.5%2C-0.29l-0.77%2C-2.4l1.45%2C-0.29l0.06%2C-1.27l0.96%2C-2.08l-0.55%2C-0.92l-1.33%2C0.98l0%2C0l-0.21%2C0.09l0%2C0l-0.81%2C0.79l-1.55%2C0.3l0%2C0l-0.07%2C0.07l0%2C0l-0.97%2C0.66l-2.19%2C-0.84l-2.92%2C-3.28l-0.8%2C-0.18l-1.96%2C-2.41l0%2C0l-0.46%2C-0.41l0%2C0l-0.81%2C-0.96l1.25%2C-1.56l0%2C0l-0.01%2C-0.33l0%2C0l0.58%2C-2.21l-0.94%2C-1.39l0.39%2C-0.23l-0.21%2C-1.44l-1.08%2C0.12l-1.27%2C1.59l-1.47%2C-0.25l-0.11%2C-2.41l0.73%2C-1.22l-1.12%2C-1.05l-2.21%2C0.5l1.13%2C-3.73l-0.1%2C-4.09l0.91%2C-0.56l0%2C0l0.19%2C0.08l0%2C0l0.6%2C0.18l0%2C0l1.04%2C-0.11l0%2C0l0.18%2C0.04l0%2C0l1.37%2C0.12l0.27%2C0.84l0.85%2C-0.12l0.8%2C-0.21l1.12%2C-1.25l0.29%2C0.11l0.57%2C-0.93l1.34%2C-0.29l0.31%2C1.74l0%2C0l0.26%2C-0.07l0%2C0l1.88%2C-0.84l0.15%2C-1.23l1.28%2C-0.88l0%2C0l0.08%2C-0.18l0%2C0l1.79%2C-1.25l-0.27%2C-0.71l0.37%2C-0.77l1.21%2C0.5l0%2C0l0.56%2C-0.39l0%2C0l1.11%2C-0.31l-0.16%2C0.76l0.43%2C0.39l0.18%2C1.49l1.05%2C0.36l1.73%2C-0.67l0%2C0l1.33%2C0.6l0.43%2C-0.6l2.12%2C-0.74l0.07%2C-0.76l1.4%2C-1.05l0.14%2C-1.05l0.6%2C0.37l0.18%2C2.5l0.45%2C-0.03l0.31%2C0.46l0.37%2C-0.29l0.26%2C0.5l0.68%2C-0.51l0.62%2C-1.4l1.57%2C-0.8l1.31%2C1.1l-0.04%2C0.65l1.16%2C0.13l0.82%2C-0.83l1.32%2C0.59l-0.05%2C0.48l0.93%2C0.93l1.04%2C-0.13l0.11%2C0.84l0.51%2C-0.51l0.44%2C0.45l1.06%2C0l1.08%2C1.05l0.77%2C-0.57l0.98%2C1.36l0.76%2C0.22l0.61%2C-0.51l0.88%2C0.53l0.58%2C-0.37l0.13%2C0.46l1.49%2C0.77l-0.39%2C1.9l-1.75%2C1.44l-0.44%2C-0.15l-0.36%2C1.12l-0.61%2C0.29l0.14%2C0.3l0%2C0l0.22%2C0.07l0%2C0l-0.11%2C0.24l-0.63%2C-0.28l0.15%2C0.5l-0.33%2C0.26l0.05%2C-0.66l-0.69%2C0.67l-0.64%2C-0.29l-0.66%2C0.88l-0.2%2C-0.41l-0.52%2C0.1l-0.54%2C0.42l0.2%2C0.28l0%2C0l-0.02%2C0.14l0%2C0l0.21%2C0.47l1.66%2C0.63l1.14%2C-1.15l0%2C0l0.18%2C-0.11l0%2C0l0.35%2C-0.7l0.95%2C-0.51l0.34%2C0.22l1.92%2C-0.69l-0.31%2C-0.74l0%2C0l0.41%2C-0.1l0%2C0l0.77%2C-0.8l1.86%2C-0.27l0.39%2C-0.98l0.99%2C0.27l0.58%2C-0.3l0.05%2C0.42l0.6%2C-0.33l0.78%2C0.39l0.59%2C-0.7l-0.05%2C-0.71l1.2%2C-0.22l0.82%2C1l0.75%2C0.19l0.25%2C-0.33l1.7%2C-0.1l0.38%2C-0.79l0%2C0l0.07%2C0l0%2C0l0.51%2C-0.32l0.17%2C0.93l1.08%2C0.11l0.96%2C-0.36l0.88%2C-1.2l-1.15%2C-1.26l0.18%2C-0.76l0.55%2C0.21l-0.47%2C-1.12l0.2%2C-1.35l-0.56%2C-1.74l-0.36%2C-0.39l-1.04%2C0.77l-0.6%2C1.05l-0.62%2C-0.47l0.4%2C-2.27l1.08%2C-1.37l-0.31%2C-0.63l0.6%2C-1.31l-0.67%2C-1.22l-1.17%2C-0.1l-0.07%2C-2.57l-0.86%2C-0.9l-0.9%2C0.09l0%2C0l-0.16%2C0.07l0%2C0l-0.68%2C-0.04l0.34%2C-1.22l-1.27%2C-0.91l0.25%2C-0.58l-0.44%2C-0.47l0.37%2C-0.2l0%2C0l0.04%2C-0.4l0%2C0l0.16%2C-0.36l-0.64%2C0.55l-0.66%2C-0.33l-0.19%2C-1.14l-0.57%2C-0.49l-0.32%2C0.78l-0.48%2C-0.41l-0.5%2C0.22l0%2C0l-0.03%2C-0.11l0%2C0l-0.64%2C-0.41l0.88%2C-1.42l-0.44%2C-0.29l0.1%2C-0.93l0%2C0v-0.11l0%2C0l-0.48%2C-0.65l-1.27%2C-0.15l1.16%2C-1.95l-0.16%2C-0.8l0.87%2C-0.56l-0.52%2C-0.92l0.47%2C-0.01l0.74%2C-2.89l0.54%2C-0.49l-1.18%2C-1.47l0.36%2C-1.41l-1.73%2C-0.42l-0.57%2C-1.49l-0.81%2C-0.48L397.91%2C96.65z%22%2F%3E%0A%09%09%3Cpath%20fill%3D%22white%22%20stroke%3D%22none%22%20id%3D%22ES-CN%22%20title%3D%22Canary%20Islands%22%20%20d%3D%22M6.42%2C536.26l0.61%2C0.25l0.53%2C1.12l-0.85%2C1.06l-0.34%2C1.18l-0.81%2C0.38l-0.57%2C2.44l-0.86%2C-0.31l-1.11%2C-1.31l-2.58%2C-0.33l-0.41%2C-0.35l0.16%2C-1.25l0.54%2C-0.45l1.46%2C0.52l1.2%2C-0.28l1.3%2C-1.17l-0.12%2C-0.67L6.42%2C536.26zM74.61%2C526.11l0.5%2C0.46l-0.17%2C1.01v-0.83l-0.28%2C0.94l0%2C-0.53l-0.32%2C0.23l0.5%2C1.22l-0.24%2C1.23l1.26%2C1.53l0.16%2C0.56l-0.45%2C0.74l0.69%2C1l-0.71%2C0.26l-0.25%2C1.09l0.24%2C0.99l-0.8%2C0.37l-0.36%2C1.24l-3.34%2C1.19l-0.56%2C0.92l-0.78%2C0.08l-1.62%2C-0.69l-0.4%2C0.23l-3.06%2C-2.6l-1.26%2C-2.32l0.27%2C-3.19l0.99%2C-0.23l1.79%2C-1.49l0.64%2C-2.48l-0.33%2C-0.48l0.71%2C-0.13l0.43%2C0.36l0.8%2C-0.42l0.99%2C0.85l2.03%2C-0.33l1.64%2C0.88l0.79%2C-0.35l-0.12%2C-0.87L74.61%2C526.11zM24.15%2C525.05l0.38%2C-0.08l0.45%2C0.53l1.31%2C0.02l0.33%2C0.62l1.75%2C0.84l0.42%2C0.74l0.06%2C1.11l-1.86%2C1.76l-0.82%2C0.34l-1.94%2C-0.06l-1.34%2C-1.03l-0.04%2C-0.54l-0.75%2C-0.68l0.1%2C-1.66l0.65%2C-1.39L24.15%2C525.05zM38.06%2C520.11l0.97%2C-0.02l1.43%2C-0.79l1.92%2C0.24l1.43%2C-0.78l1.09%2C-0.02l2.2%2C-2.07l0.52%2C-1.21l0.76%2C-0.61l1.27%2C-0.28l0.36%2C-0.69l2.72%2C0.4l1.77%2C-0.7l0.7%2C0.22l0.34%2C0.67l-0.15%2C0.85l-2.99%2C1.39l-0.46%2C0.97L48.99%2C520v2.24l-1.75%2C3.15l-0.04%2C1.71l-3.27%2C3.78l-1.33%2C-0.13l-1.31%2C0.78l-1.56%2C-0.02l-0.27%2C-1.3l-0.72%2C-0.29l0.02%2C-0.91l-1.15%2C-1.06l-1.58%2C-2.66l-0.11%2C-1.77l-1.52%2C-2.08l-0.76%2C-0.29l0.2%2C-0.6l2.3%2C-0.98l0.66%2C0.5L38.06%2C520.11zM116.13%2C508.36l1.55%2C1.36l0.38%2C3.71l-0.57%2C2.73l-0.66%2C0.72l0.41%2C2.69l-1.16%2C2.14l-0.04%2C1.12l-0.55%2C1.08l-0.74%2C0.7l-1.15%2C0.03l-0.69%2C0.64l-5.63%2C1.31l-3.08%2C3.71l-3.91%2C-1.02l-0.9%2C0.36l0.45%2C-1.38l0.27%2C0.31l1.1%2C-0.02l2%2C-0.53l3.93%2C-2.88l0.57%2C-3.52l1.12%2C-1.29l0.42%2C-2.17l1.44%2C-1.43l1.6%2C-3.26l-0.12%2C-0.75l0.82%2C-1.85l-0.22%2C-1.22L116.13%2C508.36zM118.4%2C508.07l-0.1%2C0.77l-0.43%2C0.06l-0.19%2C-0.47L118.4%2C508.07zM6.82%2C505.28l1.43%2C0.75l1.33%2C-0.4l0.86%2C0.16l0.74%2C2.1l0.72%2C0.92l-1.26%2C2.04l0.56%2C1.61l-0.26%2C1.65l-2.22%2C3.63l-0.74%2C-0.63l-0.33%2C-2.07l-1.24%2C-1.73l-1.49%2C-4.01l-0.72%2C-0.97l0.05%2C-0.83l1.04%2C-1.33L6.82%2C505.28zM127.76%2C493.82l1.14%2C0.57l0.1%2C0.75l-0.23%2C0.93l-0.98%2C0.82l0.45%2C1.25l-0.5%2C0.99l0.03%2C1.16l-0.57%2C0.79l-1.39%2C0.73l-0.29%2C0.53l-1.34%2C0.11l-1.25%2C0.92l-2.52%2C0.38l-1.4%2C2.11l-0.38%2C-0.62l-1.95%2C0.11l-0.24%2C-0.97l1.42%2C-1.31l-0.11%2C-1.88l0.5%2C-1.37l1.65%2C-1.38l1.27%2C-0.04l1.54%2C-1.34l0.49%2C0.23l0.86%2C-0.62l1.47%2C0.53l0.62%2C-0.72l0.77%2C-2.4l0.7%2C-0.61L127.76%2C493.82zM126.62%2C491.85l0.95%2C0.83l-0.87%2C1.21l-1.07%2C0.17L126.62%2C491.85zM126.7%2C487.96l0.47%2C0.41l-0.52%2C0.56l-0.61%2C0.01l0.17%2C-0.84L126.7%2C487.96z%22%2F%3E%0A%09%09%3Cpath%20fill%3D%22white%22%20stroke%3D%22none%22%20id%3D%22ES-CT%22%20title%3D%22Catalonia%22%20%20d%3D%22M548.73%2C49.79l-1.52%2C-0.24l0.88%2C-1.3l0.14%2C1.03L548.73%2C49.79zM579.22%2C61.36l0.41%2C0.75l1.01%2C0.15l-0.2%2C0.22l1.17%2C1.34l-0.41%2C0.86l0.01%2C1.42l-0.27%2C-0.04l0.63%2C1.24l0.57%2C0.15l0.08%2C0.71l-0.42%2C0.29l-0.22%2C1.48l-0.71%2C0.5l-0.14%2C0.72l-0.7%2C0.21l-0.53%2C0.75l-0.81%2C-0.12l-1.58%2C2.42l-1.84%2C0.79l-1.14%2C1.52l-3.22%2C1l-0.71%2C0.54l-0.38%2C0.93l-6.63%2C2.85l-4.04%2C2.67l-2.96%2C1.25l-2.04%2C2.68l-0.76%2C1.86l0.38%2C-1.6l-0.55%2C1.21l-0.44%2C0.05l-0.04%2C0.28l0.46%2C-0.14l-0.72%2C1.27l-0.84%2C0.67l-2.53%2C0.8l-2.38%2C0.12l-1.69%2C0.9l-1.43%2C0.02l-1.97%2C0.63l-0.38%2C0.47l0.17%2C-0.36l-6.1%2C1.33l-3.12%2C1.69l-2.64%2C0.18l-1.45%2C0.92l-0.25%2C0.08l0.22%2C-0.37l-0.97%2C0.36l-1%2C1.61l-1.22%2C-0.72l-2.08%2C0.37l-1.76%2C0.85l-3.41%2C3.38l-1.89%2C2.89l-1.09%2C0.72l-0.28%2C0.83l-1.11%2C0.68l0.83%2C1.27l1.4%2C0.05l-1.08%2C-0.81l0.76%2C-0.04l1.7%2C2.1l1.79%2C0.45l-1.37%2C1.46l-2.43%2C1.28l-2.24%2C2.87l-1.35%2C0.21l-0.71%2C-0.85l0.45%2C0.25l-0.04%2C-0.57l1.08%2C0.72l0.33%2C-0.23l-0.51%2C-0.34l1.76%2C-0.27l0.86%2C-1.55l-1.4%2C-0.2l-0.84%2C0.54l-1.68%2C0.16l0.09%2C0.41l-0.32%2C-0.21l-1.48%2C1.74l-0.67%2C1.6l0%2C0l-2.06%2C-0.88l0.13%2C-1.09l-1.12%2C-0.87l-1.7%2C-0.21l-1.59%2C-0.74l-0.41%2C-0.56l0.55%2C-1.63l0%2C0l-0.2%2C-0.08l0%2C0l-0.08%2C-0.09l0%2C0l-0.27%2C-0.27l0%2C0l-0.63%2C0.08l0%2C0h-0.15l0%2C0l-0.31%2C-1.13l-0.77%2C0.3l-0.75%2C-0.35l0%2C0l-0.25%2C-0.58l0.39%2C0.31l0.05%2C-0.48l1.42%2C-0.43l0.15%2C-0.7l1.19%2C-1.21l-1.04%2C-2.23l0.39%2C-1.08l0%2C0l-0.03%2C-0.2l0%2C0l1.09%2C-1.82l-0.33%2C-0.22l0%2C0l0.04%2C-0.27l0%2C0l-0.6%2C-1.21l0.5%2C-0.19l-0.89%2C-0.72l-0.38%2C0.2l0.01%2C-0.45l-0.37%2C0.19l0.33%2C-0.47l-0.3%2C-0.96l-0.51%2C-0.1l0%2C-1.43l0.34%2C-0.4l0.9%2C0.26l0.17%2C-0.7l1.12%2C-0.27l0.72%2C-2.37l1.14%2C-0.06l0.06%2C-0.47l0.39%2C0.05l0.21%2C-1.51l-0.59%2C-0.94l0.11%2C-0.52l-0.57%2C-0.43l0.7%2C-0.9l-1.45%2C-1.5l0.95%2C-2.01l-0.34%2C-1.2l1.5%2C-0.22l1.36%2C-1.88l-0.53%2C-2.15l-0.72%2C0.33l-1.42%2C-0.24l0.21%2C-1.16l-0.87%2C-1.05l0.04%2C-0.68l1.58%2C-2.21l0.3%2C0.3l0.09%2C-0.93l1.87%2C-0.25l0.42%2C-1.28l0.83%2C-0.77l0.82%2C0.03l0.33%2C-1.15l0.66%2C0.03l0.02%2C-0.42l0.72%2C-0.31l-0.39%2C-0.52l0.09%2C-1.14l0.31%2C-0.07l-1.21%2C-0.66l0.67%2C-1.05l0.49%2C0.2l0.35%2C-0.99l0.54%2C-0.18l0.13%2C0.39l0.33%2C-0.62l0%2C-1.51l0.38%2C-0.24l0.87%2C-2.59l-0.24%2C-1.22l0.57%2C-0.48l-0.46%2C-0.32l0.12%2C-0.6l1.68%2C-4.89l-0.64%2C-0.55l0.81%2C-0.55l-1.28%2C-0.52l0.62%2C-0.69l-1.48%2C-3.7l0.29%2C-0.32l0.34%2C0.26l0.69%2C-0.66l-0.53%2C-0.28l0.04%2C-0.53l0.36%2C-0.45l0.43%2C0.19l-0.26%2C-0.38l0.7%2C-2.45l-1.68%2C-0.42l-0.27%2C-1.34l-0.61%2C-0.82l0%2C0l-0.21%2C-0.14l0%2C0l-0.11%2C-0.25l0%2C0h0.39l0.17%2C-0.64l-0.51%2C-1.51l-0.57%2C-0.2l0.67%2C-0.75l-0.59%2C-0.28l0.69%2C-0.81l-0.32%2C-1.23l1.36%2C-0.86l1.84%2C0.92l0.71%2C-0.13L517.5%2C36l1.91%2C1.38l0.93%2C-0.61l0.64%2C0.71l1.69%2C0.21l0.9%2C-0.28l1.35%2C1.25l0.13%2C0.97l0.97%2C0.73l1.67%2C-0.71l0.62%2C0.47l2.8%2C-0.16l-0.15%2C0.59l0.99%2C0.51l0.02%2C0.75l0.69%2C0.52l0.16%2C1.09l0.66%2C0.81L533.04%2C45l0.47%2C0.57l-0.81%2C1.1l0.98%2C-0.13l0.49%2C1.08l-1.32%2C1l0.59%2C0.31l0.2%2C1.39l2.78%2C0.19l0.32%2C-0.9l0.48%2C0.3l0.52%2C-0.67l1.6%2C0.01l0.38%2C-1.36l0.89%2C0.5l0.58%2C-0.42l1.06%2C0.54l1.06%2C-0.15l0.97%2C0.33l1.14%2C1.21l1.46%2C-0.14l0.12%2C0.84l0.49%2C0.29l0.19%2C1.47l1.44%2C1.25l1.88%2C-0.52l0.21%2C-0.56l0.64%2C-0.24l0.23%2C-0.95l0.83%2C-0.5l1.25%2C0.29l1.51%2C-0.82l1%2C0.57l0.63%2C-0.13l0.97%2C0.77l2.19%2C0.43l0.04%2C0.65l1.29%2C1.3l1.61%2C0.25l0.35%2C-0.74l0.62%2C-0.17l2.59%2C0.65l0.07%2C-0.68l-0.6%2C-1.05l0.49%2C0.02l0.07%2C-0.61l1.19%2C-0.61l1.06%2C-0.19l0.62%2C0.5l1.33%2C-1l0.34%2C-0.72l0.54%2C0.17l0.34%2C-0.48l1.24%2C0.4l0.8%2C-0.95l0.54%2C0.61l1.98%2C-0.29l1.26%2C1.76l0.93%2C-0.44l1.48%2C0.1l-0.44%2C0.25l0.27%2C0.41l-0.48%2C0.88l0.37%2C0.12l-0.31%2C0.33l0.21%2C0.73l0.65%2C0.32l0.2%2C0.59l0.92%2C-0.57l0.63%2C0.77l0.45%2C-0.37l0.53%2C0.54l0.98%2C0.21l-0.96%2C0.58l0.34%2C0.69l-0.61%2C-0.07l0.29%2C0.76l-0.24%2C0.45l-0.69%2C0.01l0.26%2C0.56l-0.96%2C-0.49l-0.26%2C0.71l-1.04%2C-0.52l-0.29%2C-0.69l-0.89%2C0.61l-0.62%2C1.56L579.22%2C61.36z%22%2F%3E%0A%09%09%3Cpath%20fill%3D%22white%22%20stroke%3D%22none%22%20id%3D%22ES-EX%22%20title%3D%22Extremadura%22%20%20d%3D%22M307.38%2C128.71L308.25%2C129.46L309.01%2C129.63L309.11%2C129.38L309.11%2C129.38L309.6%2C129.37L309.6%2C129.37L310.37%2C129.71L311.42%2C128.66L312.13%2C129.62L312.86%2C128.85L314.96%2C128.64L315.78%2C127.91L315.62%2C126.87L316.09%2C126.1L318.3%2C124.98L318.97%2C125.02L319.59%2C124.04L320.92%2C123.9L321.1%2C123.19L321.1%2C123.19L321.48%2C122.8L321.48%2C122.8L324.67%2C120.93L326.65%2C121.97L327.01%2C122.77L327.79%2C122.56L327.46%2C123.27L328.48%2C123.75L328.48%2C123.75L328.6%2C123.8L328.6%2C123.8L329.14%2C124.17L328.64%2C124.35L328.96%2C124.51L328.6%2C124.79L328.71%2C125.27L328.11%2C125.55L330.49%2C126.15L330.43%2C126.89L330.43%2C126.89L330.55%2C127.07L330.55%2C127.07L331.29%2C127.6L331.29%2C127.6L331.57%2C127.79L331.57%2C127.79L333.13%2C128.29L333.82%2C126.84L336.12%2C125.43L336.81%2C126.76L336.32%2C127.66L336.61%2C128.04L337.34%2C128.25L338.07%2C127.77L339.34%2C127.84L340.24%2C128.61L340.45%2C129.32L341.23%2C129.47L341.43%2C130.47L342.22%2C130.64L342.22%2C130.64L342.63%2C130.85L342.63%2C130.85L342.96%2C131.06L342.96%2C131.06L343.17%2C131.13L343.17%2C131.13L344.62%2C131.12L345.32%2C130.78L346.49%2C129.25L348.8%2C128.89L348.07%2C130.53L348.12%2C132.44L349%2C134.14L349%2C134.14L348.09%2C134.7L348.2%2C138.79L347.07%2C142.51L349.28%2C142.01L350.41%2C143.05L349.68%2C144.28L349.79%2C146.69L351.26%2C146.94L352.53%2C145.35L353.6%2C145.23L353.81%2C146.66L353.42%2C146.89L354.36%2C148.28L353.78%2C150.49L353.78%2C150.49L353.79%2C150.83L353.79%2C150.83L352.54%2C152.39L353.35%2C153.35L353.35%2C153.35L353.81%2C153.76L353.81%2C153.76L355.77%2C156.17L356.56%2C156.35L359.48%2C159.63L361.68%2C160.47L362.65%2C159.82L362.65%2C159.82L362.71%2C159.75L362.71%2C159.75L364.27%2C159.45L365.07%2C158.66L365.07%2C158.66L365.29%2C158.57L365.29%2C158.57L366.61%2C157.59L367.17%2C158.51L366.21%2C160.59L366.15%2C161.86L364.7%2C162.16L365.47%2C164.55L365.97%2C164.84L366.13%2C166.05L367.73%2C167.61L365.27%2C166.64L363.38%2C166.44L362.7%2C167.64L362.7%2C167.64L362.52%2C167.64L362.52%2C167.64L361.59%2C169.76L362.11%2C170.75L362.11%2C170.75L362.39%2C170.86L362.39%2C170.86L362.86%2C171.19L362.69%2C171.74L362.69%2C171.74L362.6%2C171.79L362.6%2C171.79L361.47%2C172.22L359.18%2C171.33L360.28%2C174.75L360.74%2C174.63L362.72%2C175.53L362.28%2C177.4L360.48%2C177.27L359.96%2C178.04L358.47%2C182.31L356.9%2C182.74L356.9%2C182.74L355.5%2C183.51L353.15%2C183.15L353.62%2C184.49L353.62%2C184.49L353.58%2C184.57L353.58%2C184.57L353.11%2C184.63L353.12%2C185.16L352.79%2C184.89L352.68%2C185.24L352.46%2C184.86L352.31%2C185.49L352.07%2C185.23L351.19%2C186.34L350.22%2C186.83L349.7%2C187.47L349.79%2C187.98L348.09%2C187.8L347.48%2C188.83L347.7%2C189.33L347.23%2C189.07L346.84%2C189.74L346.84%2C189.74L346.95%2C190L346.95%2C190L345.1%2C191.25L344.97%2C191.97L344.01%2C191.97L343.29%2C192.43L342.28%2C194.08L342.25%2C194.64L342.99%2C195.35L342.55%2C196.63L343.85%2C198.9L343.81%2C200.9L343.81%2C200.9L343.71%2C200.96L343.71%2C200.96L343.36%2C201.61L343.51%2C202.38L342.48%2C202.82L342.29%2C203.46L340.88%2C203.23L338.94%2C205.17L338.17%2C204.94L337.98%2C203.55L339.22%2C202.76L338.95%2C202.22L339.26%2C202.06L339.52%2C202.42L339.48%2C201.69L338.35%2C201.16L337.56%2C201.72L336.87%2C201.55L336.38%2C201.93L334.97%2C202.03L334.26%2C202.59L334.18%2C203.38L332.94%2C204.31L332.86%2C204.89L333.43%2C205.61L332.72%2C206.34L332.23%2C208.12L329.57%2C208.03L327.79%2C208.49L326.01%2C210L325.45%2C209.26L324.42%2C209.36L324.06%2C208.95L322.66%2C208.7L322.04%2C208.07L322.04%2C208.07L321.9%2C208.02L321.9%2C208.02L321.17%2C207.39L320.89%2C206.24L319.65%2C205.92L318.63%2C206.02L318.87%2C206.33L318.14%2C206.92L318.3%2C207.52L317.98%2C207.73L316.04%2C206.98L316.04%2C206.98L315.72%2C206.98L315.72%2C206.98L315.06%2C207.18L314.94%2C205.84L314.94%2C205.84L314.51%2C205.32L314.51%2C205.32L313.82%2C204.59L313.26%2C204.86L311.32%2C204.52L310.59%2C204.82L309.97%2C204.55L309.94%2C204.12L308.89%2C204.13L309.32%2C201.85L307.95%2C201.89L305.63%2C200.85L305.63%2C200.85L305.48%2C200.37L304.92%2C200.43L304.49%2C200.9L304.25%2C200.65L303.38%2C200.89L302.92%2C201.59L301.89%2C201.49L301.44%2C202L299.98%2C200L299.55%2C198.36L299.09%2C198.23L296.34%2C194.36L296.14%2C193.4L295.15%2C192.72L294.65%2C192.85L295.67%2C191.54L294.96%2C191.43L295.48%2C189.2L297.1%2C186.42L296.34%2C185.91L296.67%2C182.95L298.03%2C182.18L300.22%2C179.83L301.13%2C179.71L301.99%2C178.44L302.76%2C178.08L302.93%2C177.54L302.44%2C176.55L305.05%2C172.47L304.8%2C171.45L304.07%2C170.07L302.86%2C169.27L300.83%2C169.88L300%2C169.57L299.75%2C169.1L300.1%2C167.4L297.88%2C166.6L297.18%2C165.91L296.96%2C164.55L297.4%2C163.6L295.37%2C161.61L294.93%2C160.03L295.57%2C158.82L295.7%2C157.2L294.27%2C156.23L293.82%2C156.45L293.38%2C156.13L293.12%2C154.74L292.06%2C154.58L291.05%2C153.08L290.19%2C152.67L289.44%2C150.32L289.04%2C150.04L291.33%2C150.12L294.62%2C150.87L296.91%2C149.95L299.72%2C150.43L300.34%2C150.07L301.93%2C150.26L303.33%2C149.8L304.42%2C146.22L304.17%2C144.82L305.05%2C144.41L306.24%2C143.02L306.32%2C140.88L306.77%2C140.49L306.9%2C138.91L307.47%2C137.78L305.4%2C134.35L303.76%2C134.02L302.93%2C131.6L303.44%2C130.18L304.68%2C129.79L305.03%2C129.08L306.18%2C129.2z%22%2F%3E%0A%09%09%3Cpath%20fill%3D%22white%22%20stroke%3D%22none%22%20id%3D%22ES-GA%22%20title%3D%22Galicia%22%20%20d%3D%22M251.81%2C58.72l0.5%2C0.59l-0.63%2C-0.17L251.81%2C58.72zM251.57%2C57.16l0.57%2C0.82l-0.45%2C0.58l0.24%2C-0.47L251.57%2C57.16zM251.48%2C51.92l-0.66%2C1.48l-0.02%2C-0.97l0.36%2C-0.63L251.48%2C51.92zM248.94%2C48.64l0.39%2C0.51l-0.28%2C0.25L248.94%2C48.64zM252.73%2C45.37l0.13%2C0.35l0.37%2C-0.1l0.12%2C0.74l-0.43%2C0.08l0.11%2C0.67l-0.27%2C0.04l-0.21%2C-0.33l0.29%2C0.07l-0.24%2C-0.32l0.29%2C-0.62l-0.62%2C-0.39L252.73%2C45.37zM278.53%2C1.91l0.63%2C-1.08l0.34%2C0.23l0.63%2C-0.41l0.25%2C0.38l-0.33%2C1.08l0.57%2C0.94l-0.67%2C-0.44l-0.04%2C1.25l-0.37%2C0.12l0.52%2C0.46l-0.91%2C0.04l0.68%2C0.39l0.8%2C-0.52l-0.44%2C-0.92l0.89%2C-0.17l0.25%2C0.52l0.48%2C-0.17l-0.62%2C-0.56l0.5%2C-0.24l-0.05%2C-0.35l2.42%2C-0.92l0.99%2C-0.98L285%2C0l0.72%2C0.63l-1.04%2C1.44l0.54%2C0.22l0.23%2C-0.62l0.99%2C-0.24l0.23%2C1.16l0.59%2C0.16l-0.2%2C1.44l0.34%2C0.83l0.17%2C-0.99l0.51%2C-0.35l-0.22%2C-0.7l0.73%2C0.06l0.04%2C-0.76l0.9%2C-0.24l0.27%2C0.5l1.25%2C-0.03l-0.24%2C0.6l3.28%2C1.38l0.53%2C1.48l1.14%2C1.23l-0.36%2C0.33l0.48%2C-0.15l1.19%2C0.7l-0.29%2C0.56L296.4%2C8.6l0.52%2C0.22l-0.25%2C0.22l0.64%2C-0.7l2.01%2C0.59l1.38%2C-0.3l1.88%2C0.22l0.17%2C0.74l-0.44%2C0.64l-0.09%2C1.76l0%2C0l-0.93%2C0.65l-0.38%2C1.05l-1.89%2C-0.1L299%2C14.52l0%2C0l0.05%2C0.13l0%2C0l-0.12%2C0.68l0.49%2C0.3L300%2C15.3l0.25%2C0.45l-0.06%2C1.53l0.82%2C1.01l1.08%2C-0.06l-0.27%2C1.34l0.26%2C0.89l1.11%2C1.12l0.3%2C-0.33l0.25%2C0.57l0.82%2C0.16l0.15%2C0.58l-0.42%2C0.84l0.64%2C1.14l0.5%2C0.08l1.47%2C-0.92l-0.05%2C-0.35l0.79%2C-0.19l0.91%2C1.06l-0.19%2C0.77l-1.12%2C1.16h-0.62l-0.54%2C0.63l-0.67%2C-0.45l-0.74%2C0.94l0.03%2C0.98l-0.44%2C-0.24l-0.43%2C0.77l0.68%2C0.93l0.41%2C-0.02l0.05%2C-1.48l1.27%2C1.72l1.02%2C0.03l0.94%2C1.13l-0.14%2C1.16l0.46%2C0.46l0%2C0l-0.46%2C0.31l0.18%2C0.91l-1%2C0.29l0.79%2C1.86l-0.74%2C0.79l0.05%2C0.53l-1.86%2C1.72l-0.67%2C-0.49l-0.35%2C1.07l-1.04%2C0.07l-0.91%2C1.05l1.04%2C1.91l-1.15%2C0.56l-0.04%2C1.21l0.38%2C0.46l-0.84%2C1.13l0.17%2C0.88l-0.45%2C0.79l0.55%2C0.03l0%2C0l0.5%2C0.04l0%2C0l1.71%2C0.47l0.4%2C-0.88l0.83%2C-0.12l2.04%2C1.24l0.85%2C-0.24l0.42%2C0.96l-0.41%2C0.52l0.19%2C0.92l-0.66%2C0.76l0%2C0l-0.02%2C0.08l0%2C0l0.58%2C0.65l1.07%2C0.17l0.39%2C0.55l0.9%2C0.28l-0.15%2C2.28l-1.62%2C2.37l0%2C0l0.14%2C0.3l0%2C0l-0.06%2C0.56l-1.26%2C-0.71l-1.14%2C0.44l-0.41%2C0.9l-1.18%2C0.63l-0.23%2C1.58l-0.97%2C0.27l-0.43%2C1.37l-0.8%2C0.39l0.65%2C0.87l0.92%2C-0.09l0.37%2C1.01l-0.73%2C1.17l0.15%2C0.78l0%2C0l-0.7%2C0.84l-1.67%2C0.05l-0.52%2C-0.9l-0.84%2C-0.47l-1.62%2C0.22l-0.29%2C1.4l0.35%2C0.85l-0.57%2C1.39l-3.17%2C1.33l-1.13%2C0.08l-0.27%2C-0.38l-1.57%2C1.56l-0.7%2C-1.91l-1.18%2C-0.34l-0.94%2C1.11l-2.31%2C0.39l0.3%2C-1.38l0.46%2C-0.42l-2.03%2C-0.14l-1.15%2C-0.88l-1%2C0.54l-0.57%2C-0.22l-0.85%2C0.56l-1.23%2C0.14l-1.18%2C1.04l-0.34%2C-0.39l0.16%2C-2.2l-0.48%2C-0.18l-0.51%2C1.77l-1.54%2C0.19l-0.98%2C1.52l-1.13%2C0.52l-1.96%2C0.28l-1.01%2C-0.35l-0.16%2C-2.05l-0.85%2C0.11l-0.41%2C-1.37l1.47%2C-2.58l0.9%2C-0.87l1.12%2C-0.37l0.11%2C-1.18l-0.8%2C-1.17l-1.89%2C0.42l-0.41%2C-3.15l-0.7%2C0.76l-0.63%2C-0.22l-0.3%2C0.62l-1.65%2C0.69l-0.37%2C0.7l-0.87%2C-0.21l-0.5%2C0.5l-1.14%2C0.16l-0.52%2C-0.37l-2.1%2C0.09l-0.14%2C0.6l-0.54%2C0.3l-2.35%2C0.2l-0.67%2C0.72l-0.23%2C1.01l-2.19%2C1.37l-0.29%2C1.07l-1.76%2C0.84l-1.35%2C1.7l-0.28%2C-0.49l-0.22%2C-3.52l0.34%2C-1l-0.67%2C-4.05l0.58%2C0.02l0.78%2C-0.64l0.45%2C0.58l0.28%2C-0.14l0.14%2C-0.87l-0.84%2C-0.6l0.75%2C-0.01l0.2%2C-1.13l1.01%2C-0.65l0.43%2C-0.98l0.6%2C-0.03l-0.36%2C0.08l0.33%2C0.18l2.19%2C-2.14l1.34%2C-0.09l-0.41%2C-0.8l0.43%2C-1.25l-0.58%2C-0.36l-0.11%2C0.99l-0.65%2C0.42l0.04%2C0.87l-1.44%2C0.56l-0.15%2C-0.48l-0.37%2C0.07l-0.17%2C0.56l-0.75%2C0.49l-0.49%2C-0.19l-0.26%2C0.61l-0.57%2C-0.47l-0.47%2C0.29l-0.68%2C-0.36l-0.21%2C0.54l-0.26%2C-0.12l0.47%2C-2.16l0.68%2C1.13l0.39%2C-0.01l-0.08%2C-1.25l-0.5%2C-0.92h0.96l0.43%2C0.4l0.87%2C-0.44l0.8%2C-1.64l1.99%2C-1.55l-0.82%2C0.25l-0.24%2C-0.69l-2.26%2C1.91l-1.09%2C-0.48l-0.66%2C0.61l-1.15%2C-1.13l0.24%2C-0.75l-0.37%2C-0.8l-0.72%2C-0.19l-0.39%2C0.42l-0.47%2C-0.47l0.17%2C-0.6l1.31%2C-0.05l-0.06%2C-0.46l0.55%2C-0.28l0.43%2C1.06l-0.45%2C0.4l0.08%2C0.51l0.75%2C-0.54l0.66%2C0.49l-0.39%2C-1.21l0.63%2C-0.43l-0.34%2C-0.47l0.24%2C-0.83L254%2C47.34l-0.28%2C-1.15l0.55%2C-0.32l-0.41%2C-0.09l0.1%2C-0.5l0.94%2C-0.15l0.8%2C-0.8l-0.34%2C-0.49l0.63%2C-1.21l-0.39%2C-0.21l-0.94%2C0.61l-0.48%2C-0.34l0.25%2C-0.73l-0.76%2C-0.79l0.01%2C0.96l-0.31%2C-0.16l-0.28%2C0.7l0.63%2C0.52l-0.56%2C0.23l0.03%2C0.73l-0.83%2C-0.15l0.37%2C-0.81l-0.72%2C-0.23l-1.01%2C1.15l0.48%2C0.78l-0.86%2C0.07l-0.29%2C0.55l-0.7%2C0.15l-0.03%2C1.12l-1.47%2C0.66l0.26%2C-1.49l-0.6%2C-0.68l-0.49%2C0.36l-0.46%2C-0.37l1.35%2C-2.16l0.5%2C-2.78h0.38l0.65%2C-1.14l0.85%2C-0.19l0.89%2C-1.47l0.41%2C-0.17l0.66%2C0.72l-0.38%2C-0.71l0.1%2C-0.85l0.93%2C-0.51l-0.42%2C-0.03l-0.26%2C0.46l-0.48%2C-0.68l-0.1%2C1.2l-0.45%2C0.19l-0.18%2C-0.35l-0.81%2C1.02l-0.51%2C-0.53l-0.03%2C0.55l-0.92%2C-0.11l-0.1%2C-0.78l-0.61%2C0.57l-0.61%2C-0.04l0.41%2C0.71l-1.12%2C1.13l-0.29%2C-0.58l-0.49%2C0.03l-0.48%2C-1.4l-0.44%2C-0.24l1.17%2C-0.92l-0.1%2C-0.72l-0.57%2C-0.09l-0.54%2C-1.07l0.59%2C-1.29l-0.9%2C-0.16l-0.93%2C-1.69l0.3%2C1.53l-0.73%2C-0.05l-0.32%2C-0.9l-0.37%2C0.02l-0.02%2C0.53l-0.85%2C0.36l-0.1%2C1.35l-0.33%2C-0.36l0.12%2C-0.72l-0.63%2C-0.43l0.12%2C-0.67l0.8%2C-1.23L242%2C29.49l0.37%2C0.18l0.18%2C-0.32l-0.79%2C-0.22l-0.59%2C-1.7l0.63%2C0.4l0.48%2C-0.23l0.03%2C-1.51l0.97%2C0.16l0.05%2C-1.01l0.98%2C0.93l0.6%2C-1.21l1.04%2C-0.4l-1.1%2C0.23l-0.02%2C-0.92l-0.5%2C1.06l-0.56%2C-0.19l-0.28%2C-1.22l0.41%2C0.26l0.51%2C-0.43l0.16%2C-0.97l0.5%2C0.34l0.19%2C-0.49l0.41%2C0.19l0.14%2C-0.27l1.34%2C0.62l1.06%2C-0.44l0.8%2C-1.48l0.42%2C0.61l0.45%2C-0.46l0.96%2C0.06l-0.06%2C0.47l0.51%2C-0.25l0.31%2C-0.75h0.44l-0.45%2C-0.09l-0.72%2C0.88l0.18%2C-0.48l-0.4%2C-1.1l-0.66%2C0.04l-0.41%2C-0.51l0.93%2C-0.71l0.78%2C0.45l0.08%2C-0.44l0.48%2C0.03l-0.08%2C-1.07l0.98%2C0.35l0.1%2C-0.38l0.69%2C0.12l0.16%2C-0.96l1.48%2C1.53l2.14%2C0.49l2.7%2C-1.18l1.39%2C0.43l0.61%2C-0.18l0.65%2C-0.45l0.4%2C-1.17l0.5%2C0.23l0.57%2C-0.28l0.55%2C-0.86l0.76%2C0.5l0.2%2C-0.75l0.48%2C0.82l-0.54%2C0.19l0.52%2C0.33l0.07%2C0.85l-0.08%2C-0.4l0.95%2C-0.19l0.31%2C-1.17l-0.46%2C-0.1l0.14%2C-0.58l1.17%2C-0.35l0.33%2C0.78l0.85%2C0.09l0.44%2C0.66l-0.11%2C0.53l1.15%2C0.89l-0.09%2C-0.53l0.32%2C0.17l-0.53%2C-0.63l0.29%2C-0.38l-0.31%2C-1.1l0.41%2C-0.62l0.88%2C-0.06l0.03%2C-0.31l-0.65%2C-0.21L270.66%2C14l-0.38%2C-0.41l-0.79%2C0.4l-0.57%2C-0.66L267.91%2C13l0.36%2C-0.07l-0.22%2C-0.32l1.09%2C-0.33l0.13%2C0.31l0.33%2C-0.42l0.71%2C0.39l0.74%2C-0.14l0.55%2C-0.47l-0.09%2C-0.41l0.36%2C0.21l0.23%2C-0.7l-1.9%2C0.94l0.03%2C-0.36l-0.46%2C0.11l0.05%2C-0.58l-0.57%2C0.98l-0.79%2C0.25l-0.55%2C-0.37l-0.6%2C0.44l-0.23%2C-0.24l0.79%2C-1.22l-0.24%2C-0.83l0.87%2C-0.59l-0.79%2C-0.98l0.35%2C-0.31l0.49%2C0.5l0.93%2C-0.05l1.87%2C-1.65l0.12%2C-0.75l0.93%2C0.14l-0.03%2C0.73l0.39%2C-1.39l0.82%2C-0.21l0.49%2C-0.98l0.18%2C1.09l0.42%2C-0.23l0.5%2C0.4l-0.57%2C-0.6h0.51l-0.03%2C-0.42l-0.56%2C0.01l0.37%2C-1.68l0.8%2C-0.35l0.89%2C0.33l1.31%2C-0.89l0.04%2C-0.48L278.53%2C1.91z%22%2F%3E%0A%09%09%3Cpath%20fill%3D%22white%22%20stroke%3D%22none%22%20id%3D%22ES-RI%22%20title%3D%22La%20Rioja%22%20%20d%3D%22M443.67%2C67.53l-2.91%2C1.74l-0.5%2C0.03l-0.74%2C-0.72l0%2C0l-0.16%2C-0.16l0%2C0l-2.67%2C-0.65l-0.23%2C-1.24l0.36%2C-0.31l-1.44%2C-2.23l0.87%2C-0.5l0.03%2C-0.69l-2.92%2C-0.16l-0.9%2C0.51l-0.38%2C-1.55l-1.05%2C-0.5l-3.27%2C0.3l-0.46%2C0.76l-0.76%2C0.31l-0.76%2C-0.26l-0.05%2C1.63l-0.89%2C0.64l-0.89%2C2.06l-1.18%2C-0.39l-1.33%2C0.35l-0.82%2C-0.66l-1.13%2C0.22l-0.3%2C-0.85l1.28%2C-1.87l0.07%2C-0.73l-0.77%2C-0.78l-0.44%2C0.26l-0.6%2C-0.23l-0.48%2C0.56l0%2C0l-0.07%2C0.25l0%2C0L417.77%2C65l-1.2%2C0.24l-0.83%2C0.78l-0.87%2C-0.84l0%2C0v-0.29l0%2C0l-0.59%2C-1.78l-2.62%2C0.08l-2.6%2C-4.05l0.68%2C-0.58l0.39%2C-1.19l-0.47%2C-2.47l0.31%2C-0.45l0%2C0l-0.16%2C-0.12l0%2C0l-0.22%2C-0.85l1.26%2C-0.33l-0.58%2C-0.91l-0.56%2C-0.01l0.11%2C-1.12l0.61%2C0.02l-0.11%2C0.72l0.69%2C0.95l-0.18%2C-1.99l0.45%2C-0.79l-1.33%2C-1.54l0.52%2C-0.56l0.11%2C-0.95l-0.44%2C-0.35l-0.95%2C0.19l-0.26%2C-0.33l0.8%2C-0.43l0.78%2C-1.19l0%2C0l0.41%2C-0.1l0%2C0l-0.63%2C-1.91l1.78%2C0.32l0.37%2C-0.46l0.61%2C0.35l1%2C-0.13l0.93%2C0.72l0.38%2C-0.3l0.37%2C0.25l0.68%2C-0.64l0%2C0l0.41%2C0.33l0.02%2C0.76l0.63%2C-0.12l-0.04%2C0.77l-0.56%2C0.35l0%2C0l0.08%2C0.4l0%2C0l0.52%2C0.53l0.11%2C-0.48l0.33%2C0.14l0.63%2C-0.56l0.41%2C-1.55l0.66%2C0.01l1.57%2C0.99l-0.27%2C2.01l0%2C0l-0.36%2C0.87l0%2C0l0.77%2C-0.33l-0.03%2C0.6l0.6%2C0.24l0.27%2C0.74l1.13%2C-0.73l0.28%2C1.13l0.68%2C-0.79l1.05%2C0.38l-0.18%2C-0.44l0.76%2C-0.88l-0.13%2C1.08l1.02%2C0.15l0.77%2C-0.38l0.74%2C0.26l0%2C0l0.6%2C0.61l1.28%2C0.31l0.19%2C0.49l0.37%2C-0.09l-0.1%2C-0.42l0%2C0l0.23%2C-0.11l0%2C0l0.8%2C0.41l0.02%2C-0.38l0.28%2C0.08l0%2C0l0.19%2C0.36l0%2C0l0.17%2C0.39l0.94%2C0.17l-0.06%2C0.38l0.75%2C0.25l-0.04%2C0.28l0.8%2C-0.08l0.42%2C0.39l0.46%2C-0.39l1.17%2C-0.06l-0.17%2C0.75l1.01%2C1.13l-0.24%2C0.8l0.53%2C0.12l1.38%2C-0.94l0.61%2C0.22l0.7%2C0.38l0.13%2C0.66l0.62%2C-0.01l0.29%2C0.48l0.35%2C-0.21l0.11%2C0.99l1.24%2C0.44l-0.06%2C1.33l0.49%2C0.09l0.09%2C-0.34l0.82%2C0.39l0.16%2C0.73l2.64%2C0.58l0.4%2C0.75l0.6%2C-0.01l-0.55%2C0.71l0.53%2C0.78l-0.57%2C0.4l-0.45%2C0.26l-1.11%2C-0.65l-0.68%2C0.46l-1.12%2C-0.53l-1.85%2C2.48l-0.37%2C0.97l0.19%2C1.03l1.23%2C0.98l0.24%2C-0.17l0%2C0L443.67%2C67.53zM412.61%2C44.25l0.05%2C-0.14l0%2C0l0.07%2C-0.11l0%2C0l-0.02%2C-0.13l0%2C0l-0.01%2C-0.04l0%2C0l0.27%2C-0.03l0%2C0l-0.02%2C0.2l0%2C0l-0.13%2C0.16l0%2C0l-0.19%2C0.1l0%2C0L412.61%2C44.25zM414.07%2C44.21l0.17%2C-0.16l0%2C0l0.33%2C0.41l-0.51%2C-0.2l0%2C0V44.21z%22%2F%3E%0A%09%09%3Cpath%20fill%3D%22white%22%20stroke%3D%22none%22%20id%3D%22ES-MD%22%20title%3D%22Madrid%22%20%20d%3D%22M377.9%2C114.18l0.45%2C0.86l-1.69%2C0.1l0%2C0l0.05%2C-0.6l0.78%2C-0.51L377.9%2C114.18zM397.91%2C96.65l-0.04%2C0.58l0.81%2C0.48l0.57%2C1.49l1.73%2C0.42l-0.36%2C1.41l1.18%2C1.47l-0.54%2C0.49l-0.74%2C2.89l-0.47%2C0.01l0.52%2C0.92l-0.87%2C0.56l0.16%2C0.8l-1.16%2C1.95l1.27%2C0.15l0.48%2C0.65l0%2C0v0.11l0%2C0l-0.1%2C0.93l0.44%2C0.29l-0.88%2C1.42l0.64%2C0.41l0%2C0l0.03%2C0.11l0%2C0l0.5%2C-0.22l0.48%2C0.41l0.32%2C-0.78l0.57%2C0.49l0.19%2C1.14l0.66%2C0.33l0.64%2C-0.55l-0.16%2C0.36l0%2C0l-0.04%2C0.4l0%2C0l-0.37%2C0.2l0.44%2C0.47l-0.25%2C0.58l1.27%2C0.91l-0.34%2C1.22l0.68%2C0.04l0%2C0l0.16%2C-0.07l0%2C0l0.9%2C-0.09l0.86%2C0.9l0.07%2C2.57l1.17%2C0.1l0.67%2C1.22l-0.6%2C1.31l0.31%2C0.63l-1.08%2C1.37l-0.4%2C2.27l0.62%2C0.47l0.6%2C-1.05l1.04%2C-0.77l0.36%2C0.39l0.56%2C1.74l-0.2%2C1.35l0.47%2C1.12l-0.55%2C-0.21l-0.18%2C0.76l1.15%2C1.26l-0.88%2C1.2l-0.96%2C0.36l-1.08%2C-0.11l-0.17%2C-0.93l-0.51%2C0.32l0%2C0l-0.07%2C0l0%2C0l-0.38%2C0.79l-1.7%2C0.1l-0.25%2C0.33l-0.75%2C-0.19l-0.82%2C-1l-1.2%2C0.22l0.05%2C0.71l-0.59%2C0.7l-0.78%2C-0.39l-0.6%2C0.33l-0.05%2C-0.42l-0.58%2C0.3l-0.99%2C-0.27l-0.39%2C0.98l-1.86%2C0.27l-0.77%2C0.8l0%2C0l-0.41%2C0.1l0%2C0l0.31%2C0.74l-1.92%2C0.69l-0.34%2C-0.22l-0.95%2C0.51l-0.35%2C0.7l0%2C0l-0.18%2C0.11l0%2C0l-1.14%2C1.15l-1.66%2C-0.63l-0.21%2C-0.47l0%2C0l0.02%2C-0.14l0%2C0l-0.2%2C-0.28l0.54%2C-0.42l0.52%2C-0.1l0.2%2C0.41l0.66%2C-0.88l0.64%2C0.29l0.69%2C-0.67l-0.05%2C0.66l0.33%2C-0.26l-0.15%2C-0.5l0.63%2C0.28l0.11%2C-0.24l0%2C0l-0.22%2C-0.07l0%2C0l-0.14%2C-0.3l0.61%2C-0.29l0.36%2C-1.12l0.44%2C0.15l1.75%2C-1.44l0.39%2C-1.9l-1.49%2C-0.77l-0.13%2C-0.46l-0.58%2C0.37l-0.88%2C-0.53l-0.61%2C0.51l-0.76%2C-0.22l-0.98%2C-1.36l-0.77%2C0.57l-1.08%2C-1.05l-1.06%2C0l-0.44%2C-0.45l-0.51%2C0.51l-0.11%2C-0.84l-1.04%2C0.13l-0.93%2C-0.93l0.05%2C-0.48l-1.32%2C-0.59l-0.82%2C0.83l-1.16%2C-0.13l0.04%2C-0.65l-1.31%2C-1.1l-1.57%2C0.8l-0.62%2C1.4l-0.68%2C0.51l-0.26%2C-0.5l-0.37%2C0.29l-0.31%2C-0.46l-0.45%2C0.03l-0.18%2C-2.5l-0.6%2C-0.37l-0.14%2C1.05l-1.4%2C1.05l-0.07%2C0.76l-2.12%2C0.74l-0.43%2C0.6l-1.33%2C-0.6l0%2C0l0.52%2C-0.27l-0.24%2C-1.23l1.08%2C-1.23l-0.48%2C-1.74l0.54%2C-0.09l0.68%2C1.03l1.29%2C-0.15l-0.17%2C-0.76l0.6%2C-0.33l-0.1%2C-1.31l0.56%2C-0.73l2.72%2C-0.15l-0.51%2C-0.93l0.68%2C-1.03l-0.32%2C-2.47l0.16%2C-0.54l0.87%2C-0.5l0.3%2C-1.37l-0.33%2C-0.88l0%2C0l0.52%2C-0.01l0.22%2C0.79l0.45%2C0.13l0%2C0l0.45%2C-0.04l0%2C0l1.86%2C-0.7l-0.36%2C-1.55l0.38%2C-0.78l0%2C0l1.74%2C-2.14l0.73%2C-1.59l1.15%2C0.42l1.34%2C-0.21l1.12%2C-5l0.44%2C-0.09l0.79%2C-1.38l3.06%2C-1.23l1.1%2C-1.88l1.71%2C-1.05l1.23%2C-1.89l1.15%2C-0.82L397.91%2C96.65z%22%2F%3E%0A%09%09%3Cpath%20fill%3D%22white%22%20stroke%3D%22none%22%20id%3D%22ES-MC%22%20title%3D%22Murcia%22%20%20d%3D%22M474.21%2C216.69l-0.2%2C1.18l0.57%2C2.05l-0.7%2C-1.93L474.21%2C216.69zM473.98%2C215.62l-0.06%2C0.6l0.52%2C0.46l-0.54%2C-0.41l-0.21%2C-0.6L473.98%2C215.62zM430.54%2C207.06l0.27%2C-1.41l1.71%2C-1.42l1.48%2C-3.29l2.68%2C-1.17l0.95%2C-1.34l0%2C0l0.36%2C-0.66l0%2C0l0.5%2C-0.37l1.77%2C0.85l1.99%2C-0.56l3.4%2C-2.02l-0.3%2C-0.46l0.67%2C0.14l0.03%2C-0.46l0.69%2C-0.06l0.72%2C0.6l0.45%2C-0.38l0.51%2C0.5l-0.26%2C0.53l0%2C0l0.01%2C0.14l0%2C0l0.62%2C1l2.16%2C0.02l3.02%2C-2.26l-0.05%2C-3.72l-0.47%2C-1.81l0.27%2C-0.94l0.95%2C-0.67l0.11%2C-2.33l1.71%2C-1.69l0.51%2C-0.18l0.65%2C0.92l2.54%2C-2.08l0%2C0l0.33%2C-0.16l0%2C0l1.37%2C-0.43l1.82%2C0.56l0.1%2C0.95l2.44%2C1.91l0%2C0l0.69%2C2.85l-0.65%2C1.75l0.32%2C0.92l-2.15%2C2.03l0.4%2C0.21l-0.19%2C2.93l2.9%2C0.33l0.6%2C1.52l-0.6%2C2.85l-1.34%2C2.2l0.17%2C1.55l3.19%2C6.07l1.97%2C2.09l1.3%2C0.66l0.57%2C-0.08l0%2C0l0.38%2C1.95l-0.98%2C-0.97l-0.53%2C1.41l-1.11%2C0.96l-0.44%2C0.98l1.66%2C2.2l1.7%2C0.91l0.59%2C-0.79l0.42%2C0.7l0.4%2C-0.04l-0.9%2C1.09l-1.66%2C0.4l-1.02%2C0.69l-0.68%2C-0.34l-0.87%2C0.23l-1.15%2C0.84l-1.17%2C-0.23l-0.12%2C-0.27l0.57%2C-0.08l-0.8%2C-0.19l-0.26%2C-0.42l0.26%2C-0.32l-0.52%2C-0.11l0.14%2C0.68l-0.55%2C-0.14l-0.41%2C0.44l-1.37%2C-0.38l-0.99%2C0.54l-0.46%2C0.57l0.44%2C0.61l-1.51%2C-0.24l-0.15%2C-0.63l-0.88%2C-0.65l-1.14%2C-0.09l-0.31%2C0.65l-1.91%2C-0.17l-2.02%2C1.9l-1.6%2C0.7l-0.74%2C2.19l-0.89%2C-0.29l-1.16%2C0.92l-0.92%2C0.15l-0.87%2C0.88l0%2C0l-2.96%2C-2.32l-2.05%2C-0.37l0.04%2C0.62l-0.98%2C-0.72l-4.08%2C-6.6l0%2C0l-0.18%2C-0.19l0%2C0l-0.3%2C-1.64l0.47%2C-0.92l-0.37%2C-1.65l0.37%2C-2.29l0.57%2C-0.79l-0.2%2C-0.26l0%2C0l-0.17%2C0.01l0%2C0l-0.49%2C-0.21l-0.44%2C0.39l-1.11%2C-0.51l-0.6%2C0.35l-1.07%2C-0.94l-1.31%2C0.41l-2.19%2C-1.7l-1.25%2C-2.23L430.54%2C207.06z%22%2F%3E%0A%09%09%3Cpath%20fill%3D%22white%22%20stroke%3D%22none%22%20id%3D%22ES-NC%22%20title%3D%22Navarra%22%20%20d%3D%22M449.2%2C17.98L450.01%2C18.16L449.83%2C19.05L450.44%2C20.21L451.31%2C20.29L451.85%2C19.21L451.68%2C18.86L453.01%2C18.65L454.42%2C19.49L455.78%2C19.44L456.59%2C20.21L456.59%2C22.54L456.06%2C22.97L455.71%2C24.83L454.11%2C26.29L455.01%2C27.85L457.36%2C28.51L457.62%2C26.05L458.29%2C25.36L459.62%2C25.17L458.56%2C26.99L459.82%2C27.94L461.15%2C27.62L463.04%2C28.66L463.11%2C29.26L463.87%2C28.67L464.78%2C29.55L466.66%2C29.85L467.08%2C30.5L468.52%2C31.29L469.55%2C30.91L469.82%2C31.24L472.19%2C31.38L473.67%2C30.75L474.33%2C31.59L474.15%2C31.99L474.5%2C32.55L474.5%2C32.55L472.93%2C32.48L471.99%2C33.19L471.91%2C34.45L470.91%2C35.24L470.8%2C37L471.13%2C37.45L470.67%2C38.34L469.7%2C38.42L469.69%2C39.06L469.08%2C39.05L467.82%2C40.53L466.28%2C40.64L465.9%2C40.99L465.89%2C42.61L462.83%2C42.57L462.71%2C43.93L462.11%2C43.91L462.67%2C44.37L461.49%2C45.16L461.45%2C46.23L461.45%2C46.23L461.31%2C46.23L461.31%2C46.23L460.74%2C46.48L459.78%2C45.95L459.14%2C47.19L459.47%2C48.97L457.71%2C50.84L457.22%2C52.52L457.88%2C52.79L458.02%2C53.39L456.13%2C55.68L456.33%2C56.34L455.63%2C58.31L456.31%2C59.75L456.12%2C61.74L457%2C62.47L457.39%2C63.69L458.23%2C63.71L458.23%2C63.71L458.51%2C63.68L458.51%2C63.68L458.67%2C64.78L457.74%2C65.71L456.55%2C67.91L456.64%2C68.4L455.88%2C69.3L453.37%2C69.15L453.37%2C69.15L453.05%2C69.45L453.05%2C69.45L452.53%2C69.61L452.53%2C69.61L451.87%2C69.48L451.87%2C69.48L449.25%2C67.65L447.55%2C67.96L446.12%2C66.57L444.25%2C66.6L443.97%2C66.05L443.97%2C66.05L443.73%2C66.23L442.5%2C65.24L442.31%2C64.22L442.67%2C63.24L444.53%2C60.77L445.64%2C61.3L446.32%2C60.84L447.43%2C61.49L447.88%2C61.23L448.45%2C60.83L447.92%2C60.05L448.47%2C59.34L447.87%2C59.34L447.46%2C58.59L444.82%2C58.01L444.66%2C57.28L443.84%2C56.89L443.75%2C57.22L443.26%2C57.13L443.32%2C55.81L442.08%2C55.37L441.98%2C54.38L441.63%2C54.59L441.34%2C54.12L440.73%2C54.13L440.59%2C53.46L439.89%2C53.08L439.29%2C52.86L437.91%2C53.8L437.38%2C53.68L437.63%2C52.88L436.61%2C51.75L436.78%2C51L435.61%2C51.06L435.15%2C51.45L434.73%2C51.06L433.93%2C51.15L433.96%2C50.87L433.22%2C50.61L433.28%2C50.23L432.33%2C50.06L432.16%2C49.68L432.16%2C49.68L431.98%2C49.32L431.98%2C49.32L431.69%2C49.24L431.67%2C49.62L430.87%2C49.21L430.87%2C49.21L430.63%2C49.32L430.63%2C49.32L430.74%2C49.74L430.37%2C49.83L430.18%2C49.35L428.9%2C49.04L428.3%2C48.43L428.3%2C48.43L428.28%2C47.66L429.11%2C47.4L429%2C44.43L428.29%2C44.14L427.49%2C45.54L427.2%2C44.82L426.45%2C44.85L426.21%2C43.77L426.67%2C43.89L427.51%2C42.65L428.49%2C42.07L429.36%2C42.29L429.66%2C42.78L429.41%2C43.11L431.83%2C42.46L431.92%2C41.87L431.8%2C41.51L431.33%2C41.71L430.98%2C39.82L431.17%2C39.24L432.66%2C38.89L432.17%2C37.47L433.46%2C35.47L433.2%2C33.79L433.2%2C33.79L432.98%2C33.47L432.98%2C33.47L433.3%2C33.48L433.34%2C32.41L434.08%2C31.46L434.88%2C31.99L436.33%2C31.81L436.96%2C31.51L437.31%2C30.56L438.72%2C30.31L439.02%2C29.66L438.65%2C28.43L439.2%2C27.82L439.2%2C27.82L439.27%2C27.48L439.27%2C27.48L439.42%2C26.87L441.19%2C25.96L442.41%2C24.55L441.93%2C23.9L442.1%2C21.24L442.97%2C21.86L443.13%2C20.99L443.53%2C21.72L443.85%2C21.29L443.85%2C21.29L444.08%2C21.24L444.08%2C21.24L445.36%2C20.46L445.41%2C19.32L445.41%2C19.32L445.71%2C18.98L445.71%2C18.98L445.77%2C18.91L445.77%2C18.91L446.18%2C18.95L446.18%2C18.95L447.08%2C18.45L447.08%2C18.45L448.1%2C17.95z%22%2F%3E%0A%09%09%3Cpath%20fill%3D%22white%22%20stroke%3D%22none%22%20id%3D%22ES-IB%22%20title%3D%22Balearic%20Islands%22%20%20d%3D%22M533.41%2C182.06l0.48%2C0.79l0.43%2C-0.1l0.16%2C0.89l1.03%2C0.86l0.37%2C0.17l1.06%2C-0.66l0.44%2C0.8l-0.32%2C0.6l-1.33%2C-0.05l-1.01%2C-0.86l-1.07%2C-0.25l-1.72%2C1.53l-0.13%2C-2.72l0.44%2C-0.55l0.25%2C0.24l0.58%2C-0.31l0.18%2C-1.22L533.41%2C182.06zM532.95%2C180.34l0.28%2C0.77l-0.42%2C-0.35L532.95%2C180.34zM536.03%2C169.18l0.6%2C0.83l1.27%2C0.1l-0.17%2C0.27l0.32%2C0.13l-0.5%2C0.14l-0.09%2C0.44l0.9%2C1.23l-0.99%2C0.43l-0.11%2C0.9l-1.27%2C0.21l-0.09%2C0.96l-0.3%2C0.1l0.24%2C0.27l-0.5%2C-0.06l-0.91%2C1.18l-0.54%2C-0.16l-0.01%2C0.49l-0.46%2C-0.45l-0.04%2C0.46l-0.48%2C-0.02l-0.45%2C0.94l0.08%2C1.56l-0.59%2C-0.37l-0.37%2C0.41l-0.73%2C-1.38l-0.66%2C0.5l-0.05%2C-0.36l-0.54%2C0.16l0%2C-0.47l-0.72%2C-0.13l-0.65%2C0.81l-0.65%2C-0.54l-0.3%2C-1.09l0.62%2C-1.29l-0.57%2C-0.67l0.38%2C-0.56l0.43%2C0.29l1.67%2C-0.22l-0.6%2C-0.7l0.38%2C-0.58l-0.13%2C-0.78l1.31%2C-0.76l0.47%2C-0.72l0.46%2C0.4l0.35%2C-0.6l0.78%2C0.06l0.2%2C-0.5l0.43%2C0.39l1.27%2C-1.02l0.29%2C0.41l0.27%2C-0.53L536.03%2C169.18zM574.62%2C167.55l0.61%2C0.21l-0.53%2C0.38l0.03%2C0.72l-1%2C-0.02l-0.12%2C-1.2l0.4%2C0.64l-0.06%2C-0.41l0.56%2C0.21L574.62%2C167.55zM557.67%2C152.72l-0.75%2C0.53l0.94%2C-0.93L557.67%2C152.72zM581.65%2C139.61l-0.27%2C0.55l-1.29%2C0.73l-0.64%2C-0.13l-0.56%2C0.99l-0.51%2C-0.43l-0.33%2C0.37l0.09%2C0.83l0.58%2C0.66l2.68%2C-1.11l-0.4%2C0.31l0.21%2C0.72l-0.5%2C0.72l-1.5%2C0.21l-0.02%2C1.07l0.52%2C0.93l0.76%2C0.7l2.3%2C0.98l2.05%2C-1.08l0.52%2C-1.04l2.34%2C1.57l0.72%2C-0.06l-0.17%2C0.87l0.71%2C0.26l-0.63%2C0.35l-0.02%2C1.72l-0.39%2C-0.02l-0.13%2C0.77l-0.79%2C-0.08l-0.38%2C0.53l-0.22%2C1.12l0.49%2C0.37l-0.69%2C0.14l-0.29%2C0.85l-0.98%2C0.45l0.22%2C0.14l-1.44%2C1.7l-0.35%2C2.52l-0.34%2C-0.35l0.17%2C0.33l-0.84%2C1.63l-0.31%2C0l0.2%2C0.2l-1.24%2C0.41l-0.45%2C0.87l-0.67%2C-0.12l-2.03%2C2.14l-0.61%2C0.12l-1%2C-1.55l-0.75%2C-0.21l0.09%2C-0.78l-0.84%2C-0.85l-0.78%2C-0.06l-0.44%2C0.44l-0.81%2C-0.48l-1.3%2C-0.07l-0.18%2C0.39l-0.6%2C-0.38l-0.53%2C0.15l-1.26%2C-1.55l0.14%2C-1.23l-0.68%2C-1.21l0.72%2C-1.22l-2.14%2C-1.79l-0.97%2C0.05l0.25%2C-0.22l-0.29%2C-0.04l-0.25%2C0.65l0.45%2C-0.15l-0.21%2C0.3l-0.71%2C-0.23l-0.43%2C0.73l-1.39%2C0.25l0.21%2C0.44l-0.37%2C0.22l-0.29%2C1.67l-0.88%2C-0.52l-0.39%2C0.23l0.08%2C-0.88l-0.62%2C-0.5l0.64%2C-0.42l-0.75%2C-0.67l-0.89%2C0.49l0.09%2C-0.5l-0.46%2C0l-0.49%2C0.59l0.01%2C-0.47l-0.69%2C0.06l0.73%2C-0.51l-0.48%2C0.08l-0.7%2C-0.72l0.27%2C-1.42l2.88%2C-1.68l1.82%2C-1.75l0.74%2C0.04l0.84%2C-0.58l0.91%2C-1.4l1.18%2C-0.58l0.16%2C-0.69l0.34%2C-0.23l0.32%2C0.3l0.17%2C-0.7l2.06%2C-1.02l0.08%2C-0.55l1.83%2C-0.19l0.24%2C-0.48l2.22%2C-1.02l0.4%2C-0.59l0.89%2C0.41l1.63%2C-1.02l-0.11%2C0.27l0.62%2C-0.1l-0.03%2C0.46l0.89%2C-0.55l0.72%2C0.13l1.24%2C-0.98l0.41%2C-0.04l-0.18%2C0.34L581.65%2C139.61zM607.66%2C143.5l-3.59%2C-2.36l-2.06%2C-0.79l-1.63%2C0.56l-2.06%2C0.02l0.27%2C-2.8l-0.96%2C0.11l-0.19%2C-0.77l0.85%2C-1.1l1.21%2C-0.23l0.85%2C-0.06l0.63%2C0.49l0.33%2C-0.6l1.22%2C0.42l1.44%2C-0.51l0.58%2C0.48l0.96%2C-0.59l-0.2%2C-0.72l0.47%2C0.11l-0.17%2C0.93l0.3%2C0.53l0.81%2C-0.66l-0.17%2C1.31l0.37%2C-0.3l-0.1%2C-1.13l0.97%2C0.22l-0.32%2C0.92l0.57%2C0.44l0.36%2C-0.36l0.28%2C1.38l0.05%2C-0.7l0.34%2C0.57l1.36%2C0l-0.39%2C0.14l0.31%2C0.38l-0.32%2C0.63l0.4%2C0.17l-0.12%2C0.46l0.41%2C-0.17l0.14%2C1.37l0.61%2C0.49l0.06%2C0.64l0.46%2C0.14l-0.46%2C0.22l-0.39%2C-0.73l-1.05%2C-0.18l1.06%2C0.52l0.3%2C0.57l-0.1%2C1.17l-0.85%2C0.82l-1.75%2C-0.56L607.66%2C143.5z%22%2F%3E%0A%09%09%3Cpath%20fill%3D%22white%22%20stroke%3D%22none%22%20id%3D%22ES-PV%22%20title%3D%22Basque%20Country%22%20%20d%3D%22M418.47%2C12.92l0.9%2C-0.37l0.32%2C1l1.29%2C0.87l1.23%2C-0.37l0.78%2C0.91l0.45%2C-0.11l0.47%2C0.47L424.5%2C15l0.35%2C0.63l1.08%2C-0.12l1.31%2C1.52l2.88%2C1.38l1.96%2C0.13l1.49%2C-0.6l0.6%2C0.26l0.09%2C-0.29l0.35%2C0.71l0.9%2C0.28l3.44%2C-1.29l1.07%2C0.2l-0.05%2C-0.37l0.86%2C-0.47l1.24%2C0.06l1.84%2C-1.6l1.58%2C-0.6l0.23%2C1.23l-0.69%2C0.42l1.33%2C0.28l0.57%2C0.5l0.16%2C1.16l0%2C0l-0.9%2C0.5l0%2C0l-0.41%2C-0.04l0%2C0l-0.06%2C0.06l0%2C0l-0.3%2C0.34l0%2C0l-0.05%2C1.15l-1.28%2C0.78l0%2C0l-0.23%2C0.05l0%2C0l-0.32%2C0.42l-0.4%2C-0.72l-0.16%2C0.86l-0.87%2C-0.61l-0.17%2C2.66l0.48%2C0.65l-1.22%2C1.4l-1.77%2C0.91l-0.14%2C0.61l0%2C0l-0.07%2C0.34l0%2C0l-0.55%2C0.6l0.37%2C1.23l-0.29%2C0.65l-1.42%2C0.25l-0.35%2C0.94l-0.63%2C0.3l-1.45%2C0.18l-0.8%2C-0.53l-0.75%2C0.95l-0.04%2C1.07l-0.33%2C-0.01l0%2C0l0.22%2C0.32l0%2C0l0.26%2C1.68l-1.29%2C2l0.49%2C1.42l-1.49%2C0.35l-0.19%2C0.58l0.34%2C1.9l0.47%2C-0.21l0.13%2C0.36l-0.09%2C0.59l-2.42%2C0.65l0.26%2C-0.33l-0.31%2C-0.49l-0.86%2C-0.22l-0.98%2C0.58l-0.84%2C1.25l-0.46%2C-0.13l0.24%2C1.09l0.75%2C-0.03l0.29%2C0.72l0.8%2C-1.4l0.71%2C0.28l0.11%2C2.98l-0.83%2C0.26l0.02%2C0.76l0%2C0l-0.74%2C-0.26l-0.77%2C0.38l-1.02%2C-0.15l0.13%2C-1.08l-0.76%2C0.88l0.18%2C0.44l-1.05%2C-0.38l-0.68%2C0.79l-0.28%2C-1.13l-1.13%2C0.73l-0.27%2C-0.74l-0.6%2C-0.24l0.03%2C-0.6l-0.77%2C0.33l0%2C0l0.36%2C-0.87l0%2C0l0.27%2C-2.01l-1.57%2C-0.99l-0.66%2C-0.01l-0.41%2C1.55l-0.63%2C0.56l-0.33%2C-0.14l-0.11%2C0.48l-0.52%2C-0.53l0%2C0l-0.08%2C-0.4l0%2C0l0.56%2C-0.35l0.04%2C-0.77l-0.63%2C0.12l-0.02%2C-0.76l-0.41%2C-0.33l0%2C0l-0.84%2C-0.38l-0.29%2C-0.7l0%2C0l0.07%2C-0.07l0%2C0l-0.14%2C-0.87l-0.76%2C-0.52l-1.36%2C0.14l-0.99%2C-1.23l0%2C0l0%2C-0.13l0%2C0l-0.69%2C0.05l-0.18%2C-0.96l-2.67%2C0.29l0.63%2C-1.17l-0.92%2C-0.57l1.36%2C-2.5l-0.28%2C-0.77l-1.05%2C1.3l-0.93%2C-0.46l-0.82%2C1.12l0.42%2C0.41l-0.26%2C0.05l-1.92%2C-2.05l1.65%2C-2.51l2.15%2C0.57l-0.06%2C0.6l1.54%2C0.69l1.97%2C-0.33l1.07%2C-1.11l-1.68%2C-1.18l0.13%2C-0.4l-0.67%2C-0.8l-2.27%2C-0.15l-0.85%2C-0.55l0.95%2C-0.29l0.02%2C-1.4l-0.45%2C-0.26l0.62%2C-0.86l-0.2%2C-0.46l-0.29%2C0.2l-0.78%2C-0.53l1.06%2C-1.82l-0.65%2C-0.42l-1.48%2C0.22l-0.85%2C-0.98l-4.46%2C2.39l0%2C0l-0.46%2C-2.8l0%2C0l-0.18%2C-0.28l0%2C0l-0.22%2C-0.71l1.39%2C-0.38l0.42%2C-0.89l1.19%2C-0.29l0.2%2C-0.84l0.25%2C0.3l0.75%2C-0.29l0.43%2C0.39l1.46%2C-0.7l0.42%2C0.93l0.5%2C-0.55l0.91%2C-0.12l0.11%2C-1.94l0%2C0l0.7%2C-0.06l0.32%2C0.43l0.19%2C-0.74l0.32%2C0l1.38%2C0.91l0.39%2C-0.28l-0.3%2C0.27l0.64%2C0.5l0.17%2C-0.85l-0.62%2C-0.95l0.88%2C-0.33l0.93%2C-1.12l0.64%2C0.01l-0.01%2C-0.87l3.74%2C0.21L418.47%2C12.92zM404.86%2C22.15l-0.6%2C-2.02l1.09%2C-0.51l0.47%2C0.26l-0.54%2C1.05l0.03%2C1.05l0%2C0L404.86%2C22.15zM417.04%2C37.18l0.07%2C0.02l0%2C0l0.1%2C0.17l0%2C0l0.16%2C0.14l0%2C0l2.5%2C-0.29l2.39%2C1.05l1.1%2C-0.19l0.38%2C0.73l0.83%2C-0.45l-0.42%2C1.43l-0.4%2C0.47l-0.3%2C-0.14l-0.24%2C0.69l0.87%2C1.04l1.48%2C-0.57l0.15%2C1.39l-0.84%2C0.27l-0.17%2C-0.39l-2.21%2C0.07l-0.63%2C-0.91l-1.23%2C-0.06l-0.38%2C0.44l-1.34%2C-0.15l-0.48%2C-1.18l-1.07%2C-0.38l-1.22%2C-1.14l0.82%2C-1.54l0%2C0L417.04%2C37.18z%22%2F%3E%0A%09%09%3Cpath%20fill%3D%22white%22%20stroke%3D%22none%22%20id%3D%22ES-VC%22%20title%3D%22Valencia%22%20%20d%3D%22M454.74%2C133.14l1.28%2C0.18l0%2C0l0.31%2C0.18l0%2C0l0.48%2C-0.2l0.62%2C0.3l0%2C0l0.49%2C-0.43l0%2C0l0.45%2C-0.2l-0.01%2C-1.78l0.54%2C-0.46l0.03%2C0.32l0%2C0l0.17%2C0.43l0%2C0l0.43%2C1.05l0.81%2C0.5l0.01%2C1.02l2.64%2C0.13l1.92%2C1.54l0.17%2C0.69l-0.33%2C0.47l-2.22%2C0.91l0%2C0l-2.25%2C0.57l-0.72%2C-0.23l0%2C0l-0.05%2C-0.1l0%2C0l-2.66%2C-0.34l-1.22%2C-2.72l0.28%2C-0.27l-1.19%2C-0.86L454.74%2C133.14zM463.16%2C139.24l0.48%2C0.33l0.21%2C-0.37l0.65%2C0.15l0.55%2C-0.39l2.27%2C-0.07l1.51%2C0.85l0.32%2C-0.28l0.44%2C0.89l-0.24%2C0.76l0.34%2C0.98l-0.3%2C0.63l1.15%2C0.87l2.03%2C-1.2l-1.13%2C-1.51l0.06%2C-1.88l1.46%2C-0.59l0.73%2C-1.85l1.96%2C0.07l1.37%2C-1.06l0.44%2C0.13l-0.36%2C-1.16l0.5%2C-0.82l0.83%2C-0.39l0.96%2C-4.06l1.38%2C0.84l1.81%2C-0.55l1.18%2C-0.71l-0.47%2C-1.08l0.3%2C-0.41l0.63%2C0.03l0.74%2C-1.24l1.58%2C-0.91l-0.15%2C-0.79l-1.63%2C-1.96l0.35%2C-0.54l1.68%2C-0.67l-0.12%2C-0.81l-0.65%2C-0.56l0.19%2C-3.41l-0.83%2C0.25l-1.24%2C-0.38l-0.26%2C-1.87l1.33%2C-0.5l0.61%2C0.69l1.93%2C-1.09l0.16%2C-1.77l0.93%2C-1.54l1.41%2C-0.05l0.03%2C0.62l0.97%2C0.86l1.23%2C0.58l1.09%2C-0.09l0%2C0l0.54%2C-0.03l0%2C0l0.54%2C0.18l0%2C0l0.01%2C0.11l0%2C0l0.32%2C1l0%2C0l0.32%2C0.12l0%2C0l1.84%2C-1.27l1.06%2C0.28l0.62%2C-0.52l0%2C0l0.75%2C0.35l0.77%2C-0.3l0.31%2C1.13l0%2C0h0.15l0%2C0l0.63%2C-0.08l0%2C0l0.27%2C0.27l0%2C0l0.08%2C0.09l0%2C0l0.2%2C0.08l0%2C0l-0.55%2C1.63l0.41%2C0.56l1.59%2C0.74l1.7%2C0.21l1.12%2C0.87l-0.13%2C1.09l2.06%2C0.88l0%2C0l-1.01%2C2.29l-0.05%2C-0.27l-1.54%2C2.36l-0.25%2C1.52l-2.25%2C2.9l-1.06%2C0.81l-0.57%2C1.58l-1.97%2C1.26l-1.32%2C3.3l-2.65%2C1.74l-1.49%2C4.14l-1.61%2C1.95l-0.49%2C0.04l-2.66%2C4.4l-0.82%2C2.81l-1.4%2C1.57l-1.56%2C3.42l0.05%2C2.14l-0.38%2C-0.29l0.34%2C0.58l-0.45%2C0.21l0.84%2C3.67l2.43%2C5.08l-0.62%2C0.43l0.06%2C1.09l2.1%2C5.19l3.77%2C4.14l3.96%2C0.88l-0.43%2C0.14l0.19%2C0.3l0.14%2C-0.29v0.39l2.08%2C1.05l-0.4%2C0.39l0.22%2C0.68l0.52%2C0.48l0.38%2C-0.15l0.27%2C0.97l-1.4%2C0.55l-0.89%2C1.38l-0.56%2C-0.21l-0.85%2C0.48l-0.67%2C0.94l0.25%2C0.5l-0.93%2C-0.36l-0.53%2C0.56l-0.88%2C-0.17l-0.72%2C0.43l-0.94%2C1.38l0.35%2C0.56l-1.27%2C1.33l-1.47%2C-0.39l-0.59%2C0.68l-3.1%2C0.98l-2.41%2C1.58l-0.78%2C1.34l0.01%2C1.79l-1.16%2C-0.34l-1.19%2C1.24l0.26%2C-0.58l-0.61%2C0.29l-0.42%2C1.8l0.29%2C2.69l-0.4%2C0.48l-1.91%2C0.04l-0.59%2C0.6l-0.75%2C2.46l-0.12%2C3.4l-0.55%2C0.89l-0.89%2C0.3l-0.59%2C1.91l-0.84%2C0.47l-0.31%2C1.72l0%2C0l-0.57%2C0.08l-1.3%2C-0.66l-1.97%2C-2.09l-3.19%2C-6.07l-0.17%2C-1.55l1.34%2C-2.2l0.6%2C-2.85l-0.6%2C-1.52l-2.9%2C-0.33l0.19%2C-2.93l-0.4%2C-0.21l2.15%2C-2.03l-0.32%2C-0.92l0.65%2C-1.75l-0.69%2C-2.85l0%2C0l1.74%2C-0.03l1.29%2C-1.37l-1.25%2C-2.65l0.9%2C-0.42l0.14%2C-1.36l-0.35%2C-1.11l0.32%2C-1.3l-0.66%2C-0.59l-0.3%2C-1.19l-1.12%2C-0.2l-0.88%2C0.54l-3.01%2C0.19l-2.23%2C-3.34l-1.01%2C-0.75l0.21%2C-2.11l2%2C-3.62l0.52%2C-3.35l-1.24%2C-0.68l-0.32%2C0.33l-0.91%2C-0.35l0%2C0l-0.16%2C-0.08l0%2C0l-0.57%2C-0.07l0%2C0h-0.16l0%2C0l-0.94%2C-0.35l0%2C0l-0.18%2C-0.05l0%2C0l-0.23%2C0.29l-0.84%2C-0.77l-0.47%2C0.04l0%2C-0.44l-0.67%2C-0.05l0.29%2C-0.31l-0.69%2C-0.16l-0.05%2C0.65l-0.06%2C-0.33l0%2C0l-0.06%2C-0.16l0%2C0l-0.67%2C0.49l0%2C0l0.12%2C-0.06l0%2C0l0.05%2C-0.48l-0.5%2C-0.18l0.39%2C-0.01l-0.19%2C-0.61l0%2C0l-0.07%2C0.06l0%2C0l-0.38%2C0.21l0.26%2C-0.32l-0.61%2C0l0.18%2C-0.65h-0.6l0%2C0l0.2%2C-0.24l0%2C0l-0.63%2C-0.09l-0.23%2C-0.81l0.41%2C-0.15l0.27%2C-0.7l-0.24%2C-0.63l0.35%2C-0.16l-0.1%2C-1.64l-0.48%2C-0.09l1.57%2C-0.95l1.59%2C-3.14l0.93%2C-0.79l0.78%2C0.29l0%2C0l0.73%2C0.35l0%2C0l0.96%2C-0.29l0.44%2C-0.68l-0.35%2C-1.4l1.6%2C-2.42l0.46%2C-3.35l0%2C0l0.09%2C-0.43l0%2C0l-0.39%2C-0.7l0.18%2C-0.58L463.16%2C139.24z%22%2F%3E%0A%09%3C%2Fg%3E%0A%3C%2Fsvg%3E)
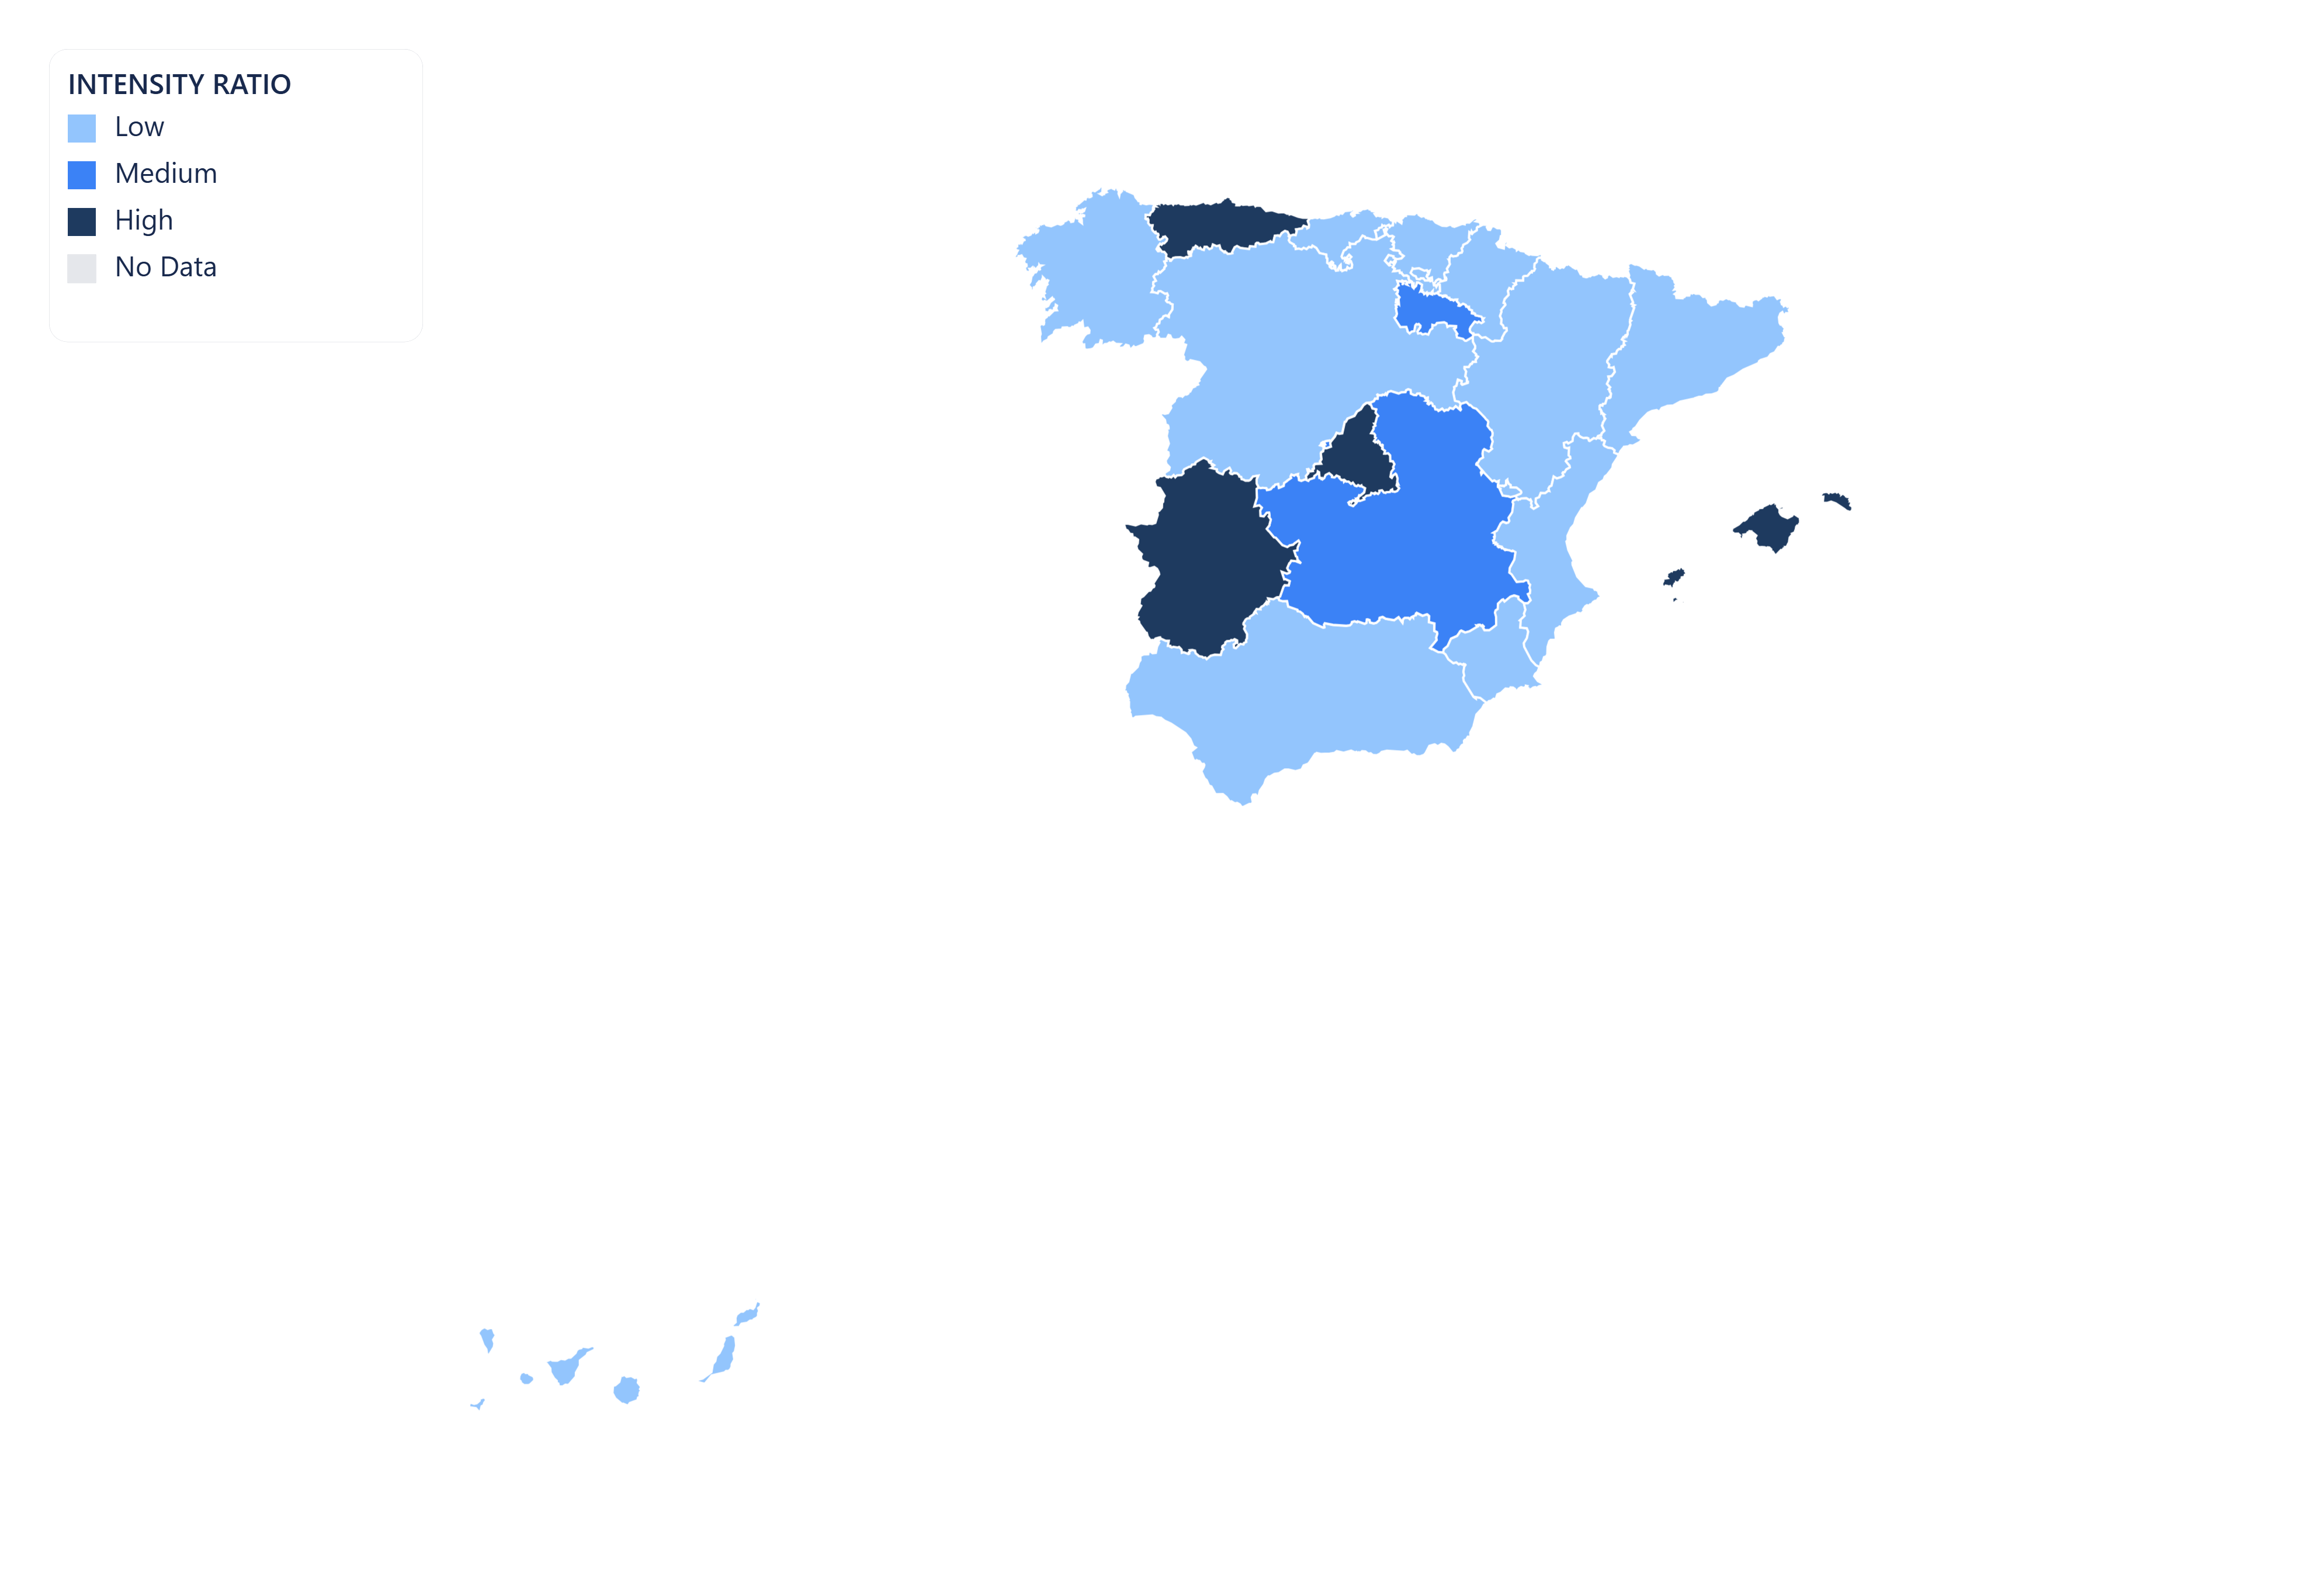
Choropleth Map of Spain (España)
Regionify is a choropleth map tool that turns regional data into clear, publish-ready visualizations. Color administrative divisions by any numeric metric — GDP per capita, population density, election results, or your own dataset — then export as PNG, SVG, animated GIF, or an embeddable iframe. No GIS expertise required.
Create your map of SpainWhat you can create for Spain with Regionify
From static maps to animated time-series — every format, ready to export.
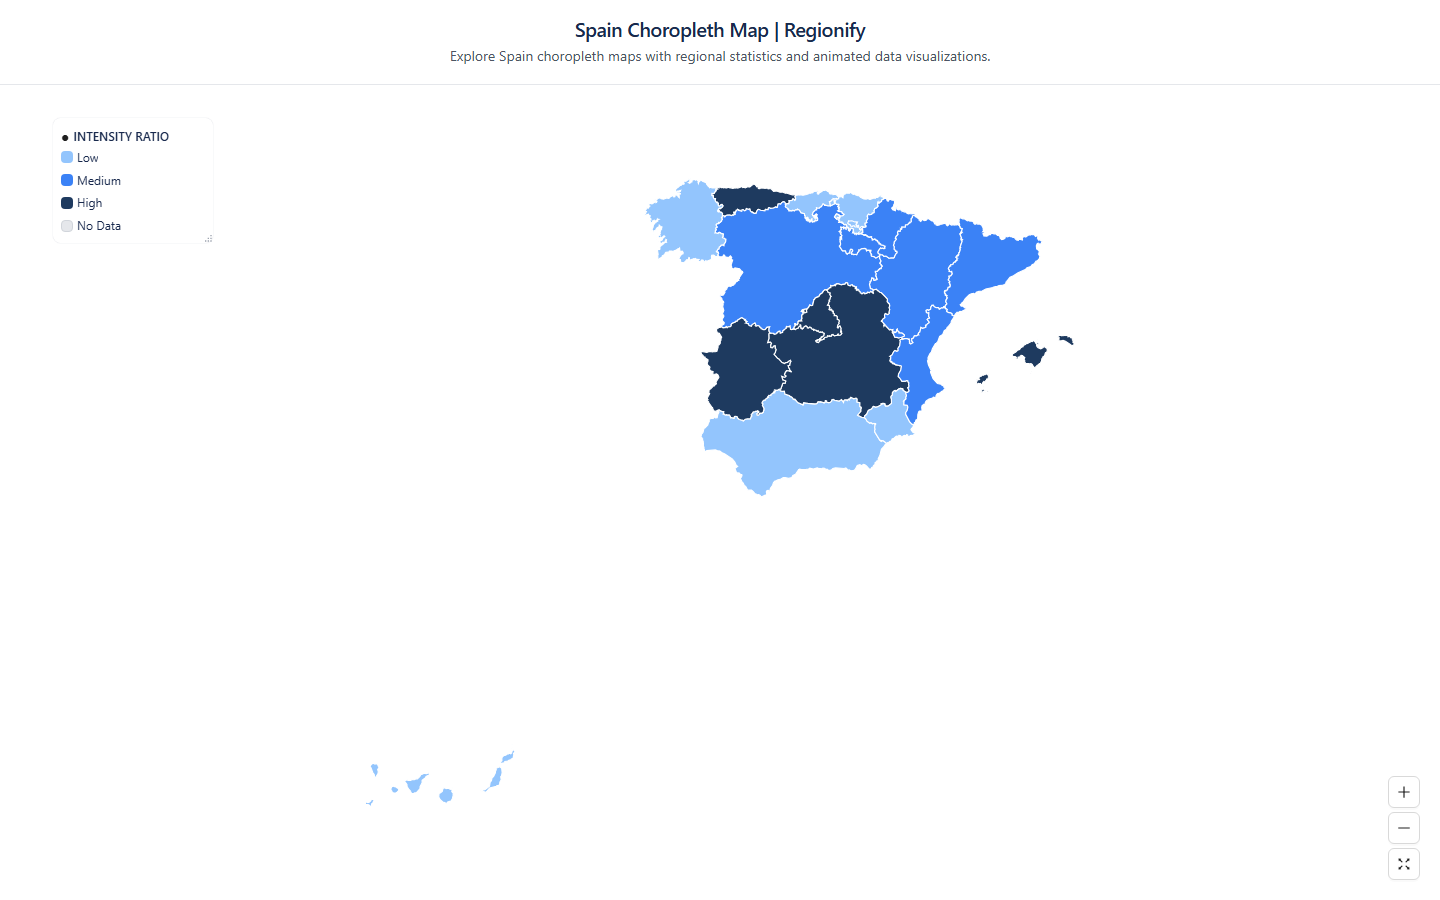
Spain choropleth map
Visualize Spain's 17 autonomous communities as a choropleth map. Color regions by any numeric dataset — population, GDP, unemployment, health outcomes, and more. Export as PNG, JPEG, or PDF.
Vector SVG export
Export your Spain map as a scalable vector graphic (SVG). Ideal for print publications, editorial illustrations, and web use — scales to any resolution without quality loss.

Animated GIF
Bring your Spain data to life. Import historical time-series data and export a looping animated GIF showing how regional values changed over time.
MP4 video export
Export your Spain time-series map as an MP4 video. Perfect for presentations, reports, and social media posts where motion communicates change more clearly than static images.
Public share page
Share your Spain choropleth map with a public link. Anyone with the URL can view the full interactive map — no account or login required.
Embeddable iframe
Embed your Spain choropleth map anywhere with a single line of HTML. The iframe stays live — viewers always see the latest version of your map, no re-publishing needed.
AI-powered data import for Spain maps
No spreadsheet? No problem. Regionify's AI Agent turns a plain-text description or raw pasted data into a ready-to-visualize dataset in seconds.
AI Generator
Generate Spain data from a prompt
Describe the dataset you need in plain English — for example "GDP per capita of Spain's 17 autonomous communities in 2023" or "election results by autonomous communities" — and the AI generates a plausible, structured dataset that maps directly onto Spain's administrative boundaries. Edit any values in the table view before saving.
- ✓ Works for population, GDP, health, election, and custom metrics
- ✓ Supports time-series prompts for animated maps
- ✓ Output pre-matched to Spain's 17 autonomous communities
AI Parser
Clean and import messy Spain data
Paste raw text, a copied Wikipedia table, or an unstructured CSV with regional figures for Spain. The AI parser normalises region names, strips noise, resolves mismatched spelling across Spain's autonomous communities, and outputs a clean id–label–value table ready to visualise.
- ✓ Handles inconsistent or misspelled autonomous communities names
- ✓ Auto-detects time columns for historical data
- ✓ Streams results in real time as AI processes
AI Agent is available on the Chronographer plan.
Autonomous Communities of Spain
- Andalusia
- Aragon
- Asturias
- Cantabria
- Castile and Leon
- Castile-La Mancha
- Canary Islands
- Catalonia
- Extremadura
- Galicia
- La Rioja
- Madrid
- Murcia
- Navarra
- Balearic Islands
- Basque Country
- Valencia
Build your own Spain choropleth map — free
Upload any dataset, color Spain's autonomous communities by any numeric metric, and export as PNG, SVG, GIF, or MP4. No design skills required — start in seconds, publish anywhere.